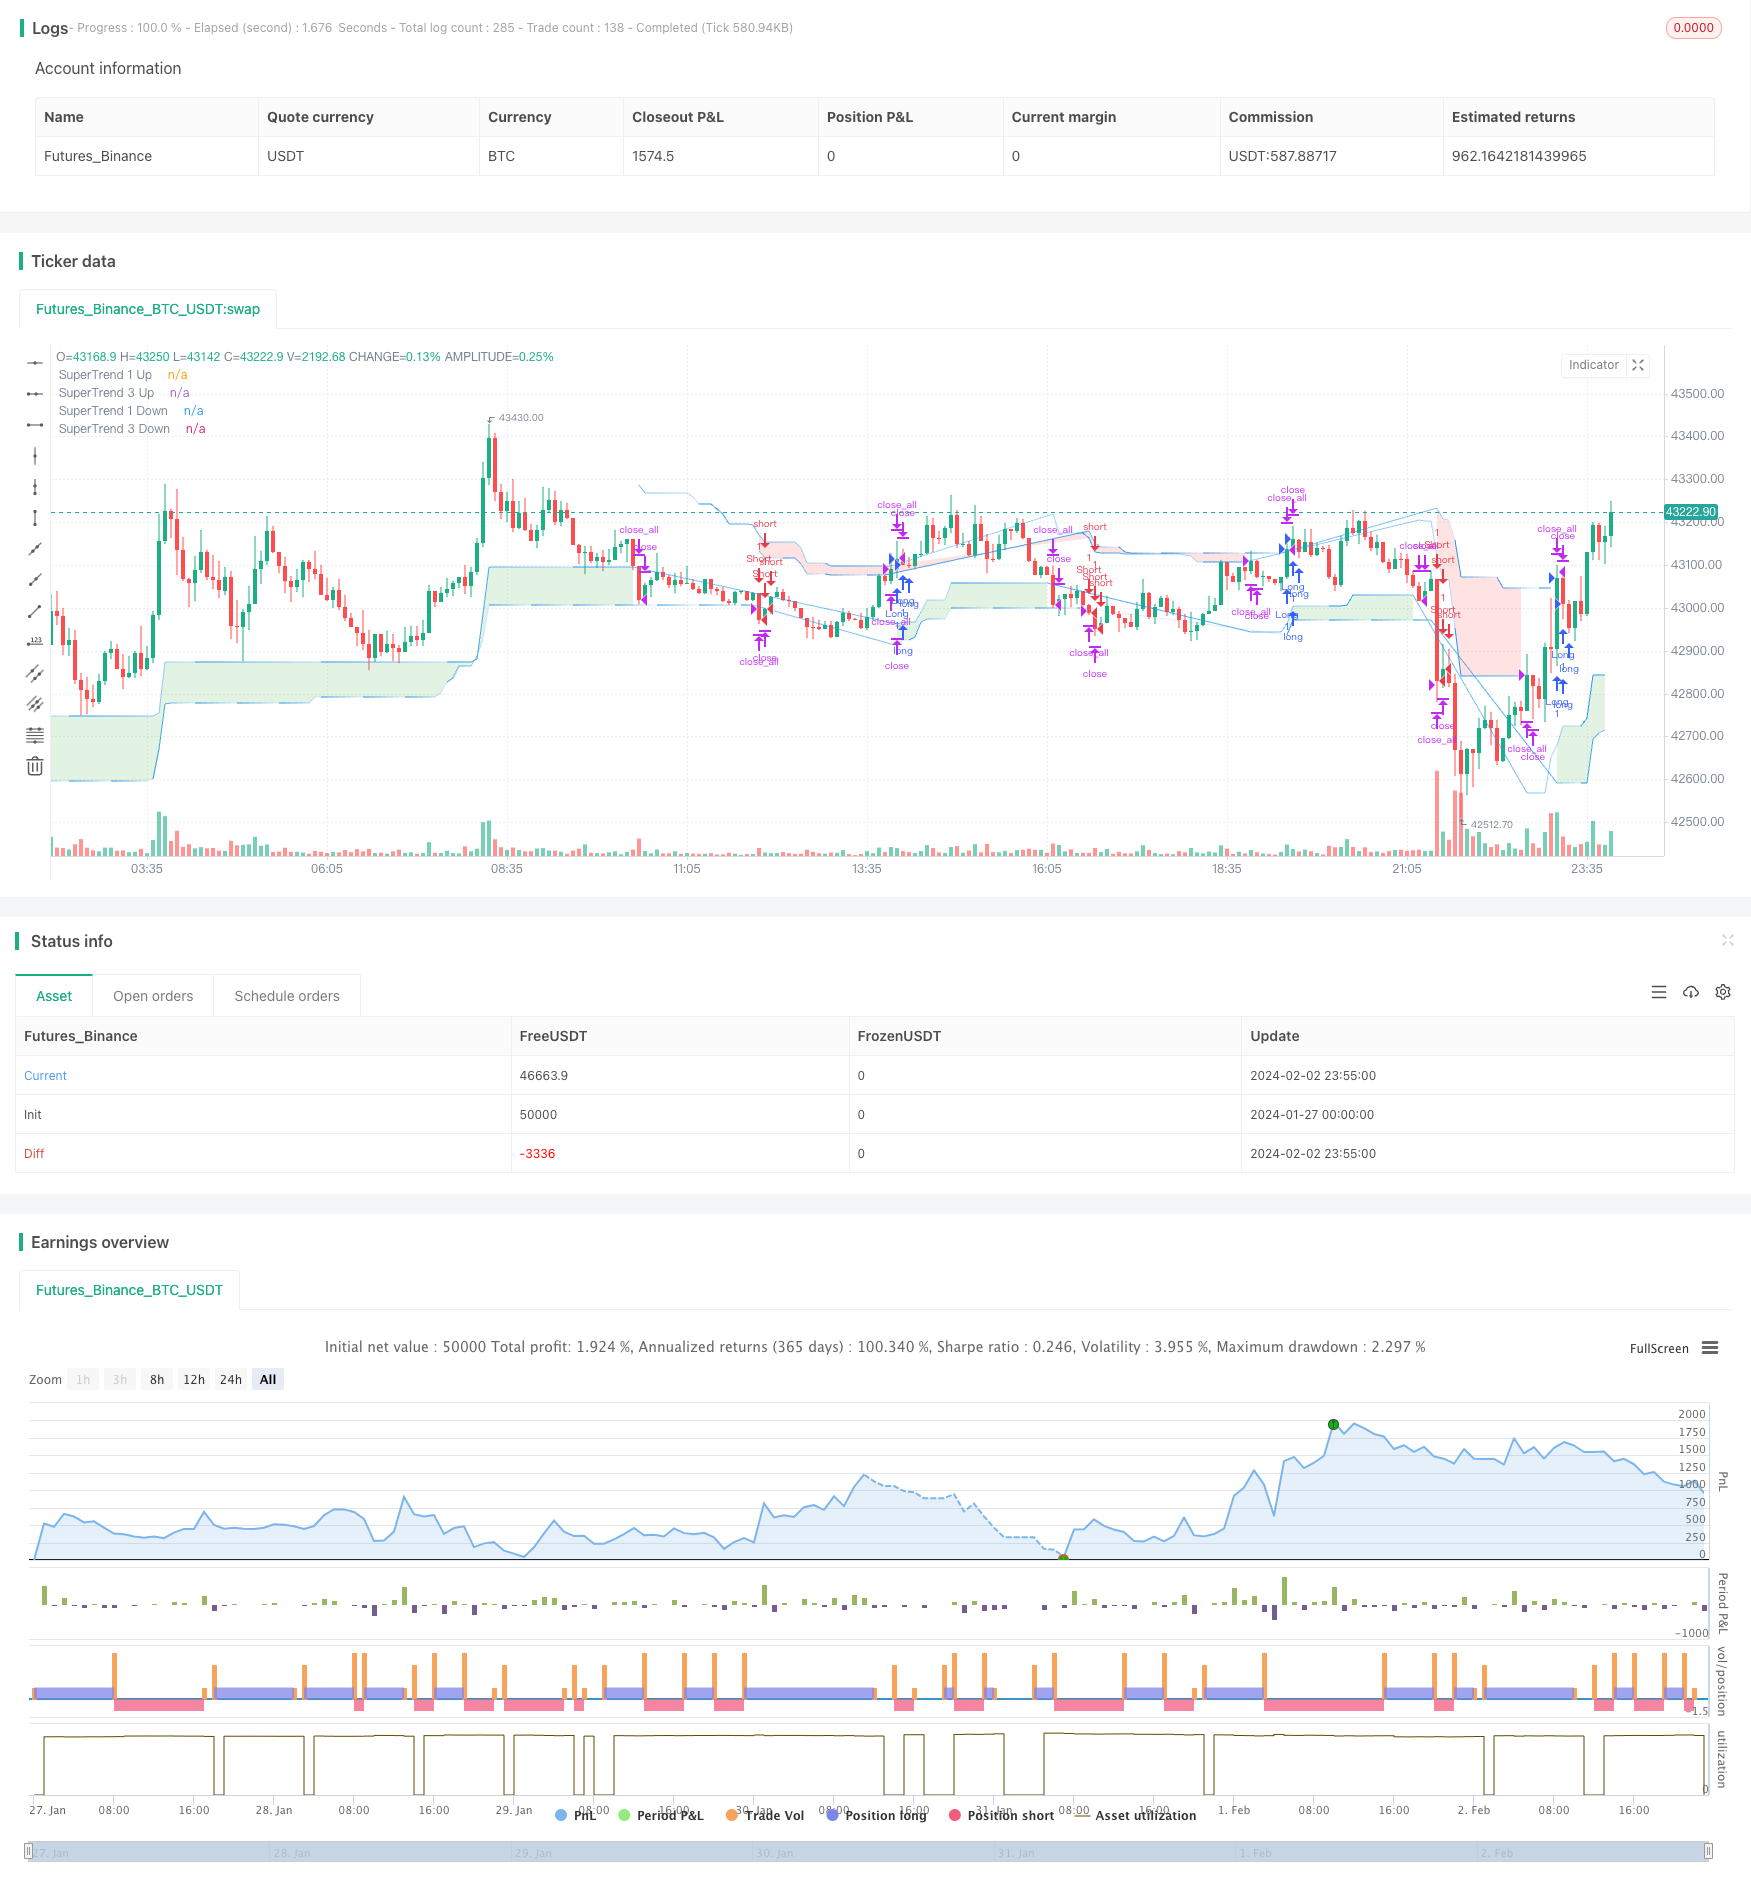
Квадратный импульс Двойные индикаторы Стратегия времени
Автор:Чао Чжан, Дата: 2024-02-04 15:53:48Тэги:

Обзор
Эта стратегия объединяет индикатор SuperTrend с теорией волны Эллиота для создания надежного технического инструмента торговли.
Принцип стратегии
Основная идея заключается в многоуровневом подходе:
- Использовать 4 индикатора SuperTrend, каждый с различными длинами ATR и мультипликаторами, чтобы судить о тенденции от краткосрочной до долгосрочной
- Определите надежные длинные и короткие сигналы с помощью конвергенции индикаторов
- Ссылка на метод распознавания моделей Elliott Wave
для выявления аналогичного поведения рынка для подтверждения торговых сигналов
Таким образом, он использует несколько индикаторов и добавляет распознавание моделей, чтобы сделать стратегию более надежной.
Анализ преимуществ
- Дизайн с использованием нескольких индикаторов обеспечивает всестороннее суждение
- Вдохновение волновой теории увеличивает стабильность через распознавание моделей
- Корректировка направления в режиме реального времени адаптируется к изменениям рынка
- Конфигурируемые параметры подходят для различных продуктов и временных рамок
Анализ рисков
- Настройка параметров основана на опыте, требуя настройки для определения оптимальных комбинаций параметров
- Многоиндикаторный дизайн сложен, увеличивает вычислительную нагрузку
- Невозможно полностью избежать неправильной генерации сигнала
Параметры могут быть оптимизированы для постепенного определения оптимального; облачные вычисления могут улучшить вычислительную производительность; остановки потерь могут контролировать риск.
Руководство по оптимизации
Оптимизация может быть сделана в нескольких аспектах:
- Добавление адаптивного модуля регулировки параметров для динамической настройки параметров на основе рыночных условий
- Включить модели машинного обучения для оценки надежности сигнала
- Сочетание индикаторов настроения, новостных событий и т. д. для определения рыночных режимов
- Поддержка шаблонов параметров для нескольких продуктов для уменьшения нагрузки на тестирование
Это сделает параметры стратегии более умными, суждения более точными и практическое применение более удобным.
Резюме
Стратегия всесторонне рассматривает как тенденции, так и модели, обеспечивая надежность суждения при одновременном увеличении гибкости. Многоиндикаторы и параметры обеспечивают полную рыночную применимость.
/*backtest
start: 2024-01-27 00:00:00
end: 2024-02-03 00:00:00
period: 5m
basePeriod: 1m
exchanges: [{"eid":"Futures_Binance","currency":"BTC_USDT"}]
*/

//@version=5
strategy("Elliott's Quadratic Momentum - Strategy [presentTrading]",shorttitle = "EQM Strategy [presentTrading]", overlay=true )

// Inputs for selecting trading direction
tradingDirection = input.string("Both", "Select Trading Direction", options=["Long", "Short", "Both"])


// SuperTrend Function
supertrend(src, atrLength, multiplier) =>
    atr = ta.atr(atrLength)
    up = hl2 - (multiplier * atr)
    dn = hl2 + (multiplier * atr)
    trend = 1
    trend := nz(trend[1], 1)
    up := src > nz(up[1], 0) and src[1] > nz(up[1], 0) ?   math.max(up, nz(up[1], 0)) : up
    dn := src < nz(dn[1], 0) and src[1] < nz(dn[1], 0) ? math.min(dn, nz(dn[1], 0)) : dn
    trend := src > nz(dn[1], 0) ?  1 : src < nz(up[1], 0)? -1 : nz(trend[1], 1)
    [up, dn, trend]

// Inputs for SuperTrend settings
atrLength1 = input(7, title="ATR Length for SuperTrend 1")
multiplier1 = input(4.0, title="Multiplier for SuperTrend 1")
atrLength2 = input(14, title="ATR Length for SuperTrend 2")
multiplier2 = input(3.618, title="Multiplier for SuperTrend 2")
atrLength3 = input(21, title="ATR Length for SuperTrend 3")
multiplier3 = input(3.5, title="Multiplier for SuperTrend 3")
atrLength4 = input(28, title="ATR Length for SuperTrend 3")
multiplier4 = input(3.382, title="Multiplier for SuperTrend 3")

// Calculate SuperTrend
[up1, dn1, trend1] = supertrend(close, atrLength1, multiplier1)
[up2, dn2, trend2] = supertrend(close, atrLength2, multiplier2)
[up3, dn3, trend3] = supertrend(close, atrLength3, multiplier3)
[up4, dn4, trend4] = supertrend(close, atrLength4, multiplier4)


// Entry Conditions based on SuperTrend and Elliott Wave-like patterns
longCondition = trend1 == 1 and trend2 == 1 and trend3 == 1 and trend4 == 1
shortCondition = trend1 == -1 and trend2 == -1 and trend3 == -1 and trend4 == - 1

// Strategy Entry logic based on selected trading direction
if tradingDirection == "Long" or tradingDirection == "Both"
    if longCondition
        strategy.entry("Long", strategy.long)
        // [Any additional logic for long entry]

if tradingDirection == "Short" or tradingDirection == "Both"
    if shortCondition
        strategy.entry("Short", strategy.short)
        // [Any additional logic for short entry]


// Exit conditions - Define your own exit strategy
// Example: Exit when any SuperTrend flips
if trend1 != trend1[1] or trend2 != trend2[1] or trend3 != trend3[1] or trend4 != trend4[1]
    strategy.close_all()

// Function to apply gradient effect
gradientColor(baseColor, length, currentBar) =>
    var color res = color.new(baseColor, 100)
    if currentBar <= length
        res := color.new(baseColor, int(100 * currentBar / length))
    res

// Apply gradient effect
color1 = gradientColor(color.blue, atrLength1, bar_index % atrLength1)
color4 = gradientColor(color.blue, atrLength4, bar_index % atrLength3)


// Plot SuperTrend with gradient for upward trend
plot1Up = plot(trend1 == 1 ? up1 : na, color=color1, linewidth=1, title="SuperTrend 1 Up")
plot4Up = plot(trend4 == 1 ? up4 : na, color=color4, linewidth=1, title="SuperTrend 3 Up")

// Plot SuperTrend with gradient for downward trend
plot1Down = plot(trend1 == -1 ? dn1 : na, color=color1, linewidth=1, title="SuperTrend 1 Down")
plot4Down = plot(trend4 == -1 ? dn4 : na, color=color4, linewidth=1, title="SuperTrend 3 Down")

// Filling the area between the first and third SuperTrend lines for upward trend
fill(plot1Up, plot4Up, color=color.new(color.green, 80), title="SuperTrend Upward Band")

// Filling the area between the first and third SuperTrend lines for downward trend
fill(plot1Down, plot4Down, color=color.new(color.red, 80), title="SuperTrend Downward Band")
- Стратегия побега Вилли Вонки
- Экспоненциальная скользящая средняя и индекс относительной прочности
- Стратегия сочетания ловли обратного тренда и динамической стратегии остановки потерь
- Стратегия выхода из золотого параболы
- Стратегия отслеживания изменения импульса SAR
- Динамическая стратегия торговли по РСИ
- Кроссоверная стратегия между несколькими скользящими средними
- Стратегия двойного перемещающегося среднего выхода
- Стратегия перекрестного использования скользящей средней
- Стратегия отслеживания тенденции двойной скользящей средней
- Тенденция индекса ренко и относительной энергии в соответствии со стратегией
- Свинг-тенд Стратегия скользящей средней
- Комбинированная стратегия торговли Bollinger Band, Moving Average и MACD
- Стратегия криптовалют для роста цены
- Стратегия импульсной торговли на основе многофакторной модели
- Стратегия отслеживания тренда адаптивных полос Боллинджера
- Улучшенная стратегия прорыва RSI с остановкой потерь и получением прибыли
- Количественная стратегия торговли, основанная на РСИ и полосах Боллинджера
- Количественная стратегия торговли, основанная на SMA и Rolling Trendline
- Стохастическая недельная стратегия торговли опционами