لوڈشیلڈر باہر نکلیں
مصنف:چاؤ ژانگ، تاریخ: 2022-05-17 17:10:19ٹیگز:اے ٹی آر
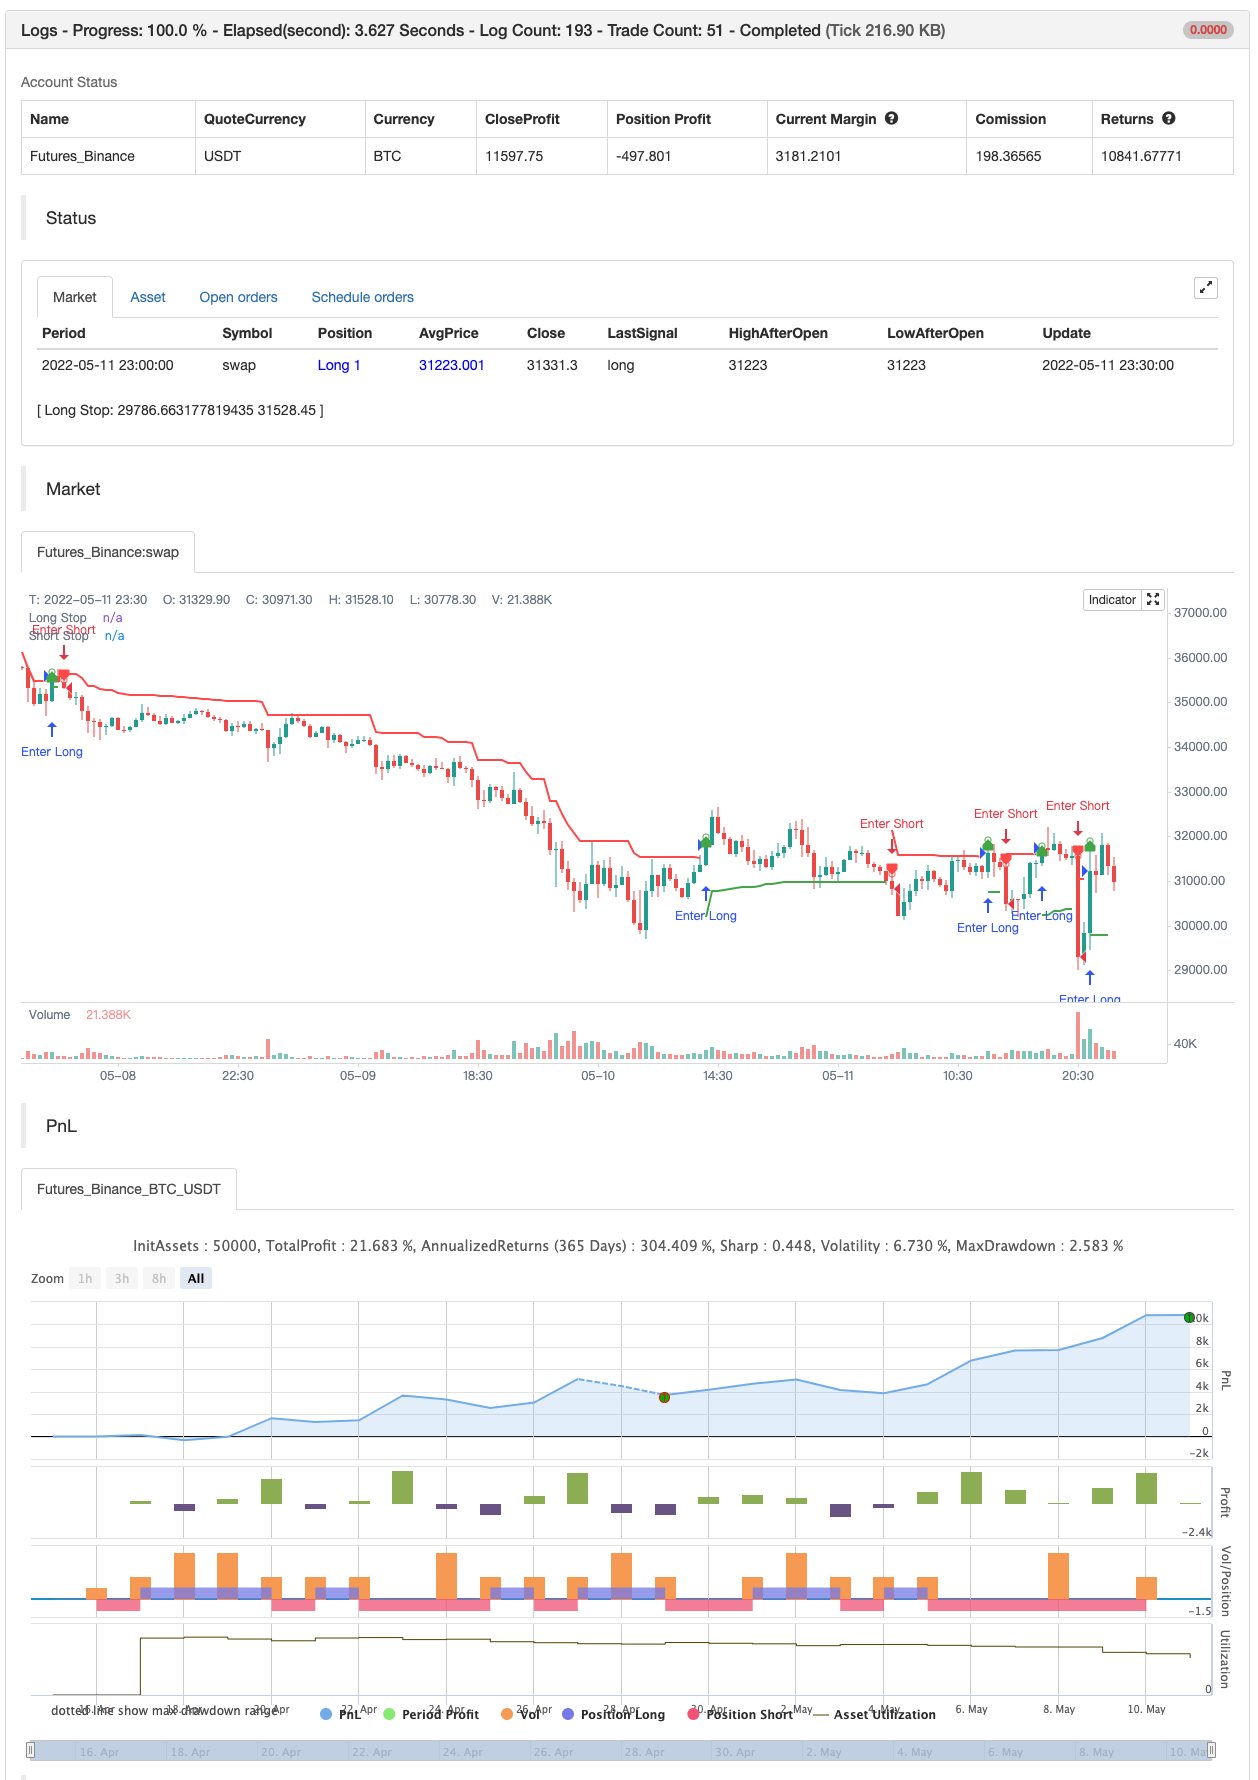
یہ Chandelier Exit اشارے کا ایک نیا ڈیزائن ہے۔ یہ Chandelier Exit
یہ اشارے اصل میں چارلس لی بو کی طرف سے تیار کیا گیا تھا اور ڈاکٹر الیگزینڈر ایلڈر نے اپنی کتاب میں مقبول کیا تھا
مختصراً، یہ اوسط حقیقی رینج (اے ٹی آر) پر مبنی ایک ٹریلنگ سٹاپ نقصان ہے۔
بیک ٹسٹ

/*backtest
start: 2022-04-16 00:00:00
end: 2022-05-11 23:59:00
period: 30m
basePeriod: 15m
exchanges: [{"eid":"Futures_Binance","currency":"BTC_USDT"}]
*/

//@version=4
// Copyright (c) 2019-present, Alex Orekhov (everget)
// Chandelier Exit script may be freely distributed under the terms of the GPL-3.0 license.
study("Chandelier Exit", shorttitle="CE", overlay=true)

length = input(title="ATR Period", type=input.integer, defval=22)
mult = input(title="ATR Multiplier", type=input.float, step=0.1, defval=3.0)
showLabels = input(title="Show Buy/Sell Labels ?", type=input.bool, defval=true)
useClose = input(title="Use Close Price for Extremums ?", type=input.bool, defval=true)
highlightState = input(title="Highlight State ?", type=input.bool, defval=true)

atr = mult * atr(length)

longStop = (useClose ? highest(close, length) : highest(length)) - atr
longStopPrev = nz(longStop[1], longStop)
longStop := close[1] > longStopPrev ? max(longStop, longStopPrev) : longStop

shortStop = (useClose ? lowest(close, length) : lowest(length)) + atr
shortStopPrev = nz(shortStop[1], shortStop)
shortStop := close[1] < shortStopPrev ? min(shortStop, shortStopPrev) : shortStop

var int dir = 1
dir := close > shortStopPrev ? 1 : close < longStopPrev ? -1 : dir

var color longColor = color.green
var color shortColor = color.red

longStopPlot = plot(dir == 1 ? longStop : na, title="Long Stop", style=plot.style_linebr, linewidth=2, color=longColor)
buySignal = dir == 1 and dir[1] == -1
plotshape(buySignal ? longStop : na, title="Long Stop Start", location=location.absolute, style=shape.circle, size=size.tiny, color=longColor, transp=0)
plotshape(buySignal and showLabels ? longStop : na, title="Buy Label", text="Buy", location=location.absolute, style=shape.labelup, size=size.tiny, color=longColor, textcolor=color.white, transp=0)

shortStopPlot = plot(dir == 1 ? na : shortStop, title="Short Stop", style=plot.style_linebr, linewidth=2, color=shortColor)
sellSignal = dir == -1 and dir[1] == 1
plotshape(sellSignal ? shortStop : na, title="Short Stop Start", location=location.absolute, style=shape.circle, size=size.tiny, color=shortColor, transp=0)
plotshape(sellSignal and showLabels ? shortStop : na, title="Sell Label", text="Sell", location=location.absolute, style=shape.labeldown, size=size.tiny, color=shortColor, textcolor=color.white, transp=0)

midPricePlot = plot(ohlc4, title="", style=plot.style_circles, linewidth=0, display=display.none, editable=false)

longFillColor = highlightState ? (dir == 1 ? longColor : na) : na
shortFillColor = highlightState ? (dir == -1 ? shortColor : na) : na
fill(midPricePlot, longStopPlot, title="Long State Filling", color=longFillColor)
fill(midPricePlot, shortStopPlot, title="Short State Filling", color=shortFillColor)

changeCond = dir != dir[1]
alertcondition(changeCond, title="Alert: CE Direction Change", message="Chandelier Exit has changed direction!")
alertcondition(buySignal, title="Alert: CE Buy", message="Chandelier Exit Buy!")
alertcondition(sellSignal, title="Alert: CE Sell", message="Chandelier Exit Sell!")


if buySignal
    strategy.entry("Enter Long", strategy.long)
else if sellSignal
    strategy.entry("Enter Short", strategy.short)
متعلقہ مواد
- ڈبل انڈیکیٹر موشن ٹرینڈ کوانٹیمیشن سسٹم
- کثیر جہتی رجحانات کا تعین اور اے ٹی آر متحرک اسٹاپ اور نقصان کی حکمت عملی
- اعلی درجے کی کثیر اشارے کے رجحانات کی تصدیق کی تجارت کی حکمت عملی
- متحرک اوسط اور دن کے پیٹرن پر مبنی ہوشیار ٹریکنگ اسٹاپ نقصان کی حکمت عملی
- کثیر عنصر واپسی اور متحرک قیمت بینڈ کی حکمت عملی کے ساتھ مقداری تجارتی نظام
- متعدد ہموار اوسط لائن متحرک کراس ٹرینڈ ٹریکنگ اور متعدد تصدیق شدہ مقداری تجارت کی حکمت عملی
- اعلی درجے کی سٹاپ نقصان متحرک ٹریکنگ کی حکمت عملی جس کی بنیاد پر بڑے پیمانے پر سطح کی ہڈیوں اور آر ایس آئی سے انحراف ہوتا ہے
- ملٹی انڈیکیٹرز کے ساتھ مل کر رجحانات کو تبدیل کرنے کی تجارتی حکمت عملی
- کینی کی راہداری کی حکمت عملی کے خلاف متعدد چینلز کی متحرک حمایت
- مشین سیکھنے نے خود کو سپر ٹرینڈ کوالٹی ٹریڈنگ کی حکمت عملی کے مطابق بنایا
- اتار چڑھاؤ کی روک تھام کی بنیاد پر اوسط لکیری رجحان ٹریکنگ کی حکمت عملی
مزید معلومات
- اسکیلپنگ پل بیک ٹول R1
- خرید و فروخت کی حکمت عملی AO+Stoch+RSI+ATR پر منحصر ہے
- ای ایم اے ٹرینڈ کلاؤڈ
- ریڈ کے حجم تیز رفتار سمت توانائی کا تناسب
- Donchian بریک آؤٹ کوئی repaint
- ریڈ کے مومنٹم بارز
- سپر جمپ ٹرن بیک بولنگر بینڈ
- فوکوز رجحان
- جانی کی BOT
- ایس ایس ایل ہائبرڈ
- ریسوٹو
- ای ایم اے کلاؤڈ انٹرا ڈے حکمت عملی
- پییوٹ پوائنٹ سپر ٹرینڈ
- سپر ٹرینڈ+4متحرک
- رفتار پر مبنی زگ زگ
- VuManChu Cipher B + Divergences حکمت عملی
- تصور دوہری سپر ٹرینڈ
- سپر اسکیلپر
- بیک ٹسٹنگ- اشارے
- ٹرینڈیلیوس