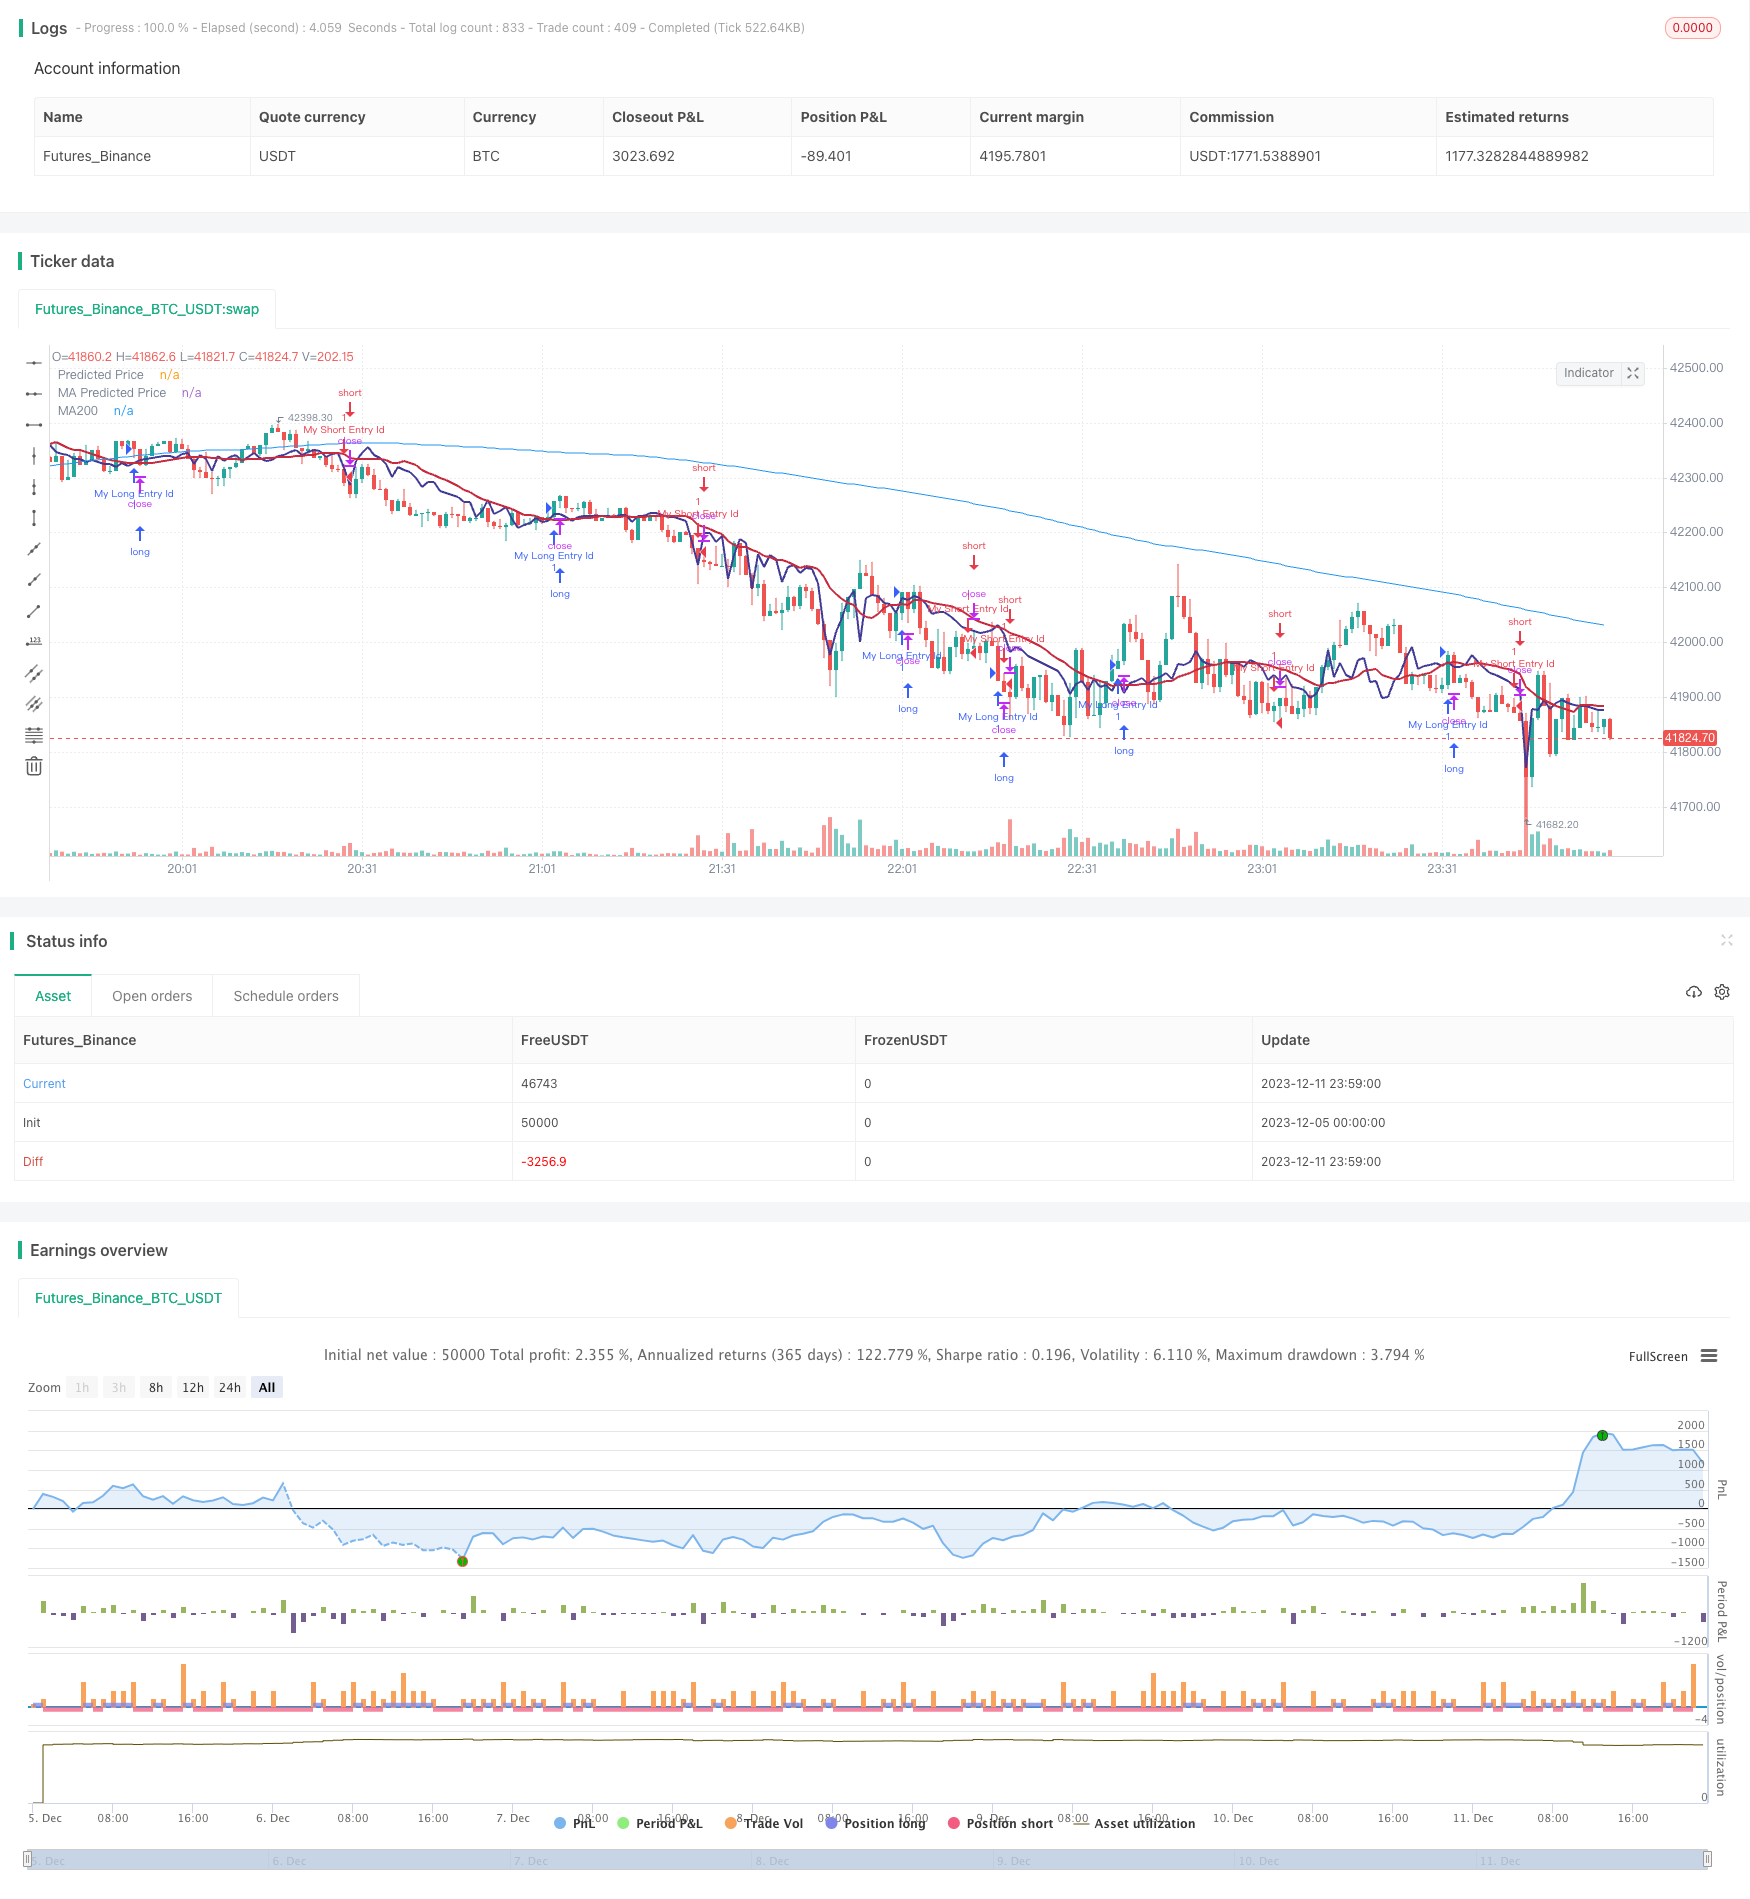
متحرک نظریاتی رجحان کو تبدیل کرنے کی حکمت عملی

جائزہ
متحرک آئیڈیولوجیکل ٹرینڈ ریورسنگ حکمت عملی قیمت کی پیش گوئی کرنے والی لکیری رجعت کا استعمال کرتی ہے اور ٹریڈنگ سگنل پیدا کرنے کے لئے آئیڈیولوجی کے ساتھ ملتی ہے جو چلتی اوسط کی تشکیل کرتی ہے۔ جب پیش گوئی کی قیمت نیچے سے اوپر کی طرف سے چلتی اوسط کو عبور کرتی ہے تو خریدنے کا سگنل پیدا ہوتا ہے۔ جب پیش گوئی کی قیمت اوپر سے نیچے کی طرف سے چلتی اوسط کو عبور کرتی ہے تو فروخت کا سگنل پیدا ہوتا ہے ، جس سے رجحان کی تبدیلی کو پکڑنا ممکن ہوتا ہے۔
حکمت عملی کا اصول
- لین دین کی مقدار پر مبنی اسٹاک کی قیمت کا حساب لگانے کے لئے لکیری رجعت ، قیمت کی پیش گوئی کی قیمت حاصل کرنا
- مختلف حالات کے تحت منتقل اوسط کا حساب لگانا
- جب پیش گوئی کی قیمت نیچے سے اوپر کی طرف منتقل ہوتی ہے تو خریدنے کا اشارہ پیدا ہوتا ہے
- جب پیش گوئی کی قیمت اوپر سے نیچے کی طرف سے منتقل اوسط سے گزرتی ہے تو فروخت کا اشارہ پیدا ہوتا ہے
- MACD اشارے کے ساتھ ٹرینڈ ریورس کا وقت
مذکورہ بالا سگنل متعدد تصدیقوں کے ساتھ مل کر ، جعلی توڑ پھوڑ سے بچنے کے لئے ، اور اس طرح سگنل کی درستگی کو بہتر بناتا ہے۔
طاقت کا تجزیہ
- قیمتوں کے رجحانات کی پیشن گوئی کے لئے لکیری رجعت کا استعمال کرتے ہوئے سگنل کی درستگی کو بہتر بنانا
- حرکت پذیر اوسط کے ساتھ مل کر نظریاتی طور پر رجحانات کی تبدیلی کو پکڑنے کے لئے
- لین دین کے حجم پر مبنی لکیری رجعت ، زیادہ معاشی معنی خیز
- MACD جیسے اشارے کے ساتھ مل کر متعدد تصدیق کریں ، جعلی سگنل کو کم کریں
خطرے کا تجزیہ
- لکیری رجعت کے پیرامیٹرز کی ترتیب کے نتائج پر بہت زیادہ اثر پڑتا ہے
- حرکت پذیر اوسط کی ترتیب بھی سگنل کے معیار کو متاثر کرتی ہے
- تصدیق کے طریقہ کار کے باوجود ، غلط سگنل کا خطرہ موجود ہے
- کوڈ کو مزید بہتر بنایا جاسکتا ہے تاکہ تجارت کو کم کیا جاسکے اور منافع میں اضافہ کیا جاسکے
اصلاح کی سمت
- لکیری رجعت اور منتقل اوسط کے لئے پیرامیٹرز کو بہتر بنائیں
- تصدیق کی شرائط میں اضافہ، جعلی سگنل کی شرح میں کمی
- مزید عوامل کے ساتھ رجحان کو تبدیل کرنے کے معیار کا فیصلہ
- اسٹاپ نقصان کی حکمت عملی کو بہتر بنانا اور ایک ہی تجارت کے خطرے کو کم کرنا
خلاصہ کریں۔
متحرک نظریہ رجحان الٹ حکمت عملی ایک نظریہ ہے جو لکیری رجعت کی پیش گوئی اور حرکت پذیری اوسط کی تشکیل کو مربوط کرتا ہے تاکہ رجحان الٹ کے وقت کو پکڑ سکے۔ اس میں ایک ہی اشارے کے مقابلے میں زیادہ وشوسنییتا ہے۔ اس کے علاوہ ، حکمت عملی پیرامیٹرز کو ایڈجسٹ کرنے اور تصدیق کی شرائط کو بہتر بنانے کے ذریعے سگنل کے معیار اور منافع کی سطح کو مزید بڑھا سکتی ہے۔
/*backtest
start: 2023-12-05 00:00:00
end: 2023-12-12 00:00:00
period: 1m
basePeriod: 1m
exchanges: [{"eid":"Futures_Binance","currency":"BTC_USDT"}]
*/

// This source code is subject to the terms of the Mozilla Public License 2.0 at https://mozilla.org/MPL/2.0/
// © stocktechbot
//@version=5
strategy("Linear Cross", overlay=true, margin_long=100, margin_short=0)

//Linear Regression

vol = volume

// Function to calculate linear regression
linregs(y, x, len) =>
    ybar = math.sum(y, len)/len
    xbar = math.sum(x, len)/len
    b = math.sum((x - xbar)*(y - ybar),len)/math.sum((x - xbar)*(x - xbar),len)
    a = ybar - b*xbar
    [a, b]

// Historical stock price data
price = close

// Length of linear regression
len = input(defval = 21, title = 'Strategy Length')
linearlen=input(defval = 9, title = 'Linear Lookback')
[a, b] = linregs(price, vol, len)

// Calculate linear regression for stock price based on volume
//eps = request.earnings(syminfo.ticker, earnings.actual)
//MA For double confirmation

out = ta.sma(close, 200)
outf = ta.sma(close, 50)
outn = ta.sma(close, 90)
outt = ta.sma(close, 21)
outthree = ta.sma(close, 9)

// Predicted stock price based on volume
predicted_price = a + b*vol

// Check if predicted price is between open and close
is_between = open < predicted_price and predicted_price < close

//MACD
//[macdLine, signalLine, histLine] = ta.macd(close, 12, 26, 9)

// Plot predicted stock price
plot(predicted_price, color=color.rgb(65, 59, 150), linewidth=2, title="Predicted Price")
plot(ta.sma(predicted_price,linearlen), color=color.rgb(199, 43, 64), linewidth=2, title="MA Predicted Price")
//offset = input.int(title="Offset", defval=0, minval=-500, maxval=500)
plot(out, color=color.blue, title="MA200")
[macdLine, signalLine, histLine] = ta.macd(predicted_price, 12, 26, 9)

//BUY Signal

longCondition=false
mafentry =ta.sma(close, 50) > ta.sma(close, 90)
//matentry = ta.sma(close, 21) > ta.sma(close, 50)
matwohun = close > ta.sma(close, 200)
twohunraise = ta.rising(out, 2)
twentyrise = ta.rising(outt, 2)
macdrise = ta.rising(macdLine,2)
macdlong = ta.crossover(predicted_price, ta.wma(predicted_price,linearlen))  and (signalLine < macdLine)
if macdlong and macdrise
    longCondition := true

if (longCondition)
    strategy.entry("My Long Entry Id", strategy.long)
//Sell Signal
lastEntryPrice = strategy.opentrades.entry_price(strategy.opentrades - 1)
daysSinceEntry = len
daysSinceEntry := int((time - strategy.opentrades.entry_time(strategy.opentrades - 1)) / (24 * 60 * 60 * 1000))
percentageChange = (close - lastEntryPrice) / lastEntryPrice * 100
//trailChange = (ta.highest(close,daysSinceEntry) - close) / close * 100

//label.new(bar_index, high, color=color.black, textcolor=color.white,text=str.tostring(int(trailChange)))
shortCondition=false
mafexit =ta.sma(close, 50) < ta.sma(close, 90)
matexit = ta.sma(close, 21) < ta.sma(close, 50)
matwohund = close < ta.sma(close, 200)
twohunfall = ta.falling(out, 3)
twentyfall = ta.falling(outt, 2)
shortmafall = ta.falling(outthree, 1)
macdfall = ta.falling(macdLine,1)
macdsell = macdLine < signalLine
if macdfall and macdsell and (macdLine < signalLine) and ta.falling(low,2)
    shortCondition := true

if (shortCondition)
    strategy.entry("My Short Entry Id", strategy.short)