انٹرا ایئر ایڈجسٹمنٹ پر مبنی RSI سوئنگ ٹریڈنگ حکمت عملی
تخلیق کی تاریخ:
2024-02-29 10:54:45
آخر میں ترمیم کریں:
2024-02-29 10:54:45
کاپی:
0
کلکس کی تعداد:
610
1
پر توجہ دیں
1628
پیروکار

جائزہ
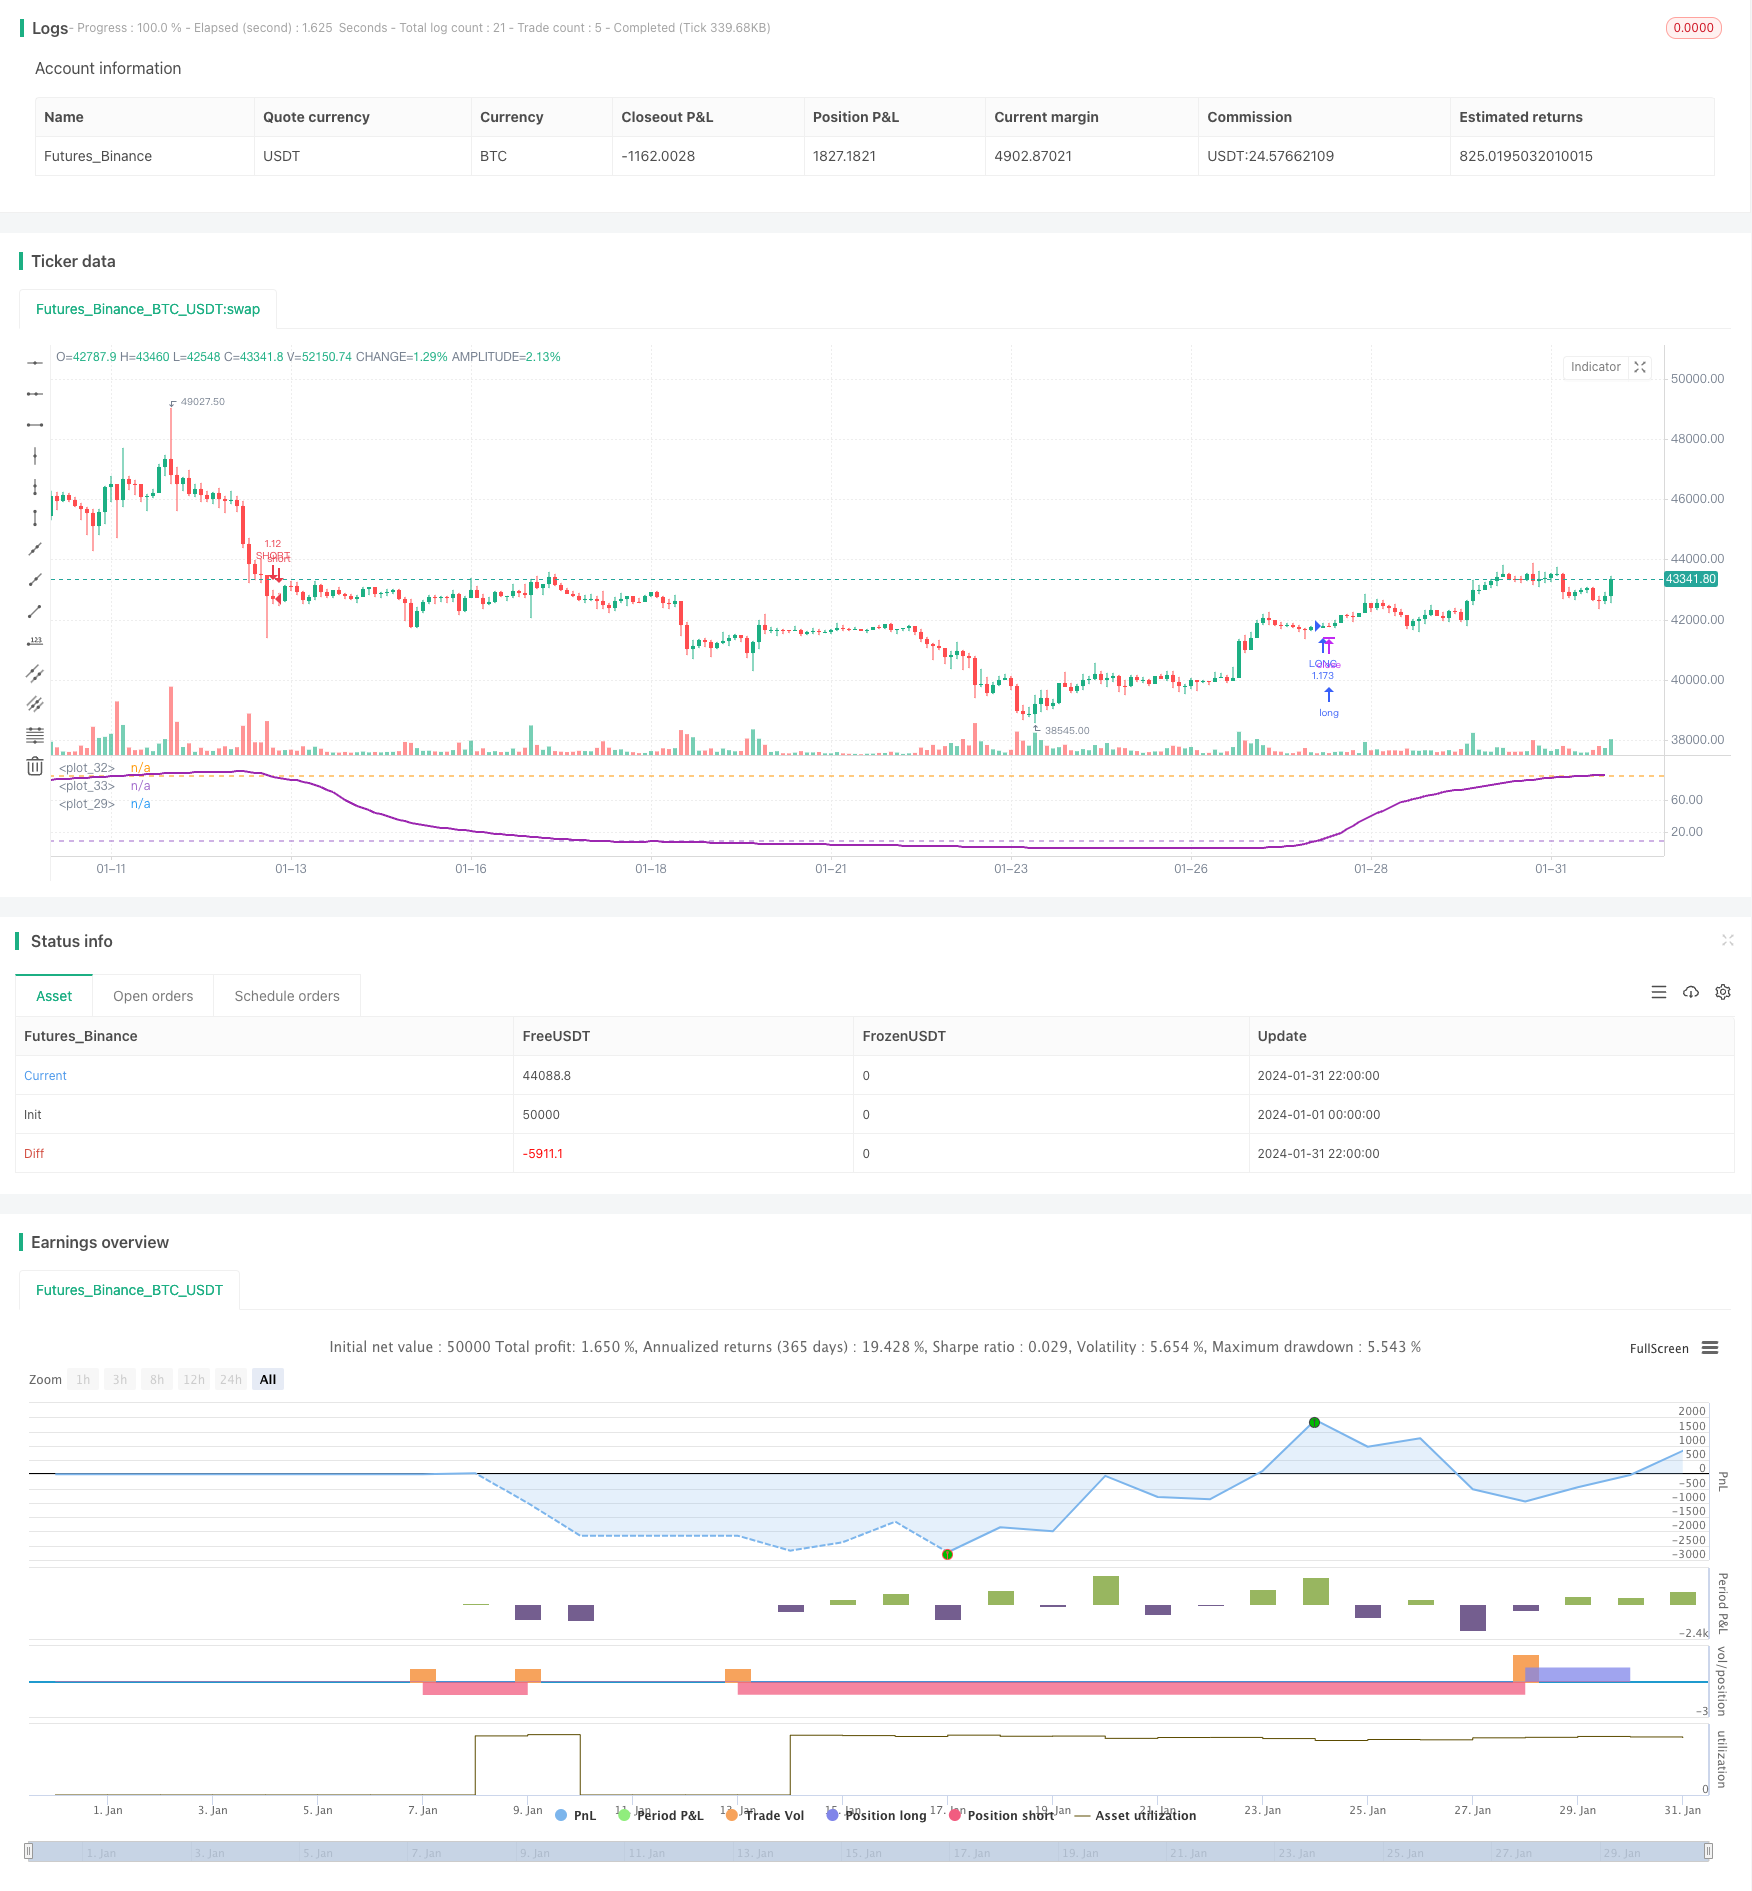
یہ حکمت عملی ایک سال کے دوران ایڈجسٹ پر مبنی آر ایس آئی شاک ٹریڈنگ حکمت عملی ہے جس میں آر ایس آئی اشارے کے درمیان طے شدہ اوپر اور نیچے کے درمیان شاک کی خصوصیات کو ٹریک کرکے ٹریڈنگ سگنل جاری کیا جاتا ہے جب آر ایس آئی اشارے اوپر اور نیچے کی ٹریک کو چھوتا ہے۔
حکمت عملی کا اصول
- ایم اے اوسط لائن کی لمبائی ، آر ایس آئی پیرامیٹرز ، اوپر اور نیچے کی ٹریک ، اسٹاپ اور نقصان کی پیرامیٹرز ، ٹریڈنگ سائیکل کی حد مقرر کریں
- RSI اشارے کی قیمت کا حساب لگائیں ، RSI = ((اوسط اضافہ) / ((اوسط اضافہ + اوسط کمی))*100
- آر ایس آئی کے اشارے اور اس کے اوپر اور نیچے کے راستے کا نقشہ
- RSI اشارے پر ٹرانسمیشن ٹرانسمیشن ٹرانسمیشن ٹرانسمیشن ٹرانسمیشن ٹرانسمیشن
- او سی او لسٹنگ کے لئے پوزیشن کھولنا
- سیٹ اپ سٹاپ نقصان کے منطق کے مطابق سٹاپ نقصان اور سٹاپ
حکمت عملی کا تجزیہ
- سال کے اندر تجارت کے دورانیے کو ترتیب دینے سے کچھ غیر مناسب بیرونی ماحول سے بچا جاسکتا ہے۔
- آر ایس آئی اشارے اوورلوڈ اور اوورلوڈ کو مؤثر طریقے سے ظاہر کرسکتے ہیں ، اور معقول حد تک صدمے کی تجارت کی طرف سے کچھ شور کو فلٹر کرسکتے ہیں۔
- او سی او لٹکن اور اسٹاپ اسٹاپ نقصان کی ترتیب کے ساتھ ، اعلی کارکردگی کا خطرہ کنٹرول حاصل کیا جاسکتا ہے۔
حکمت عملی کے خطرے کا تجزیہ
- RSI تنقیدی فیصلے کی درستگی کی ضمانت نہیں دی جاسکتی ہے ، اور اس میں غلطی کا خطرہ ہوسکتا ہے۔
- سال کے اندر ٹریڈنگ سائیکل کی غلط ترتیب بہتر تجارتی مواقع سے محروم ہوسکتی ہے یا غیر مناسب تجارتی ماحول میں داخل ہوسکتی ہے۔
- اسٹاپ نقصان کی حد بہت زیادہ ہے جس سے زیادہ نقصان ہوسکتا ہے ، اور اسٹاپ نقصان کی حد بہت کم ہے جس سے کم منافع ہوسکتا ہے۔
آر ایس آئی پیرامیٹرز ، ٹریڈنگ سائیکل ٹائم رینج ، اسٹاپ اسٹاپ نقصان تناسب وغیرہ کو ایڈجسٹ کرکے اصلاح کی جاسکتی ہے۔
حکمت عملی کی اصلاح کی سمت
- مختلف بازاروں میں مختلف دورانیوں کے لئے RSI پیرامیٹرز کی زیادہ سے زیادہ جانچ
- مجموعی طور پر مارکیٹ کے دورانیے کے قوانین کا تجزیہ کریں اور سال کے بہترین وقت کا تعین کریں
- معقول اسٹاپ نقصان کا تناسب تعین کرنے کے لئے بیک اپ
- تجارت کے انتخاب کو بہتر بنانے اور پوزیشنوں کو بڑھانے کے لئے
- دوسرے بہتر ٹریڈنگ تکنیک یا اشارے کے ساتھ مل کر بہتر بنائیں
خلاصہ کریں۔
اس حکمت عملی نے سال کے دوران آر ایس آئی اشارے کے مخصوص دورانیے کی لرزتی خصوصیات کے ذریعہ رجحانات کی پیروی کی تجارت کی ، جس سے تجارتی خطرے کو مؤثر طریقے سے کنٹرول کیا جاسکے۔ پیرامیٹرز کی اصلاح اور قواعد کی اصلاح کے ذریعہ حکمت عملی کی اعلی تاثیر حاصل کی جاسکتی ہے۔
حکمت عملی کا ماخذ کوڈ
/*backtest
start: 2024-01-01 00:00:00
end: 2024-01-31 23:59:59
period: 2h
basePeriod: 15m
exchanges: [{"eid":"Futures_Binance","currency":"BTC_USDT"}]
*/

//@version=3
strategy(title = "Bitlinc MARSI Study AST",shorttitle="Bitlinc MARSI Study AST",default_qty_type = strategy.percent_of_equity, default_qty_value = 100,commission_type=strategy.commission.percent,commission_value=0.1,initial_capital=1000,currency="USD",pyramiding=0, calc_on_order_fills=false)

// === General Inputs ===
lengthofma = input(62, minval=1, title="Length of MA")
len = input(31, minval=1, title="Length")
upperband = input(89, minval=1, title='Upper Band for RSI')
lowerband = input(10, minval=1, title="Lower Band for RSI")
takeprofit =input(1.25, title="Take Profit Percent")
stoploss =input(.04, title ="Stop Loss Percent")
monthfrom =input(8, title = "Month Start")
monthuntil =input(12, title = "Month End")
dayfrom=input(1, title= "Day Start")
dayuntil=input(31, title= "Day End")

// === Innput Backtest Range ===
//FromMonth = input(defval = 9, title = "From Month", minval = 1, maxval = 12)
//FromDay   = input(defval = 1, title = "From Day", minval = 1, maxval = 31)
//FromYear  = input(defval = 2018, title = "From Year", minval = 2017)
//ToMonth   = input(defval = 1, title = "To Month", minval = 1, maxval = 12)
//ToDay     = input(defval = 1, title = "To Day", minval = 1, maxval = 31)
//ToYear    = input(defval = 9999, title = "To Year", minval = 2017)

// === Create RSI ===
src=sma(close,lengthofma)
up = rma(max(change(src), 0), len)
down = rma(-min(change(src), 0), len)
rsi = down == 0 ? 100 : up == 0 ? 0 : 100 - (100 / (1 + up / down))
plot(rsi,linewidth = 2, color=purple)

// === Plot Bands ===
band1 = hline(upperband)
band0 = hline(lowerband)
fill(band1, band0, color=blue, transp=95)

// === Entry and Exit Methods ===
longCond =  crossover(rsi,lowerband)
shortCond =  crossunder(rsi,upperband)

// === Long Entry Logic ===
if (  longCond )
    strategy.entry("LONG", strategy.long, stop=close, oca_name="TREND", comment="LONG")
else
    strategy.cancel(id="LONG")

// === Short Entry Logic ===
if ( shortCond   )
    strategy.entry("SHORT", strategy.short,stop=close, oca_name="TREND",  comment="SHORT")
else
    strategy.cancel(id="SHORT")

// === Take Profit and Stop Loss Logic ===
//strategy.exit("Take Profit LONG", "LONG", profit = close * takeprofit / syminfo.mintick, loss = close * stoploss / syminfo.mintick)
//strategy.exit("Take Profit SHORT", "SHORT", profit = close * takeprofit / syminfo.mintick, loss = close * stoploss / syminfo.mintick)
strategy.exit("LONG TAKE PROFIT", "LONG", profit = close * takeprofit / syminfo.mintick)
strategy.exit("SHORT STOP LOSS", "SHORT", profit = close * takeprofit / syminfo.mintick)
strategy.exit("LONG STOP LOSS", "LONG", loss = close * stoploss / syminfo.mintick)
strategy.exit("SHORT STOP LOSS", "SHORT", loss = close * stoploss / syminfo.mintick)