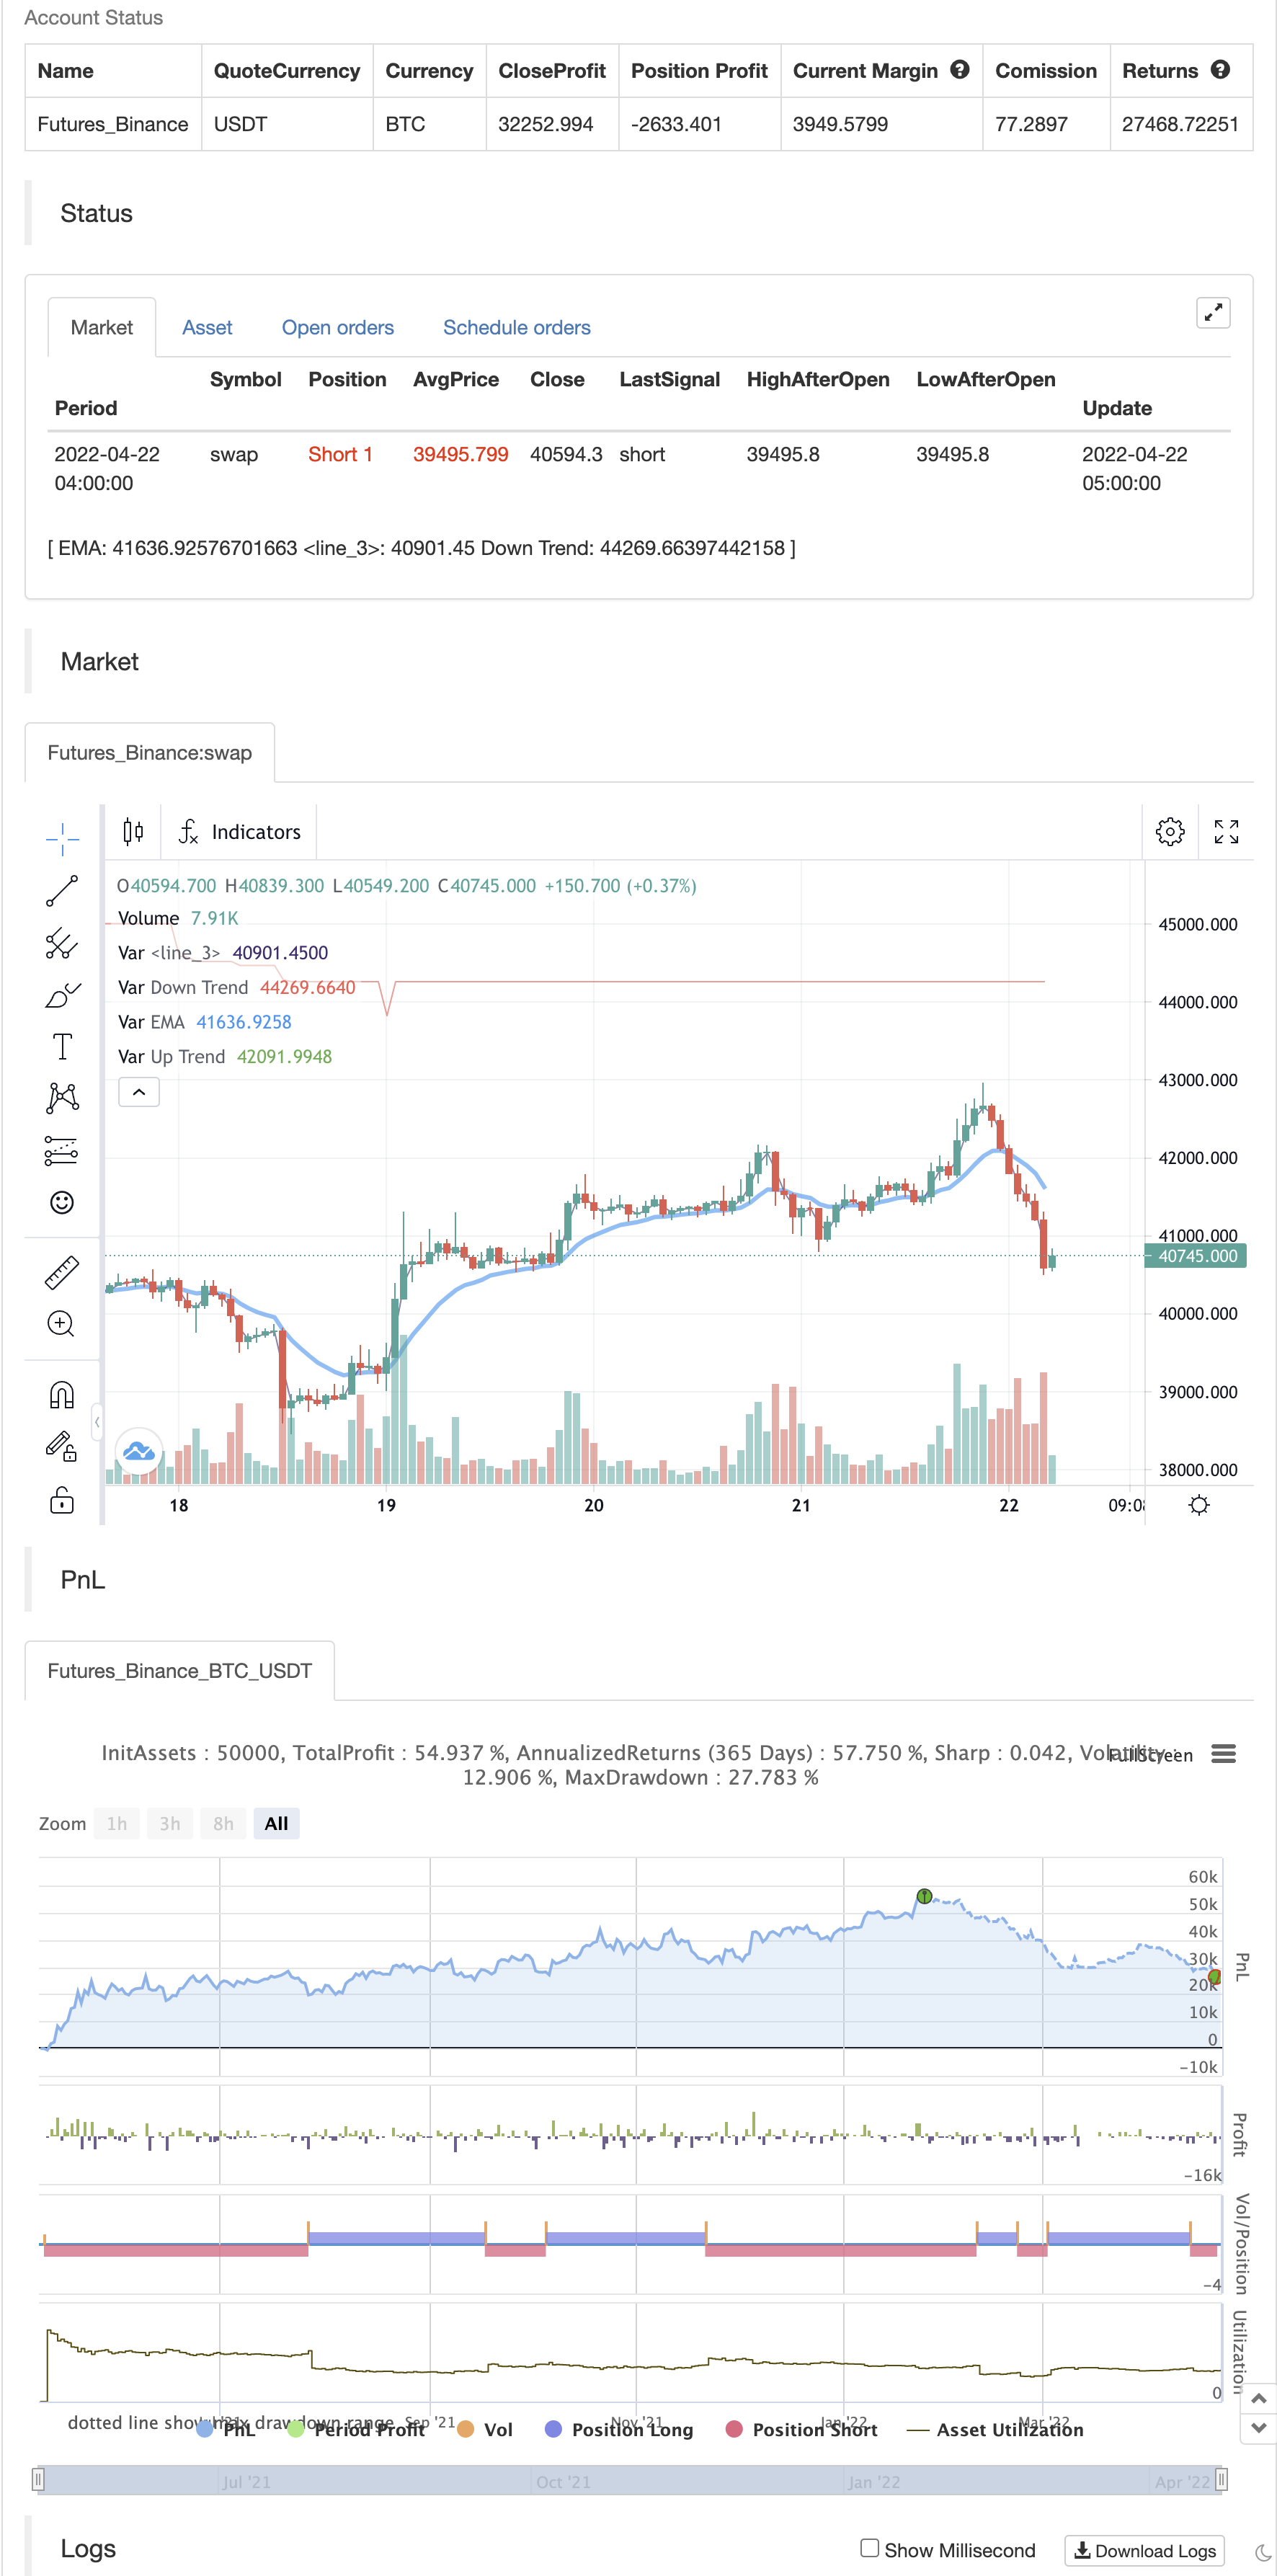
Đường trung bình chuyển động màu EMA/SMA
Tác giả:ChaoZhang, Ngày: 2022-05-11 21:03:07Tags:EMA
Amazon Prime Video trình bày Garage Garaj Jugalbandi Video Song từ Bandish Bandits. Một bài hát dân gian do Ritwik Bhowmik và Atul Kulkarni trình diễn, được hát bởi Farid Hasan & Mohammed Aman, âm nhạc do Shankar Ehsaan Loy đạo diễn và lời của Sameer Samant.
backtest

/*backtest
start: 2021-05-10 00:00:00
end: 2022-04-22 05:20:00
period: 1h
basePeriod: 15m
exchanges: [{"eid":"Futures_Binance","currency":"BTC_USDT"}]
*/

// This source code is subject to the terms of the Mozilla Public License 2.0 at https://mozilla.org/MPL/2.0/
// © subhajitbhattacharya


//@version=5
indicator('Moving Average Colored EMA/SMA', overlay=true, precision=2)
gr1 = "Moving Average Colored EMA/SMA"
emaplot = input(true, title='Show EMA on chart',group=gr1)
len = input.int(13, minval=1, title='Ema Length',group=gr1)
src = close
out = ta.ema(src, len)
up = out > out[1]
down = out < out[1]
mycolor = up ? color.green : down ? color.red : color.blue
plot(out and emaplot ? out : na, title='EMA', color=mycolor, linewidth=3)


smaplot = input(false, title='Show SMA on chart',group=gr1)
len2 = input.int(23, minval=1, title='Sma Length',group=gr1)
src2 = close
out2 = ta.sma(src2, len2)
up2 = out2 > out2[1]
down2 = out2 < out2[1]
mycolor2 = up2 ? color.green : down2 ? color.red : color.blue
plot(out2 and smaplot ? out2 : na, title='SMA', color=mycolor2, linewidth=1)


//===================== Holders Sentiment ==================================================

gr2 = 'Holders Sentiment'
length = input.int(50,group=gr2)
src3 = input(close, title='Source',group=gr2)

zeroline = 0
// hzplot = plot(zeroline, color=color.new(color.black, 0))
difabs = (src3[0] - src3[length]) / src3[length] * 100
plotColour = difabs > 0 ? color.green : color.red
// changeplot = plot(difabs, color=plotColour, linewidth=2)
// fill(plot1=changeplot, plot2=hzplot, color=color.new(color.blue, 90))

//================ Supertrend ================================================

gr3 = "Supertrend"
tf = input.timeframe('D', "Resolution",group=gr3)
atrPeriod = input(10, "ATR Length",group=gr3)
factor = input.float(3.0, "Factor", step = 0.01,group=gr3)

[supertrend, direction] = request.security(syminfo.tickerid, tf, ta.supertrend(factor, atrPeriod), barmerge.gaps_off, barmerge.lookahead_off)

bodyMiddle = plot((open + close) / 2, display=display.none)
upTrend = plot(direction < 0 ? supertrend : na, "Up Trend", color = color.green, style=plot.style_linebr)
downTrend = plot(direction < 0? na : supertrend, "Down Trend", color = color.red, style=plot.style_linebr)

//fill(bodyMiddle, upTrend, color.new(color.green, 90), fillgaps=false)
//fill(bodyMiddle, downTrend, color.new(color.red, 90), fillgaps=false)

//=================================================================================

bs1 = ta.crossover(out,out2) ? 1 : ta.crossunder(out,out2) ? -1 : 0
bs2 = difabs > 0 ? 1 : -1
bs3 = direction < 0 ? 1 : -1
bs = 0
bs := bs1 == 1 and bs2 == 1 and bs3 == 1 ? 1 : bs1 == -1 and bs2 == -1 and bs3 == -1 ? -1 : 0

buy = bs == 1 and nz(bs[1]) !=1
sell = bs == -1 and nz(bs[1]) != -1

//bgcolor(buy ? color.new(#00ff00, 50) : na)
//if buy
//    label.new(bar_index, low, yloc = yloc.belowbar, text="Buy", textcolor = #00ff00, size = size.large, style=label.style_none)
//
//bgcolor(sell ? color.new(#b92ad8, 80) : na)
//if sell
//    label.new(bar_index,high, yloc = yloc.abovebar, text="Sell", textcolor = #b92ad8, size = size.large, style=label.style_none)


alertcondition(buy, title='Buy Alert', message='Buy')
alertcondition(sell, title='sell Alert', message='Sell')


if buy
    strategy.entry("Enter Long", strategy.long)
else if sell
    strategy.entry("Enter Short", strategy.short)
Nội dung liên quan
- Xác định xu hướng đa chiều và chiến lược dừng lỗ động của ATR
- Xu hướng đa chỉ số cao xác nhận chiến lược giao dịch
- Chiến lược theo dõi xu hướng thích nghi và xác nhận nhiều giao dịch
- Chiến lược tối ưu hóa giao dịch trong ngày với hệ thống đường thẳng động kết hợp với chỉ số động lực RSI
- Chiến lược theo dõi xu hướng động lực qua nhiều chỉ số công nghệ
- Xu hướng EMA kết hợp với việc quay lại vị trí đột phá chiến lược giao dịch
- Chiến lược giao dịch định lượng các thông số động của RSI hỗ trợ giao dịch đa đường
- Xu hướng động quyết định chiến lược giao thoa chỉ số RSI
- Chiến lược theo dõi xu hướng chéo kép: đường thẳng chỉ số và hệ thống giao dịch đồng bộ MACD
- Nhiều chỉ số, xu hướng đa chiều, chiến lược định lượng cao
- Chiến lược giao dịch định lượng theo dõi và xác nhận nhiều xu hướng chéo động đa trượt trung tuyến
Nhiều hơn nữa
- Mô hình cảnh báo phóng mặt trăng [Dấu hiệu]
- HALFTREND + HEMA + SMA (Chiến lược tín hiệu sai)
- RSI Divergence với Pivot, BB, SMA, EMA, SMMA, WMA, VWMA
- RSI và BB và đồng thời OverSold
- Quay nến Heikin Ashi
- Combo 2/20 EMA & Bandpass Filter
- ESSMA
- 3EMA
- Các khối thứ tự trục trục
- NMVOB-S
- Nhóm MAHL
- 3 Tăng siêu xu hướng trong kịch bản duy nhất này
- Chỉ số Swing High/Low với xác nhận của MACD và EMA
- Triple EMA + MACD
- Chơi trò chơi.
- Fractals nhỏ hơn (+ minh bạch)
- Các điểm nhập BB-RSI-ADX
- Hull-4ema
- Chỉ số đường dẫn theo góc tấn công
- KijunSen Line với Cross