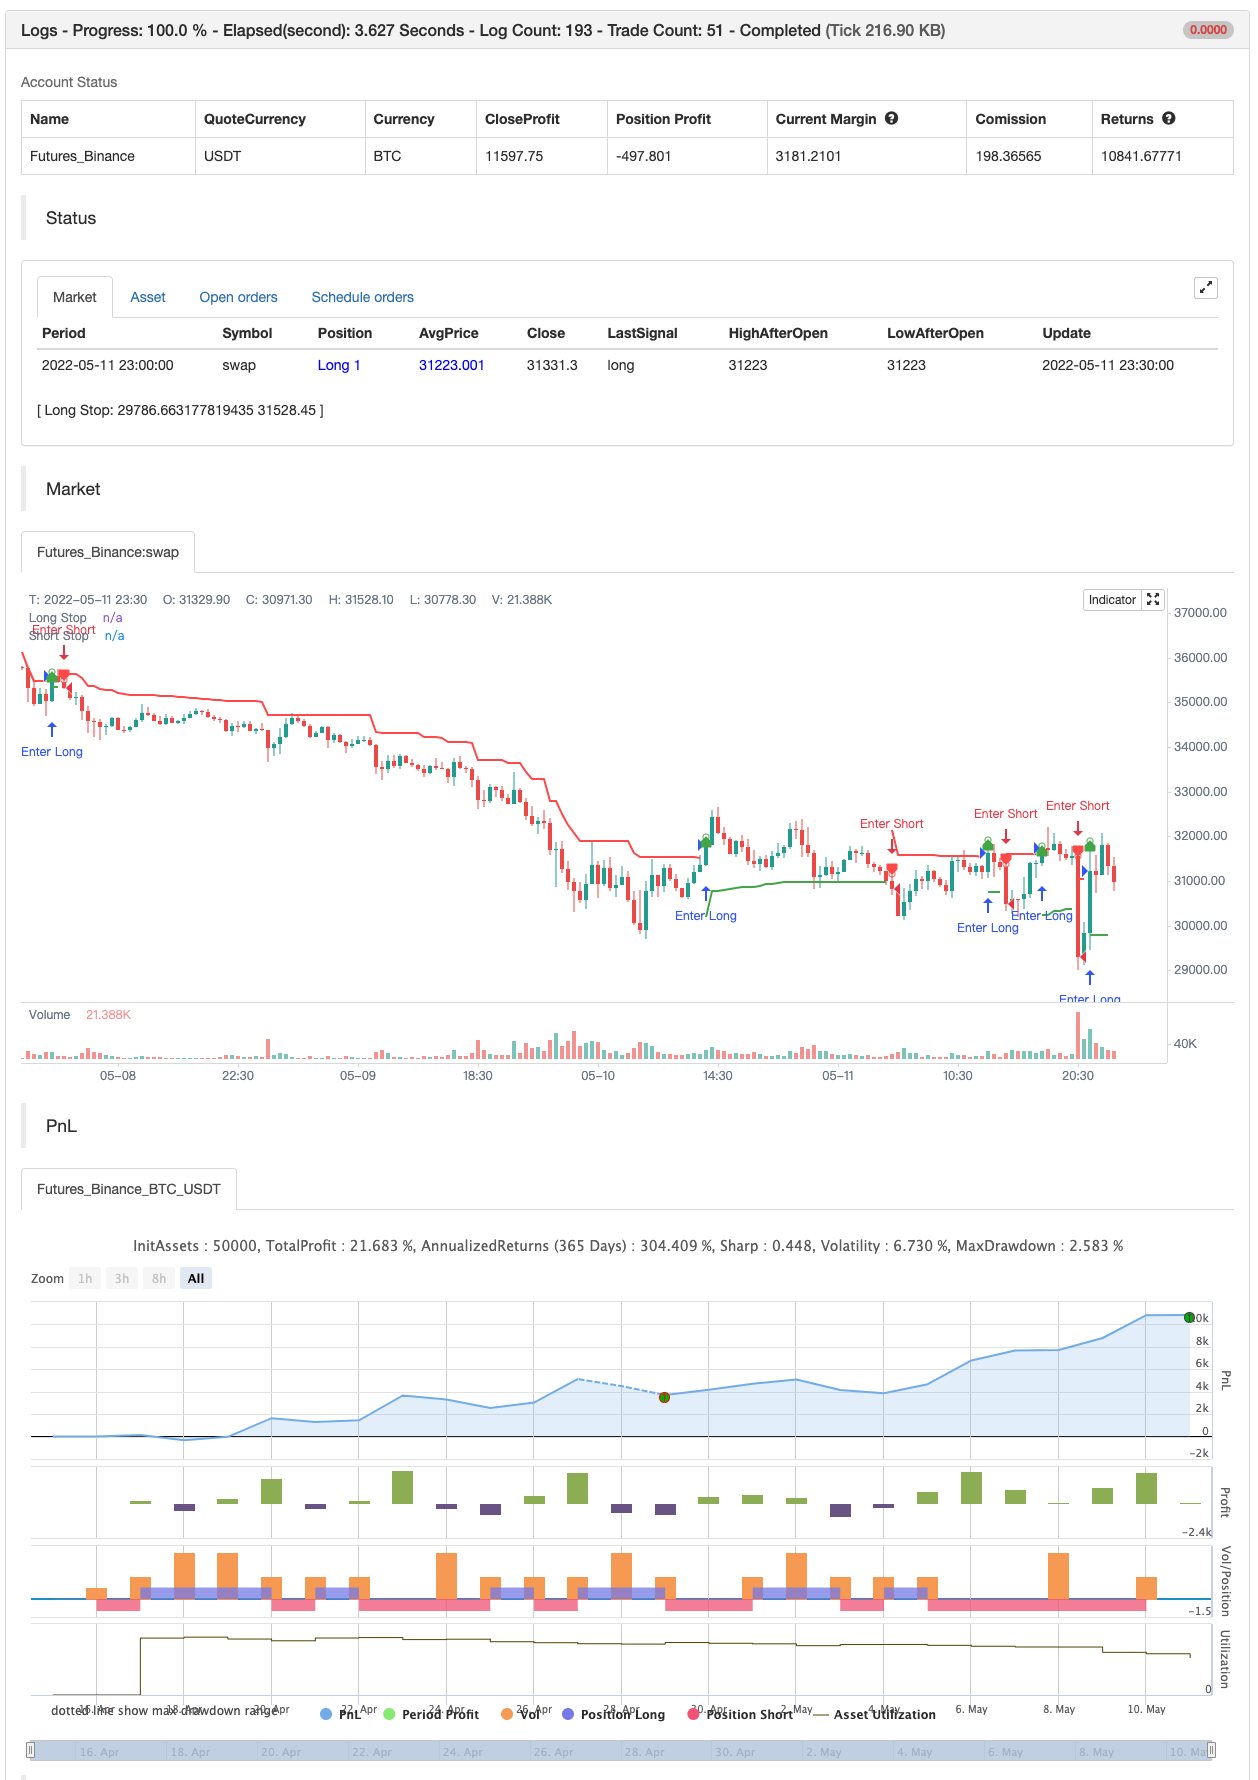
Cửa ra đèn chùm
Tác giả:ChaoZhang, Ngày: 2022-05-17 17:10:19Tags:ATR
Đây là một thiết kế lại của chỉ số Chandelier Exit. Nó loại bỏ các chuyển đổi ngu ngốc giữa các trạng thái Chandelier Exit
Chỉ số này ban đầu được phát triển bởi Charles Le Beau và được phổ biến bởi Tiến sĩ Alexander Elder trong cuốn sách của ông
Nói tóm lại, đây là một lệnh dừng lỗ dựa trên phạm vi trung bình thực sự (ATR).
backtest

/*backtest
start: 2022-04-16 00:00:00
end: 2022-05-11 23:59:00
period: 30m
basePeriod: 15m
exchanges: [{"eid":"Futures_Binance","currency":"BTC_USDT"}]
*/

//@version=4
// Copyright (c) 2019-present, Alex Orekhov (everget)
// Chandelier Exit script may be freely distributed under the terms of the GPL-3.0 license.
study("Chandelier Exit", shorttitle="CE", overlay=true)

length = input(title="ATR Period", type=input.integer, defval=22)
mult = input(title="ATR Multiplier", type=input.float, step=0.1, defval=3.0)
showLabels = input(title="Show Buy/Sell Labels ?", type=input.bool, defval=true)
useClose = input(title="Use Close Price for Extremums ?", type=input.bool, defval=true)
highlightState = input(title="Highlight State ?", type=input.bool, defval=true)

atr = mult * atr(length)

longStop = (useClose ? highest(close, length) : highest(length)) - atr
longStopPrev = nz(longStop[1], longStop)
longStop := close[1] > longStopPrev ? max(longStop, longStopPrev) : longStop

shortStop = (useClose ? lowest(close, length) : lowest(length)) + atr
shortStopPrev = nz(shortStop[1], shortStop)
shortStop := close[1] < shortStopPrev ? min(shortStop, shortStopPrev) : shortStop

var int dir = 1
dir := close > shortStopPrev ? 1 : close < longStopPrev ? -1 : dir

var color longColor = color.green
var color shortColor = color.red

longStopPlot = plot(dir == 1 ? longStop : na, title="Long Stop", style=plot.style_linebr, linewidth=2, color=longColor)
buySignal = dir == 1 and dir[1] == -1
plotshape(buySignal ? longStop : na, title="Long Stop Start", location=location.absolute, style=shape.circle, size=size.tiny, color=longColor, transp=0)
plotshape(buySignal and showLabels ? longStop : na, title="Buy Label", text="Buy", location=location.absolute, style=shape.labelup, size=size.tiny, color=longColor, textcolor=color.white, transp=0)

shortStopPlot = plot(dir == 1 ? na : shortStop, title="Short Stop", style=plot.style_linebr, linewidth=2, color=shortColor)
sellSignal = dir == -1 and dir[1] == 1
plotshape(sellSignal ? shortStop : na, title="Short Stop Start", location=location.absolute, style=shape.circle, size=size.tiny, color=shortColor, transp=0)
plotshape(sellSignal and showLabels ? shortStop : na, title="Sell Label", text="Sell", location=location.absolute, style=shape.labeldown, size=size.tiny, color=shortColor, textcolor=color.white, transp=0)

midPricePlot = plot(ohlc4, title="", style=plot.style_circles, linewidth=0, display=display.none, editable=false)

longFillColor = highlightState ? (dir == 1 ? longColor : na) : na
shortFillColor = highlightState ? (dir == -1 ? shortColor : na) : na
fill(midPricePlot, longStopPlot, title="Long State Filling", color=longFillColor)
fill(midPricePlot, shortStopPlot, title="Short State Filling", color=shortFillColor)

changeCond = dir != dir[1]
alertcondition(changeCond, title="Alert: CE Direction Change", message="Chandelier Exit has changed direction!")
alertcondition(buySignal, title="Alert: CE Buy", message="Chandelier Exit Buy!")
alertcondition(sellSignal, title="Alert: CE Sell", message="Chandelier Exit Sell!")


if buySignal
    strategy.entry("Enter Long", strategy.long)
else if sellSignal
    strategy.entry("Enter Short", strategy.short)
Nội dung liên quan
- Hệ thống chiến lược định lượng xu hướng động lượng hai chỉ số
- Xác định xu hướng đa chiều và chiến lược dừng lỗ động của ATR
- Xu hướng đa chỉ số cao xác nhận chiến lược giao dịch
- Chiến lược dừng lỗ theo dõi thông minh dựa trên đường trung bình chuyển động và mô hình ngày
- Hệ thống giao dịch định lượng với sự hồi quy đa nhân và chiến lược dây đai giá động
- Chiến lược giao dịch định lượng theo dõi và xác nhận nhiều xu hướng chéo động đa trượt trung tuyến
- Chiến lược theo dõi stop-loss động tiên tiến dựa trên đường viền cấp độ lớn và RSI
- Xu hướng đồng bộ đa chỉ số đảo ngược chiến lược giao dịch định lượng
- Động thái hỗ trợ nhiều kênh chống lại chiến lược kênh của Kenny
- Máy học tự điều chỉnh các chiến lược giao dịch định lượng siêu xu hướng
- Chiến lược giao dịch theo dõi xu hướng trung tuyến dựa trên mức dừng biến động
Nhiều hơn nữa
- Scalping PullBack Tool R1
- Chiến lược mua&bán phụ thuộc vào AO+Stoch+RSI+ATR
- EMA TREND CLOUD
- Tỷ lệ năng lượng hướng tăng tốc theo khối lượng RedK
- Donchian Breakout không sơn lại
- RedK Momentum Bars
- SuperJump quay lại Bollinger Band
- Xu hướng Fukuiz
- Bốt của Johnny.
- SSL lai
- RISOTTO
- Chiến lược trong ngày của EMA
- Điểm trung tâm siêu xu hướng
- Supertrend+4 chuyển động
- ZigZag dựa trên động lượng
- VuManChu Cipher B + Divergences chiến lược
- Khái niệm Dual SuperTrend
- Super Scalper
- Kiểm tra ngược - Chỉ số
- Trendycious