EMA TREND CLOUD
Tác giả:ChaoZhang, Ngày: 2022-05-18 15:32:51Tags:EMA
***Đây không phải là lời khuyên thương mại - Không có đảm bảo - Sử dụng theo rủi ro của riêng bạn***
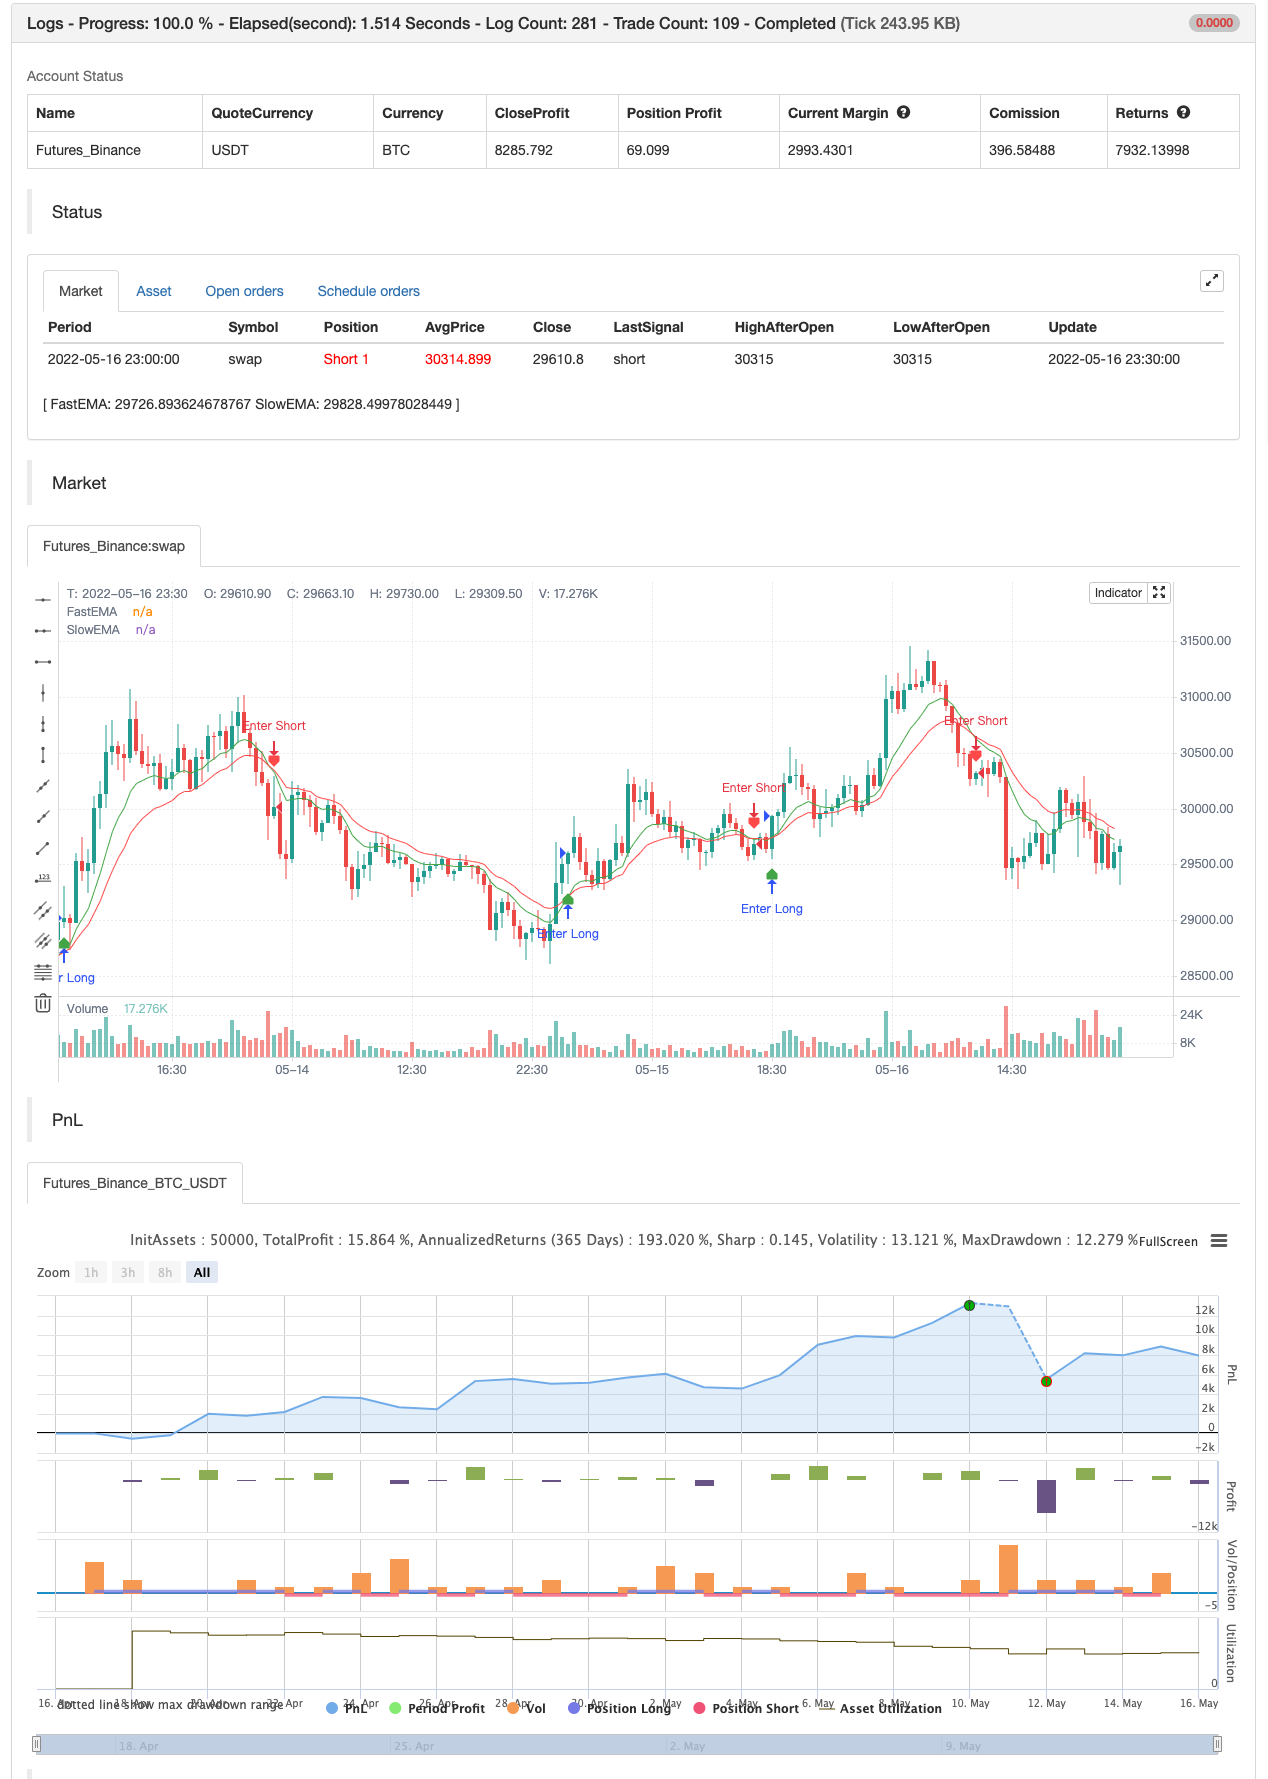
Chụp các đường trung bình chuyển động hàm số 9 và 20 giai đoạn (EMA) và vẽ một đám mây giữa, trực quan xác định xu hướng trong ngày và sức mạnh của nó. Mây xanh cho dài, mây đỏ cho ngắn. Mây dày hơn xu hướng càng mạnh. Đăng nhập chơi dài là khi EMA 9 vượt qua trên EMA 20 khiến đám mây chuyển sang màu xanh lá cây, đối diện cho ngắn.
Nhập tích cực là khi thanh thứ hai sau khi chéo đóng trên 9 EMA và ở hướng chơi.
Sự ra đi có thể xảy ra khi giá đóng cửa trong đám mây hoặc ở phía đối diện của đám mây hoặc khi các đường trung bình vượt qua theo hướng ngược lại của giao dịch tùy thuộc vào khả năng chấp nhận rủi ro của cá nhân.
***Đây không phải là lời khuyên thương mại - Không có đảm bảo - Sử dụng theo rủi ro của riêng bạn***
backtest

/*backtest
start: 2022-04-17 00:00:00
end: 2022-05-16 23:59:00
period: 30m
basePeriod: 15m
exchanges: [{"eid":"Futures_Binance","currency":"BTC_USDT"}]
args: [["v_input_1",10],["v_input_2",18]]
*/

// This source code is subject to the terms of the Mozilla Public License 2.0 at https://mozilla.org/MPL/2.0/
// © Ron Westbrook (discord: disturbinglymellow#4075)
// Date: 5/17/2021
// Description: Plots two exponential moving averages and places a colored cloud between to indicate trend direction. Default values of 9 and 20 periods have worked well for me, but inputs are available if you choose to change them. If you like my work and want to support more of it please consider leaving me a tip here. https://tinyurl.com/tipron


//@version=5
indicator(title='EMA TREND CLOUD', overlay=true)

fastLen = input(title='Fast EMA Length', defval=9)
slowLen = input(title='Slow EMA Length', defval=20)
useTextLabels = input.bool(true, title='Use Text-Based Crossover Labels?', group='Crossover Moving Averages')

fastEMA = ta.ema(close, fastLen)
slowEMA = ta.ema(close, slowLen)

fema = plot(fastEMA, title='FastEMA', color=color.new(color.green, 0), linewidth=1, style=plot.style_line)
sema = plot(slowEMA, title='SlowEMA', color=color.new(color.red, 0), linewidth=1, style=plot.style_line)

fill(fema, sema, color=fastEMA > slowEMA ? color.new(#417505, 50) : color.new(#890101, 50), title='Cloud')

// Bull and Bear Alerts
Bull = ta.crossover(fastEMA, slowEMA)
Bear = ta.crossunder(fastEMA, slowEMA)

plotshape(Bull, title='Calls Label', color=color.new(color.green, 25), textcolor=useTextLabels ? color.white : color.new(color.white, 100), style=useTextLabels ? shape.labelup : shape.triangleup, text='Calls', location=location.belowbar)

plotshape(Bear, title='Puts Label', color=color.new(color.red, 25), textcolor=useTextLabels ? color.white : color.new(color.white, 100), style=useTextLabels ? shape.labeldown : shape.triangledown, text='Puts', location=location.abovebar)


if Bull
    alert('Calls Alert: 9ema crossed over 20ema', alert.freq_once_per_bar_close)
if Bear
    alert('Puts Alert: 9ema crossed under 20ema', alert.freq_once_per_bar_close)


if Bull
    strategy.entry("Enter Long", strategy.long)
else if Bear
    strategy.entry("Enter Short", strategy.short)
- Xác định xu hướng đa chiều và chiến lược dừng lỗ động của ATR
- Xu hướng đa chỉ số cao xác nhận chiến lược giao dịch
- Chiến lược theo dõi xu hướng thích nghi và xác nhận nhiều giao dịch
- Chiến lược tối ưu hóa giao dịch trong ngày với hệ thống đường thẳng động kết hợp với chỉ số động lực RSI
- Chiến lược theo dõi xu hướng động lực qua nhiều chỉ số công nghệ
- Xu hướng EMA kết hợp với việc quay lại vị trí đột phá chiến lược giao dịch
- Chiến lược giao dịch định lượng các thông số động của RSI hỗ trợ giao dịch đa đường
- Xu hướng động quyết định chiến lược giao thoa chỉ số RSI
- Chiến lược theo dõi xu hướng chéo kép: đường thẳng chỉ số và hệ thống giao dịch đồng bộ MACD
- Nhiều chỉ số, xu hướng đa chiều, chiến lược định lượng cao
- Chiến lược giao dịch định lượng theo dõi và xác nhận nhiều xu hướng chéo động đa trượt trung tuyến
- ATR được làm mịn
- Order Block Finder
- TrendScalp-FractalBox-3EMA
- Các tín hiệu QQE
- Lưu ý:
- CM MACD Chỉ số tùy chỉnh - Khung thời gian đa - V2
- HODL LINE
- 2 Phát hiện hướng màu trung bình chuyển động
- Scalping PullBack Tool R1
- Chiến lược mua&bán phụ thuộc vào AO+Stoch+RSI+ATR
- Tỷ lệ năng lượng hướng tăng tốc theo khối lượng RedK
- Donchian Breakout không sơn lại
- RedK Momentum Bars
- SuperJump quay lại Bollinger Band
- Xu hướng Fukuiz
- Bốt của Johnny.
- SSL lai
- Cửa ra đèn chùm
- RISOTTO
- Chiến lược trong ngày của EMA
bwxiaokTôi không hiểu tiếng Anh.