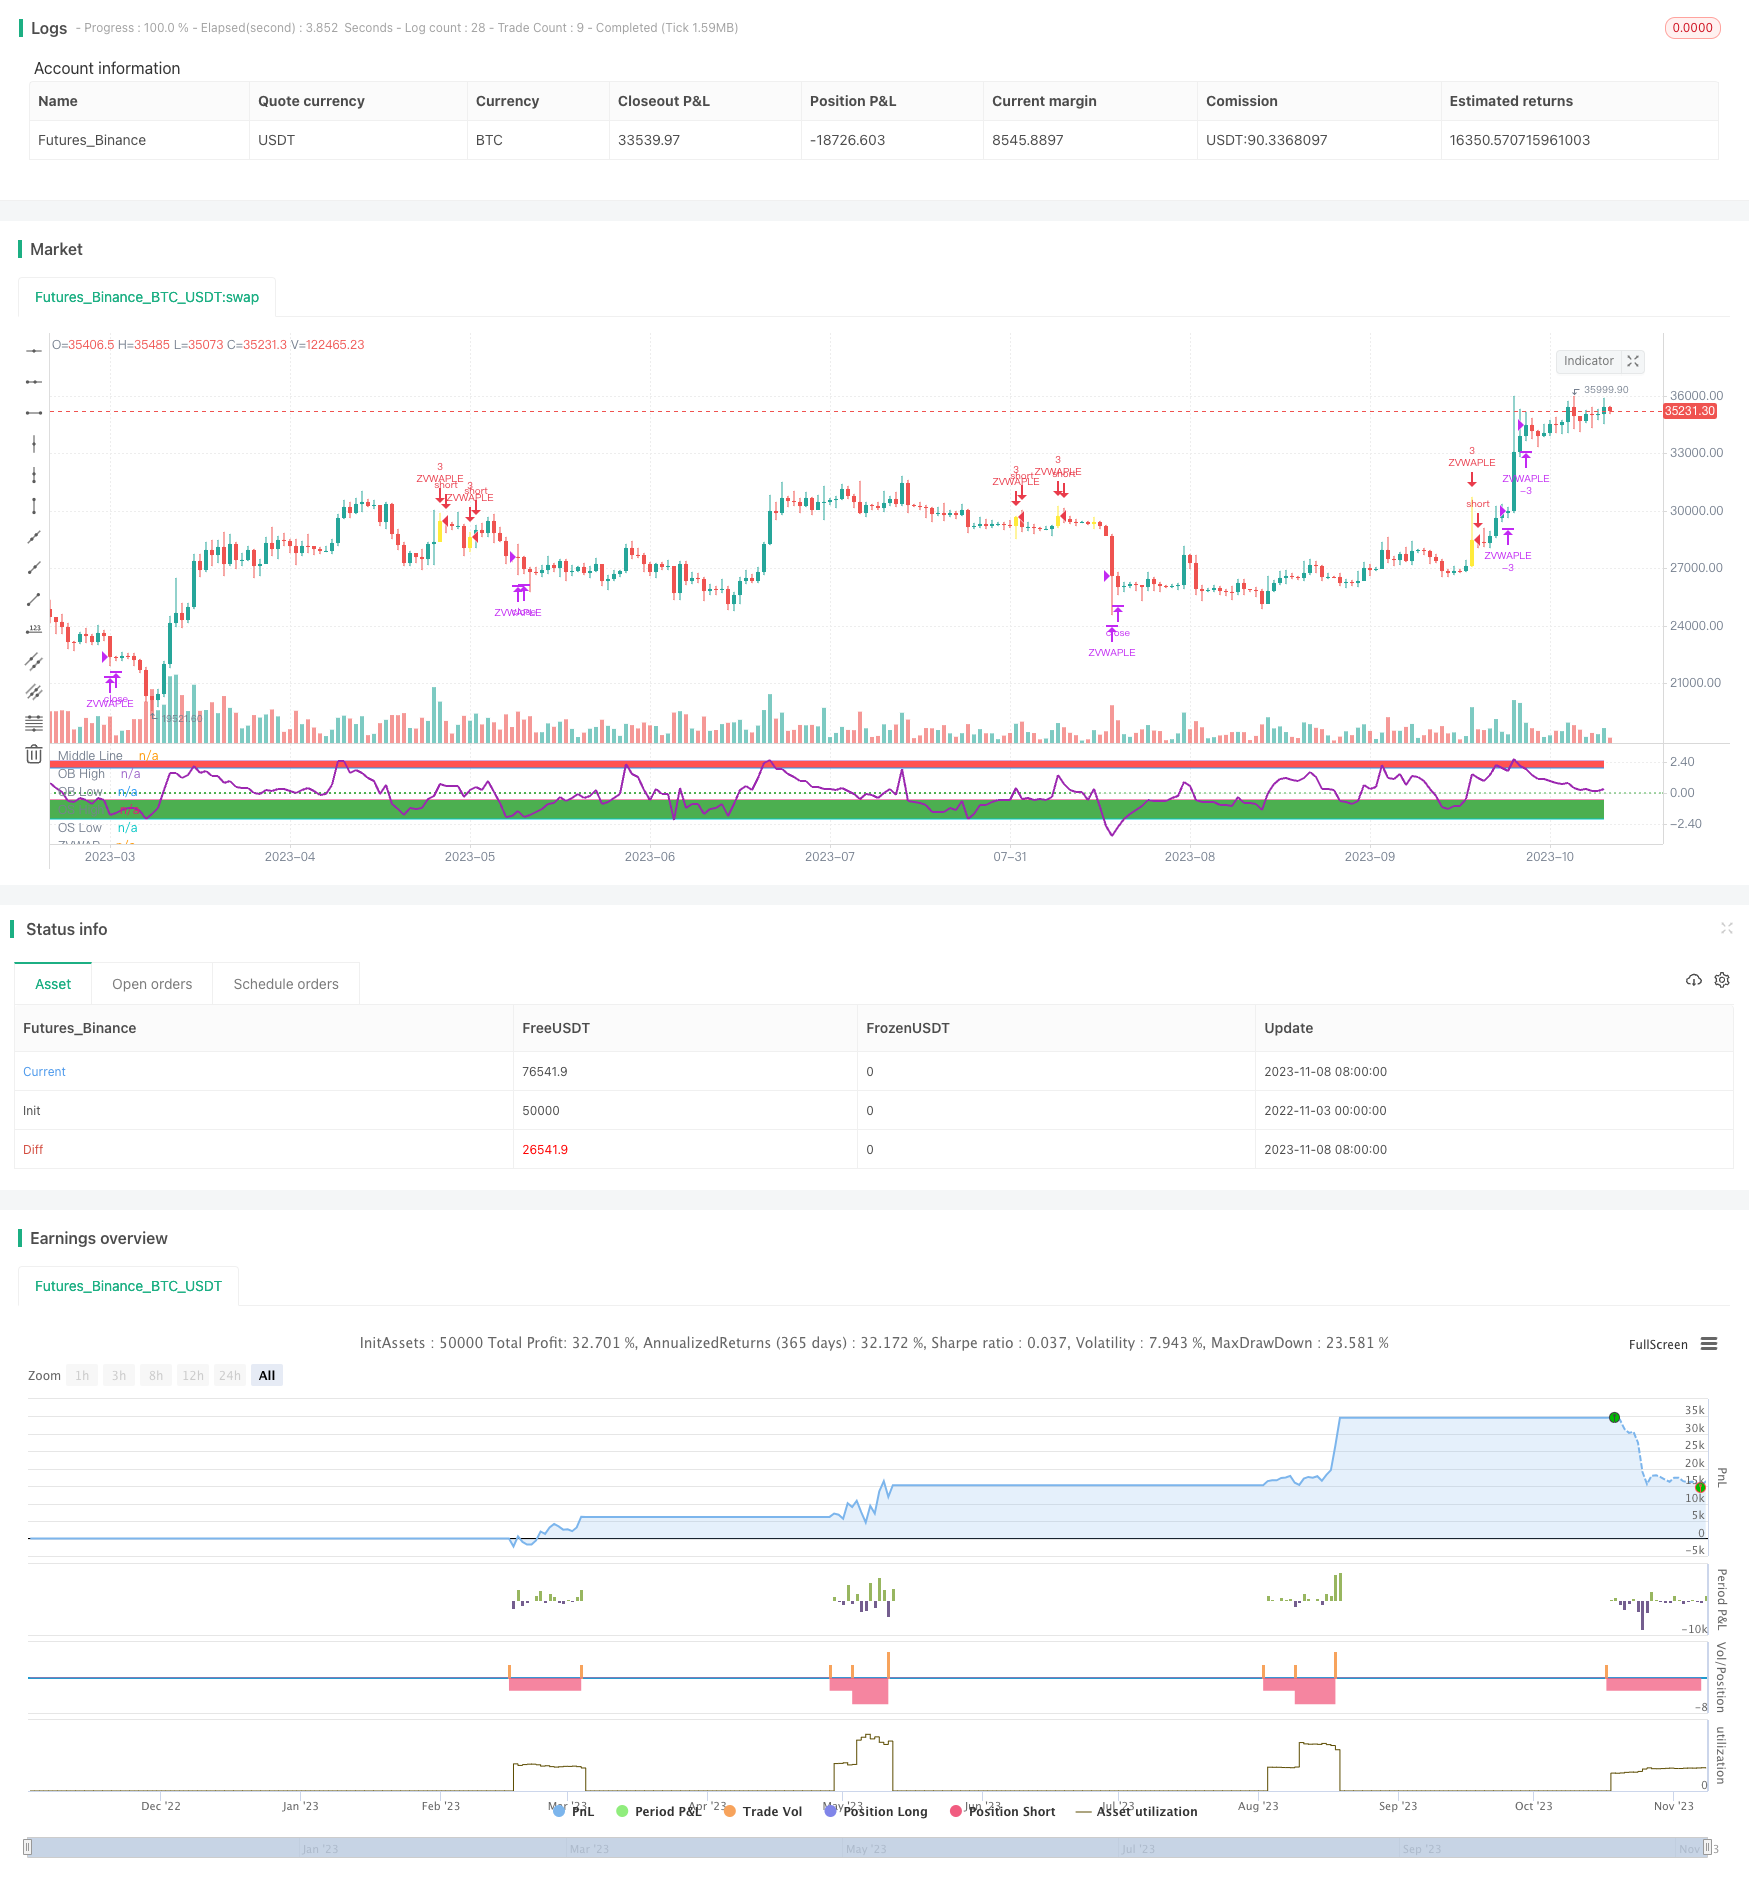
Chiến lược VWAP dựa trên khoảng cách Z
Ngày tạo:
2023-11-10 12:02:19
sửa đổi lần cuối:
2023-11-10 12:02:19
sao chép:
0
Số nhấp chuột:
831
1
tập trung vào
1628
Người theo dõi

Tổng quan
Chiến lược này dựa trên chỉ số VWAP khoảng cách Z của LazyBear, tính toán giá với khoảng cách Z của VWAP để xác định xem có quá mua hay quá bán hay không, và đưa ra lệnh mua vào. Chiến lược này kết hợp với EMA trung bình và phán đoán về Z-quãng trở lại 0-trục, có thể lọc một số tín hiệu tiếng ồn.
Nguyên tắc chiến lược
- Tính giá trị VWAP
- Tính giá và khoảng cách Z của VWAP
- Thiết lập đường mua quá mức ((2.5) và đường bán quá mức ((-0.5))
- Khi đường nhanh lớn hơn đường chậm, khoảng cách Z thấp hơn đường bán quá, và Z xa hơn khi đi qua 0
- Khi Z vượt quá đường mua
- Thêm logic dừng lỗ
Hàm chính:
- calc_zvwap: tính giá và khoảng cách Z của VWAP
- Giá trị VWAP:vwap(hlc3)
- Đường dây nhanh: ema ((close,fastEma)
- (closed,slowEma)
Phân tích lợi thế
- Sử dụng khoảng cách Z để đánh giá trực quan hơn
- Kết hợp với bộ lọc EMA để tránh bị mắc kẹt
- Cho phép gia tăng giá để lợi nhuận từ xu hướng
- Có logic dừng lỗ để kiểm soát rủi ro
Phân tích rủi ro
- Cần đảm bảo rằng các tham số được thiết lập hợp lý, chẳng hạn như vị trí bán hàng quá mức, chu kỳ EMA, v.v.
- Z bị tụt hậu, có thể bỏ lỡ điểm mua bán quan trọng
- Cho phép gia tăng cổ phiếu sẽ làm tăng rủi ro mất mát
- Vị trí dừng lỗ cần thiết lập hợp lý
Giải pháp:
- Cài đặt tham số tối ưu hóa bằng cách đo ngược
- Kết hợp các chỉ số bổ sung để lọc tín hiệu
- Đặt các điều kiện đặt cược hợp lý
- Động thái điều chỉnh vị trí dừng lỗ
Hướng tối ưu hóa
- Tối ưu hóa tham số chu kỳ EMA
- Kiểm tra các tiêu chuẩn khác nhau để đánh giá quá mua quá bán
- Thêm các chỉ số khác để lọc tín hiệu tiếng ồn
- Kiểm tra các phương pháp dừng khác nhau
- Tối ưu hóa logic đầu vào, đặt cược và dừng lỗ
Tóm tắt
Chiến lược này sử dụng mối quan hệ giữa giá và VWAP trong khoảng cách Z, kết hợp với tín hiệu nhiễu lọc EMA để nắm bắt cơ hội xu hướng. Chiến lược cho phép theo dõi xu hướng trong khi thiết lập rủi ro kiểm soát lỗ.
Mã nguồn chiến lược
/*backtest
start: 2022-11-03 00:00:00
end: 2023-11-09 00:00:00
period: 1d
basePeriod: 1h
exchanges: [{"eid":"Futures_Binance","currency":"BTC_USDT"}]
*/

// This source code is subject to the terms of the Mozilla Public License 2.0 at https://mozilla.org/MPL/2.0/
// © mohanee

//@version=4
//This is based on Z distance from VWAP by Lazybear
strategy(title="ZVWAP[LB] strategy", overlay=false,pyramiding=2, default_qty_type=strategy.fixed, default_qty_value=3,    initial_capital=10000, currency=currency.USD)
length=input(13,"length")

calc_zvwap(pds, source1) =>
	mean = sum(volume*source1,pds)/sum(volume,pds)
	vwapsd = sqrt(sma(pow(source1-mean, 2), pds) )
	(close-mean)/vwapsd


upperTop=2.5  //input(2.5)
upperBottom=2.0  //input(2.0)
lowerTop=-0.5  //input(-0.5)
lowerBottom=-2.0 //input(-2.0)

buyLine=input(-0.5, title="OverSold Line",minval=-2, maxval=3)
sellLine=input(2.0, title="OverBought Line",minval=-2, maxval=3)

fastEma=input(13, title="Fast EMA",minval=1, maxval=50)
slowEma=input(55, title="Slow EMA",minval=10, maxval=200)

stopLoss =input(5, title="Stop Loss",minval=1)

hline(0, title="Middle Line", linestyle=hline.style_dotted, color=color.green)

ul1=plot(upperTop, "OB High")
ul2=plot(upperBottom, "OB Low")
fill(ul1,ul2, color=color.red)
ll1=plot(lowerTop, "OS High")
ll2=plot(lowerBottom, "OS Low")
fill(ll1,ll2, color=color.green)
zvwapVal=calc_zvwap(length,close)
plot(zvwapVal,title="ZVWAP",color=color.purple, linewidth=2)


longEmaVal=ema(close,slowEma)
shortEmaVal=ema(close,fastEma)

vwapVal=vwap(hlc3)


zvwapDipped=false

for i = 1 to 10
    zvwapDipped := zvwapDipped or zvwapVal[i]<=buyLine

longCondition=  shortEmaVal > longEmaVal  and zvwapDipped and  crossover(zvwapVal,0)

barcolor(longCondition ? color.yellow: na)

strategy.entry(id="ZVWAPLE", long=true,  when= longCondition  and strategy.position_size<1)


//Add
strategy.entry(id="ZVWAPLE", comment="Add", long=true,  when= strategy.position_size>1 and close<strategy.position_avg_price and crossover(zvwapVal,0))


//calculate stop Loss
stopLossVal =  strategy.position_avg_price -  (strategy.position_avg_price*stopLoss*0.01)

strategy.close(id="ZVWAPLE",comment="SL Exit",    when=close<stopLossVal)   //close all on stop loss

strategy.close(id="ZVWAPLE",comment="TPExitAll",    qty=strategy.position_size ,   when= crossunder(zvwapVal,sellLine))   //close all      zvwapVal>sellLine