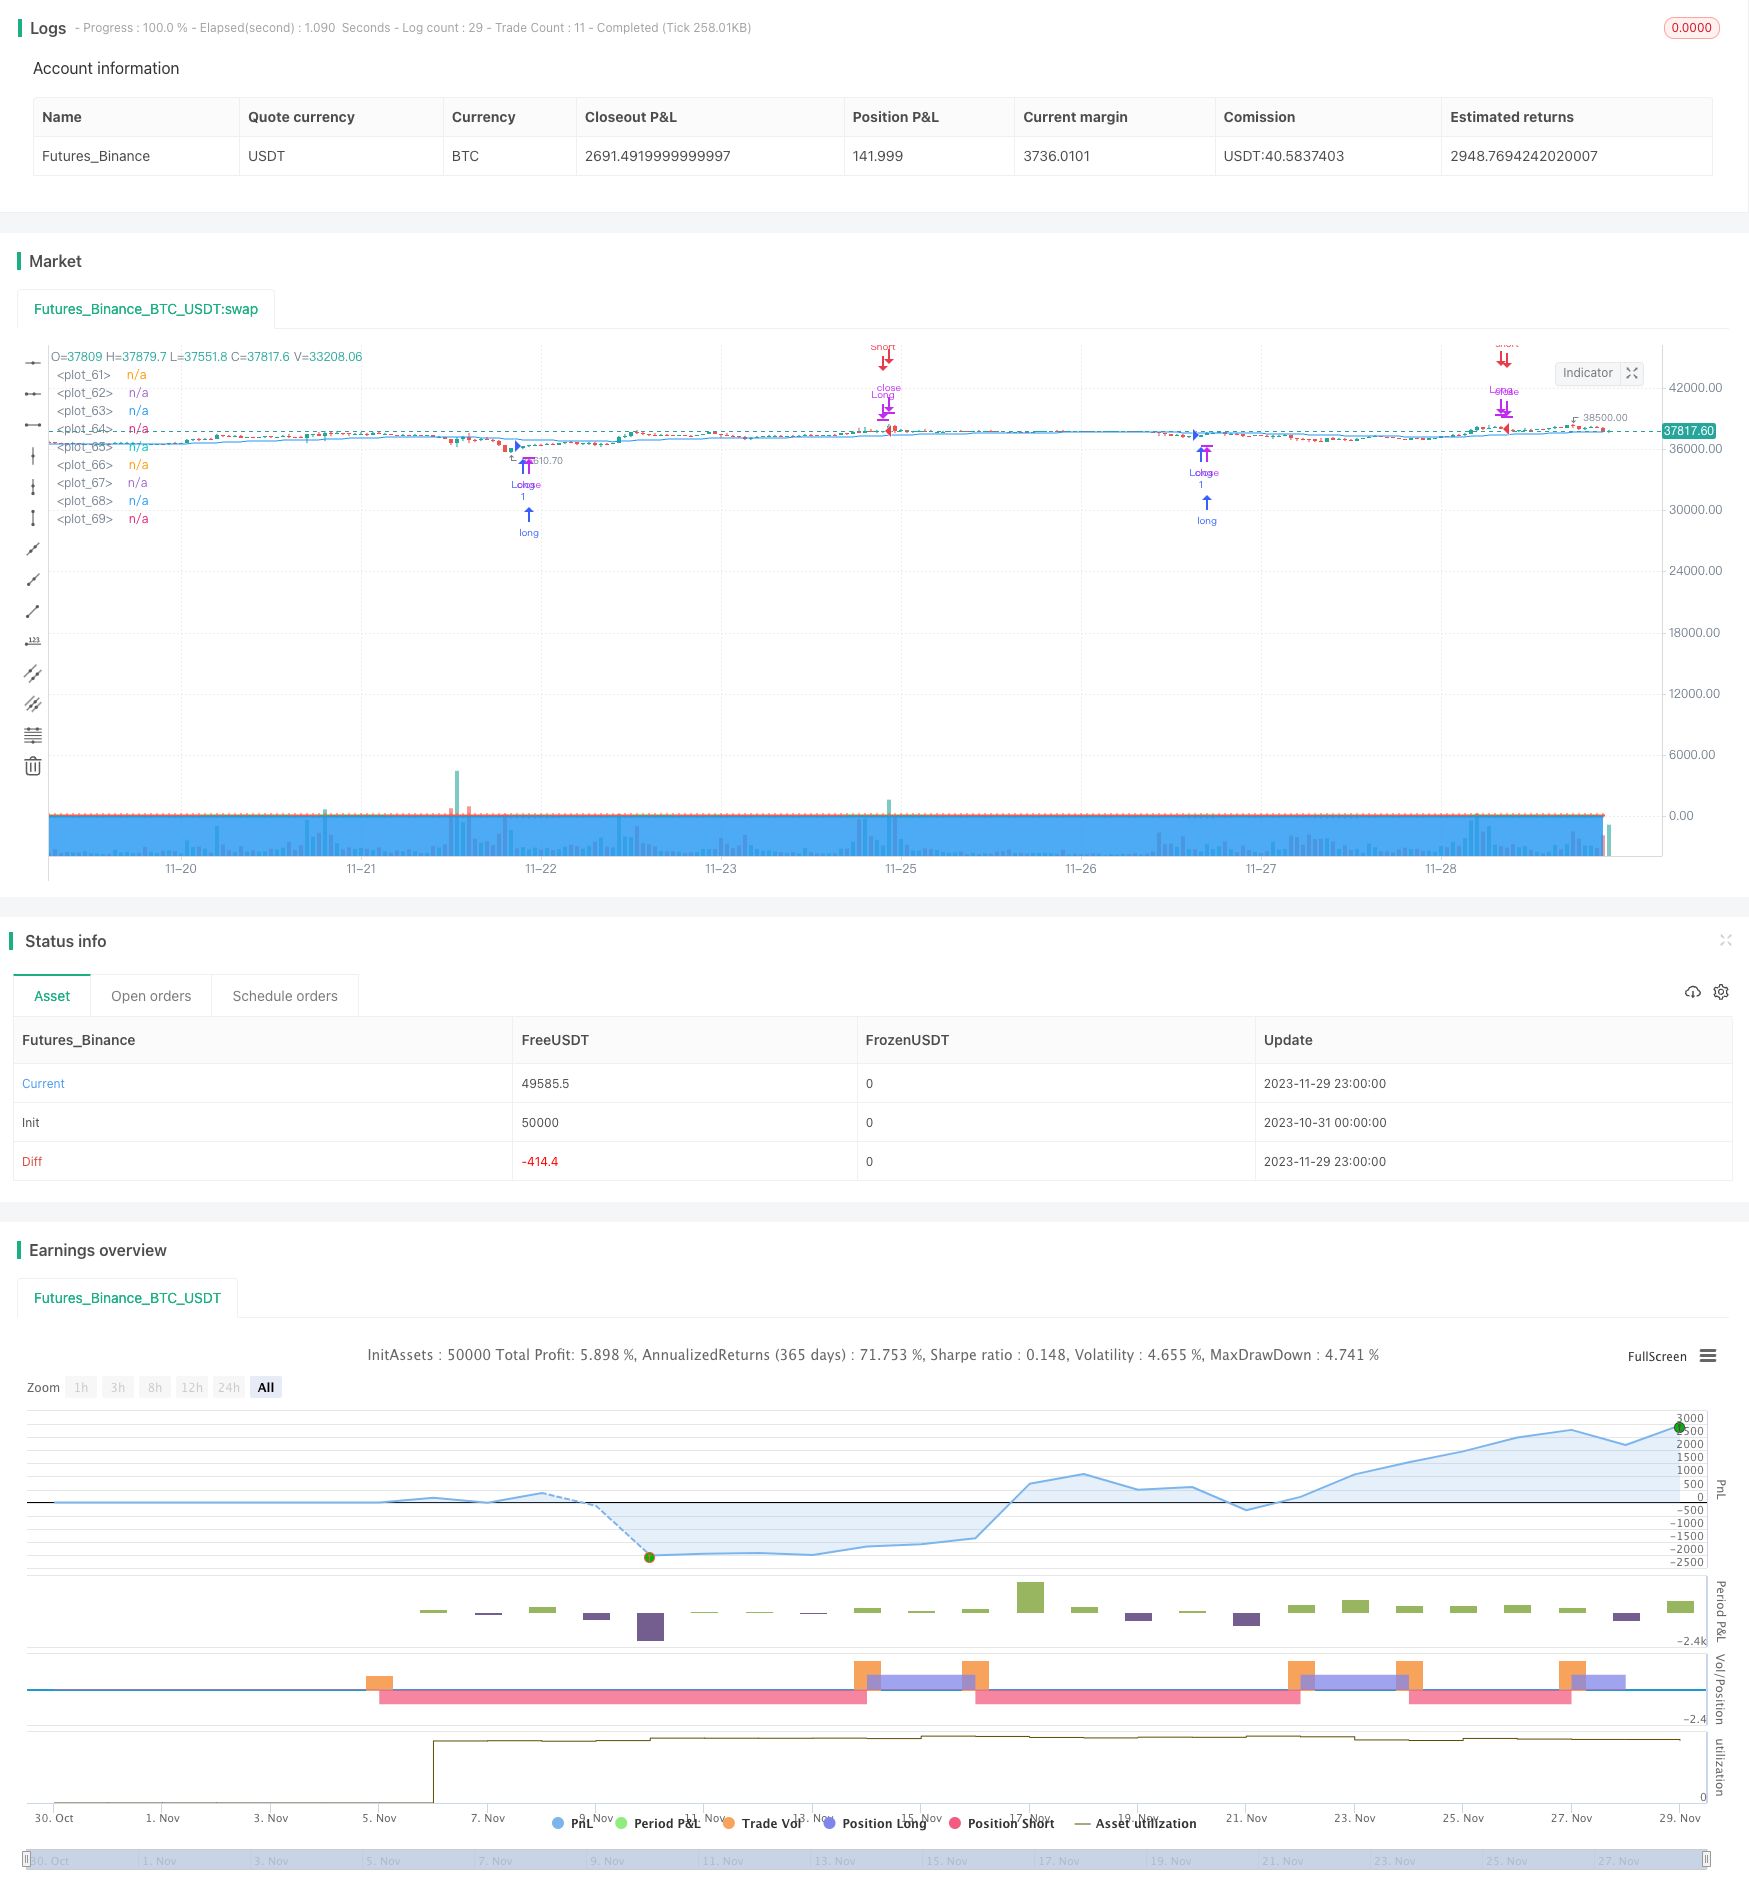
Multi Take Profit và Stop Loss WaveTrend Xu hướng theo chiến lược
Tác giả:ChaoZhang, Ngày: 2023-12-01 18:09:12Tags:

Tổng quan
Chiến lược này dựa trên chiến lược WaveTrend ban đầu từ LazyBear, với các tính năng bổ sung như dừng lỗ thứ cấp, nhiều mức lấy lợi nhuận và bộ lọc EMA khung thời gian cao.
Chiến lược logic
Chỉ số cốt lõi của chiến lược này là WaveTrend, bao gồm ba thành phần:
-
AP: Giá trung bình = (Tăng nhất + Tối thấp nhất + Khép lại) / 3
-
SEC: EMA của AP trong n giai đoạn
-
CI: (AP - ESA) / (0.015 * N1-period EMA of absolute value of (AP - ESA))
-
TCI: EMA n-period của CI, còn được gọi là WaveTrend Line 1 (WT1)
-
WT2: SMA 4 giai đoạn của WT1
Một vị trí dài được mở khi WT1 vượt qua trên WT2 (cầu vàng), và được đóng khi WT1 vượt qua dưới WT2 (cầu chết).
Ngoài ra, một bộ lọc EMA khung thời gian cao được thực hiện để tránh tín hiệu sai, do đó, giao dịch dài chỉ được thực hiện khi giá trên EMA và giao dịch ngắn dưới EMA.
Ưu điểm
-
Tự động theo dõi xu hướng bằng cách sử dụng WaveTrend mà không cần đánh giá bằng tay
-
Lợi nhuận dừng giao dịch thứ cấp có hiệu quả hạn chế lỗ giao dịch đơn
-
Nhiều mức lợi nhuận lấy tối đa hóa thu lợi nhuận
-
Bộ lọc EMA cải thiện tỷ lệ thắng bằng cách tránh tín hiệu sai
Rủi ro và cải tiến
-
Không phát hiện sự đảo ngược xu hướng, có thể gây ra tổn thất
-
Điều chỉnh tham số kém dẫn đến giao dịch quá mức
-
Các bộ tham số khác nhau có thể được thử nghiệm để tối ưu hóa
-
Xem xét các chỉ số bổ sung để phát hiện đảo ngược
Kết luận
Chiến lược này kết hợp toàn diện theo dõi xu hướng, kiểm soát rủi ro và tối đa hóa lợi nhuận thông qua phát hiện xu hướng tự động của WaveTrend, bộ lọc EMA để cải thiện hiệu quả và quản lý dừng lỗ / lấy lợi nhuận để cân bằng giao dịch xu hướng và kiểm soát rủi ro. Đây là một hệ thống theo dõi xu hướng hiệu quả và ổn định.
/*backtest
start: 2023-10-31 00:00:00
end: 2023-11-30 00:00:00
period: 1h
basePeriod: 15m
exchanges: [{"eid":"Futures_Binance","currency":"BTC_USDT"}]
*/

// This source code is subject to the terms of the Mozilla Public License 2.0 at https://mozilla.org/MPL/2.0/
// © undacovacobra

//@version=4
strategy("WaveTrend Strategy [LazyBear] with Secondary Stop Loss", overlay=true)

// Input parameters
n1 = input(10, "Channel Length")
n2 = input(21, "Average Length")
obLevel1 = input(60, "Over Bought Level 1")
obLevel2 = input(53, "Over Bought Level 2")
osLevel1 = input(-60, "Over Sold Level 1")
osLevel2 = input(-53, "Over Sold Level 2")
useEmaFilter = input(false, "Use EMA Filter")
emaLength = input(50, "EMA Length")
emaTimeFrame = input("60", "EMA Time Frame")
tradeMode = input("Both", "Trade Mode", options=["Long Only", "Short Only", "Both"])
useSecondarySL = input(false, "Use Secondary Stop Loss")
slPercentage = input(5.0, "Stop Loss Percentage (%)")

// WaveTrend Indicator Calculations
ap = hlc3
esa = ema(ap, n1)
d = ema(abs(ap - esa), n1)
ci = (ap - esa) / (0.015 * d)
tci = ema(ci, n2)
wt1 = tci
wt2 = sma(wt1, 4)

// EMA Calculation with Selected Time Frame
getEma(timeFrame) =>
    security(syminfo.tickerid, timeFrame, ema(close, emaLength))

emaFilter = getEma(emaTimeFrame)

// Secondary Stop Loss Calculation
longStopPrice = strategy.position_avg_price * (1 - slPercentage / 100)
shortStopPrice = strategy.position_avg_price * (1 + slPercentage / 100)

// Long Entry and Exit Conditions with EMA Filter and Trade Mode
longEntry = crossover(wt1, wt2) and wt2 < osLevel1 and (not useEmaFilter or close > emaFilter) and (tradeMode == "Long Only" or tradeMode == "Both")
if (longEntry)
    strategy.entry("Long", strategy.long)
longExit = crossunder(wt1, wt2) and wt2 > obLevel1
if (longExit)
    strategy.close("Long")
if (useSecondarySL and strategy.position_size > 0 and low < longStopPrice)
    strategy.close("Long", comment="SL Hit")

// Short Entry and Exit Conditions with EMA Filter and Trade Mode
shortEntry = crossunder(wt1, wt2) and wt2 > obLevel1 and (not useEmaFilter or close < emaFilter) and (tradeMode == "Short Only" or tradeMode == "Both")
if (shortEntry)
    strategy.entry("Short", strategy.short)
shortExit = crossover(wt1, wt2) and wt2 < osLevel1
if (shortExit)
    strategy.close("Short")
if (useSecondarySL and strategy.position_size < 0 and high > shortStopPrice)
    strategy.close("Short", comment="SL Hit")

// Plotting
plot(0, color=color.gray)
plot(obLevel1, color=color.red)
plot(osLevel1, color=color.green)
plot(obLevel2, color=color.red, style=plot.style_cross)
plot(osLevel2, color=color.green, style=plot.style_cross)
plot(wt1, color=color.green)
plot(wt2, color=color.red, style=plot.style_cross)
plot(wt1-wt2, color=color.blue, style=plot.style_area, transp=80)
plot(emaFilter, color=color.blue)
- Bitcoin - MA Crossover chiến lược
- Chiến lược Fisher Transform Backtest
- 123 Chiến lược hợp tác đảo ngược và STARC Bands
- Chiến lược dừng lỗ dựa trên TFO và ATR
- Chiến lược số lượng đa yếu tố của Great Delight
- Tiếp tục chiến lược đường dây
- Chiến lược giao dịch trung bình di chuyển nhân tố bốn lần
- Chiến lược giao dịch chéo động trung bình theo cấp số
- Chiến lược chéo giữa hai mức trung bình động
- Chiến lược giao dịch trung bình động kép
- Chiến lược giao dịch hai hướng dựa trên chỉ số RSI và chỉ số RSI STOCH
- Chiến lược đột phá EMA Golden Cross nhanh và chậm
- RSI và kết hợp trung bình động MT5 Chiến lược scalping Martingale
- Chiến lược theo dõi ngừng biến động
- Chiến lược đột phá định vị dao động với nhiều chỉ số
- RSI Mean Reversation Chiến lược giao dịch định lượng dựa trên RSI Crossover
- Chiến lược đảo ngược đường chéo trung bình động kép
- Chiến lược chéo ngược đường trung bình di chuyển
- Hull MA Channel và chiến lược giao dịch chuyển động hồi quy tuyến tính
- Chiến lược giao dịch định lượng Triple SuperTrend