Tác giả:ChaoZhang
Tags:
Tags:

Tổng quan
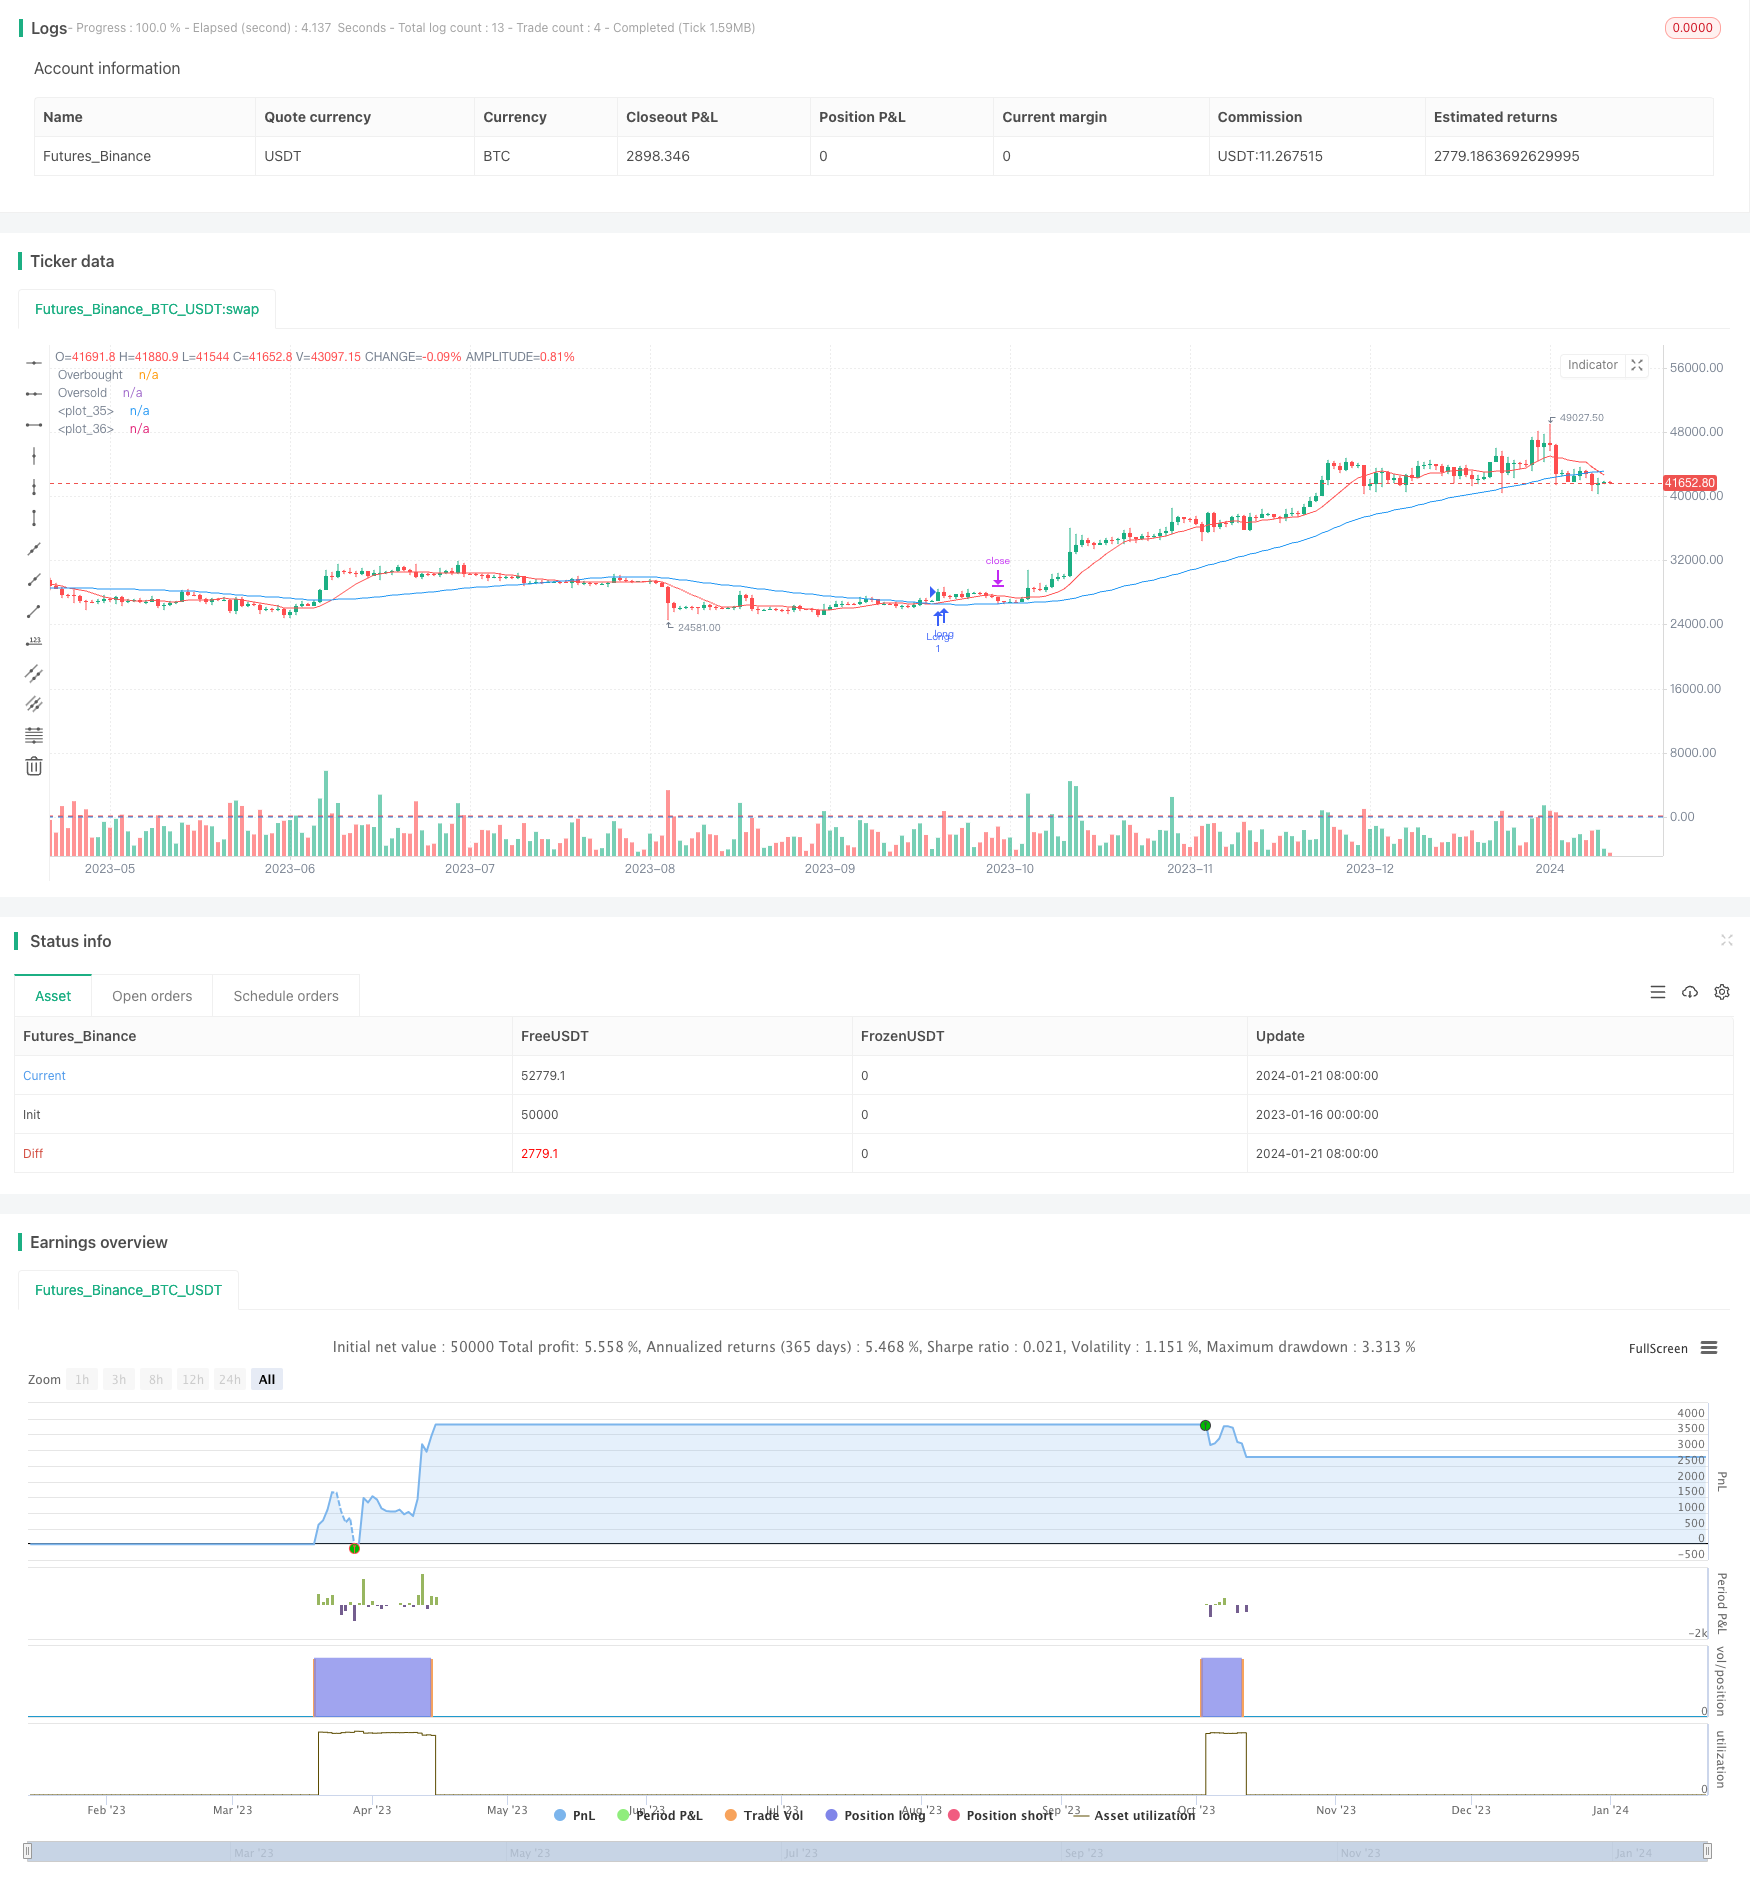
Đây là một chiến lược đa yếu tố dài hạn kết hợp các chỉ số trung bình động, RSI và ATR để xác định các điều kiện thị trường bị đánh giá thấp và tạo ra tín hiệu mua.
Chiến lược logic
Khi đường trung bình di chuyển nhanh vượt qua đường trung bình di chuyển chậm, tạo thành tín hiệu chéo vàng, trong khi chỉ số RSI nằm dưới khu vực mua quá mức, thị trường được coi là bị định giá thấp và một tín hiệu mua được tạo ra.
Phân tích lợi thế
- Phán quyết đa yếu tố tránh sự phá vỡ sai và đảm bảo độ tin cậy của tín hiệu mua
- Theo dõi xu hướng dài hạn mà không bị cản trở bởi biến động ngắn hạn
- Các điểm dừng lỗ / lấy lợi nhuận cố định ngăn ngừa tổn thất quá mức
- Các tham số chỉ số có thể điều chỉnh cho phép tối ưu hóa trên các sản phẩm khác nhau
- Dễ thực hiện, dễ hiểu và vận hành
Phân tích rủi ro
Là một chiến lược nắm giữ dài hạn, chiến lược cũng có một số rủi ro cần lưu ý.
- Rủi ro mất mát lớn từ nắm giữ dài hạn. Có thể thấy mất mát đáng kể trong thị trường hợp nhất kéo dài. Có thể thiết lập dừng lỗ để giảm thiểu.
- Stop tracking stop loss risk. Fixed stop loss chỉ được đặt một lần sau khi nhập, không có điều chỉnh thêm, có thể bị vi phạm stop loss. Có thể tối ưu hóa với stop loss động hoặc trailing stop loss.
- Tăng rủi ro từ xu hướng sau khi bổ sung. Có thể đặt giới hạn về tần suất và kích thước của các bổ sung để kiểm soát rủi ro.
Hướng dẫn tối ưu hóa
Chiến lược có thể được tối ưu hóa trong các khía cạnh sau:
- Thêm cơ chế dừng lỗ năng động, điều chỉnh dừng lỗ dựa trên giá và biến động
- Thêm lợi nhuận để khóa lợi nhuận tốt hơn
- Bao gồm chỉ số khối lượng giao dịch để tránh sự phá vỡ sai số lượng thấp
- Thêm xu hướng sau cơ chế bổ sung vị trí để bổ sung vừa phải cho các vị trí chiến thắng
Kết luận
/*backtest
start: 2023-01-16 00:00:00
end: 2024-01-22 00:00:00
period: 1d
basePeriod: 1h
exchanges: [{"eid":"Futures_Binance","currency":"BTC_USDT"}]
*/

//@version=4
strategy("Long Only Multi-Indicator Strategy", shorttitle="LOMIS", overlay=true)

// Inputs
lengthMAFast = input(10, title="Fast MA Length")
lengthMASlow = input(50, title="Slow MA Length")
rsiLength = input(14, title="RSI Length")
rsiOverbought = input(70, title="RSI Overbought Level")
rsiOversold = input(30, title="RSI Oversold Level")
atrLength = input(14, title="ATR Length")
riskMultiplier = input(1.5, title="Risk Multiplier for SL and TP")

// Moving averages
maFast = sma(close, lengthMAFast)
maSlow = sma(close, lengthMASlow)

// RSI
rsi = rsi(close, rsiLength)

// ATR
atr = atr(atrLength)

// Long condition
longCondition = crossover(maFast, maSlow) and rsi < rsiOverbought

// Entering long trades
if (longCondition)
    strategy.entry("Long", strategy.long)
    slLong = close - atr * riskMultiplier
    tpLong = close + atr * riskMultiplier * 2
    strategy.exit("SL Long", "Long", stop=slLong)
    strategy.exit("TP Long", "Long", limit=tpLong)

// Plotting
plot(maFast, color=color.red)
plot(maSlow, color=color.blue)
hline(rsiOverbought, "Overbought", color=color.red)
hline(rsiOversold, "Oversold", color=color.blue)
Thêm nữa
- Chiến lược giao dịch chéo trung bình di chuyển thích nghi và trung bình di chuyển cân nhắc
- Định giá giao dịch theo đường thẳng
- Định hướng MACD nhiều khung thời gian theo chiến lược
- Xu hướng sau chiến lược giao dịch dựa trên MACD và RSI
- Chiến lược giao dịch định lượng vượt qua kênh ATR
- Tiêu chuẩn giá trị của các loại chứng khoán khác
- Chiến lược phòng ngừa rủi ro dựa trên TSI và chỉ số HMACCI
- Đường trung bình di chuyển kép đường chéo MACD Xu hướng theo chiến lược
- Chiến lược giao dịch định lượng dựa trên các chỉ số Ichimoku và ADX
- Chiến lược giao dịch RSI Divergence
- Chiến lược giao dịch lượng dựa trên đường chéo trung bình động
- Xu hướng nhiều khung thời gian theo chiến lược
- Chiến lược giao dịch lưới điện năng động
- Chiến lược đường lợi thế xác nhận trung bình di chuyển kép
- Crypto RSI Mini Sniper Xu hướng phản ứng nhanh theo chiến lược
- Chiến lược này là một chiến lược động lực dựa trên đường trung bình động
- Chiến lược giao dịch dao động động động lực động
- Xu hướng theo chiến lược dựa trên đường trung bình động