Chiến lược giao dịch đảo ngược động lực
Tác giả:ChaoZhang, Ngày: 2024-01-26 15:51:20Tags:

Tổng quan
Chiến lược logic
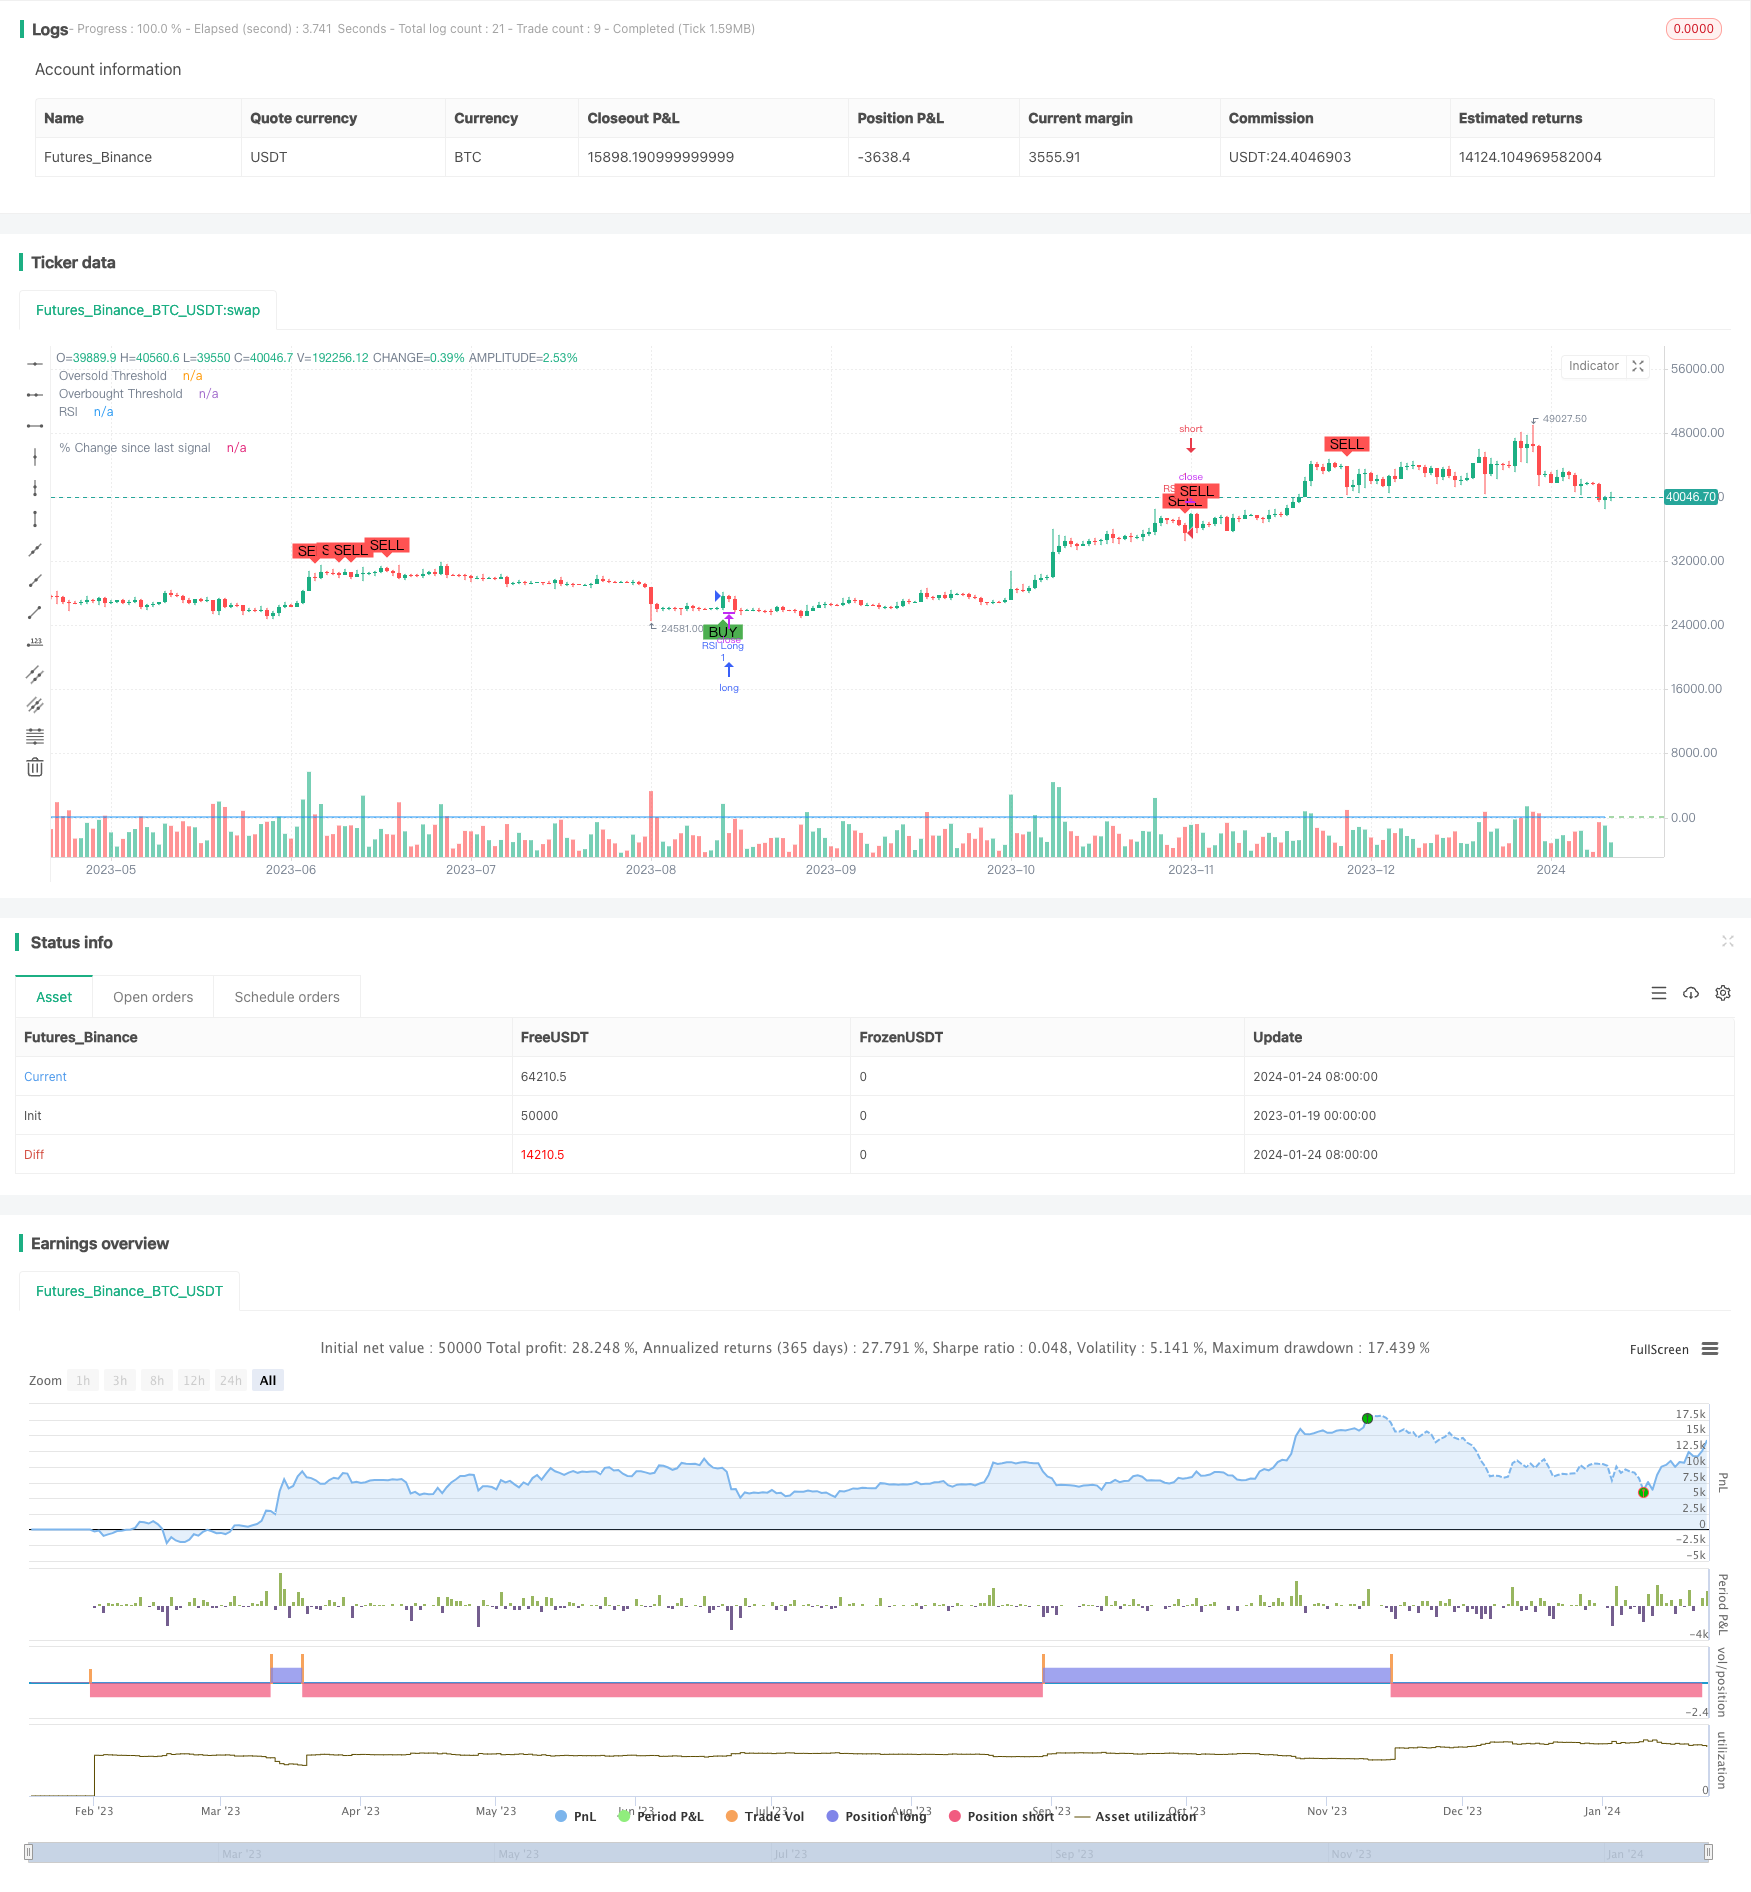
Chiến lược này cũng vẽ ra đường RSI, cũng như các đường ngưỡng. Các tín hiệu mua và bán được đánh dấu trên biểu đồ giá bằng văn bản và hình dạng. Ngoài ra, tỷ lệ thay đổi phần trăm kể từ tín hiệu cuối cùng được tính toán và vẽ ra để cung cấp cho các nhà giao dịch một cái nhìn trực quan về chuyển động giá sau tín hiệu.
Phân tích lợi thế
- Hiển thị tỷ lệ thay đổi từ tín hiệu cuối cùng để đánh giá hiệu quả của sự đảo ngược
- Các thông số RSI có thể tùy chỉnh phù hợp với các giai đoạn và tài sản khác nhau
- Có thể sử dụng một mình hoặc kết hợp với các chỉ số khác để cải thiện chiến lược
Phân tích rủi ro
- Khả năng tín hiệu giả mà không có sự đảo ngược thực tế được kích hoạt
- Tiếp tục xu hướng không đủ sau khi đảo ngược, có thể là điều chỉnh ngắn hạn
- Khả năng thất bại RSI cao hơn trong thời kỳ biến động cao
Hướng dẫn tối ưu hóa
- Thêm stop loss để kiểm soát lỗ giao dịch duy nhất
- Các giai đoạn RSI thử nghiệm có độ dài khác nhau
- Tối ưu hóa giá ngưỡng mua quá mức/bán quá mức dựa trên điều kiện thị trường
- Thêm quản lý vị trí để tăng trưởng theo cấp số nhân của các vị trí có lợi nhuận
Tóm lại
/*backtest
start: 2023-01-19 00:00:00
end: 2024-01-25 00:00:00
period: 1d
basePeriod: 1h
exchanges: [{"eid":"Futures_Binance","currency":"BTC_USDT"}]
*/

//@version=5
strategy("Improved RSI Strategy", overlay=true)

// Define RSI parameters
rsiLength = input(14, title="RSI Length")
rsiOversold = input(30, title="Oversold Threshold")
rsiOverbought = input(70, title="Overbought Threshold")

// Calculate RSI
rsiValue = ta.rsi(close, rsiLength)

// Define entry conditions
longCondition = ta.crossover(rsiValue, rsiOversold)
shortCondition = ta.crossunder(rsiValue, rsiOverbought)

// Plot RSI and thresholds
plot(rsiValue, title="RSI", color=color.blue)
hline(rsiOversold, title="Oversold Threshold", color=color.red)
hline(rsiOverbought, title="Overbought Threshold", color=color.green)

// Calculate percentage change since last signal
var float percentageChange = na
lastCloseValue = ta.valuewhen(longCondition or shortCondition, close, 1)

if longCondition or shortCondition
    percentageChange := (close - lastCloseValue) / lastCloseValue * 100

plot(percentageChange, color=color.blue, style=plot.style_histogram, linewidth=1, title="% Change since last signal")

// Execute strategy
if longCondition
    strategy.entry("RSI Long", strategy.long)

if shortCondition
    strategy.entry("RSI Short", strategy.short)

// Plot shapes and text for buy/sell signals
plotshape(series=longCondition, title="Buy Signal", location=location.belowbar, color=color.green, style=shape.labelup, text="BUY")
plotshape(series=shortCondition, title="Sell Signal", location=location.abovebar, color=color.red, style=shape.labeldown, text="SELL")
Thêm nữa
- Chiến lược kết hợp hai đường trung bình động và đường trung bình Williams
- Chiến lược siêu xu hướng ba lần thích nghi
- Chiến lược chéo trung bình di chuyển
- Market Cypher Wave B Chiến lược giao dịch tự động
- Chiến lược kiểm tra ngược chính
- Chiến lược kiểm tra ngược nến
- Chiến lược RSI Stochastic được làm mịn bởi Ehlers
- Chiến lược kênh hồi quy tuyến tính thích nghi
- Chiến lược đường chéo không chênh lệch trung bình động
- Nhiều chỉ số làm theo chiến lược
- Xu hướng vững chắc sau chiến lược
- Giá vượt qua xu hướng trung bình động theo chiến lược
- Chiến lược thoát khỏi EMA đôi Golden Cross
- Chiến lược xu hướng BB KC dần dần
- Chiến lược theo dõi tự động SMA ba lần
- Chiến lược giao dịch vị trí tương lai Bitcoin
- EMA giá với tối ưu hóa ngẫu nhiên dựa trên học máy