M Language “Turtle Trading strategy” implementations(V 1.0)

Author: 小小梦, Date: 2018-12-29 09:07:24
Tags: Turtle-tradingMyLanguage

Background

In 1994, Covel picked up an issue ofFinancial World and skimmed through an article titled “Wall Street’s TopPlayers.” Amongst famous investors like George Soros and Julian Robertson,Covel noticed a name he did not recognize at 25th on the list: R. Jerry Parker,who stated that he was trained as a “Turtle” by Richard Dennis(another name Covel did not recognize). Parker was the only investor in the tophundred advertised as being “trained,” and as an investor himself,Covel found this story intriguing.

Synopsis

Richard Dennis made over $200 million as a trader. After having a debate with his partner, William Eckhardt, about whether trading is learnable or an inborn talent, they proposed an experiment where they would spend two weeks training novices in the science of trading and then give them each $1 million to invest. The inspiration came from a trip Dennis took to a turtle-breeding farm in Singapore, stating, “We are going to grow traders just like they grow turtles.”

Although each of the 1,000 applicants went through a rigorous application process designed to test their intelligence, ability to manage risk and mathematical skills, the makeup of the chosen Turtles differed greatly; they included a Czechoslovakian-born blackjack master, a Dungeons and Dragons game designer, an evangelical accountant, a Harvard MBA, a U.S. Air Force pilot and a former pianist. The Turtles would go on to gross over $150 million in four years.

Trading rules:

In the capture of trend signals, the Turtle Trading Law uses a very important technical indicator, the Donchian channel. This channel is very similar to the familiar Bollinger Bands, but it is somewhat different in terms of specific calculations.

Richard Donchian invented this indicator. It consists of three curves of different colors. The indicator uses the highest price within the period (usually 20, some platform system settings can be changed, some can not be set) And the lowest price to show the volatility of the market price, when the channel is narrow, it means that the market volatility is small, otherwise the channel width means that the market volatility is relatively large.

When the price breaks through the upper track of the channel, it is a possible buy signal; on the contrary, it is a possible sell signal when breaking the lower track.

The calculation methods of the Donchian channel are as follows:

Upper rail = Max (highest, n), the highest value of the highest price of n days

Lower rail = Min (lowest price, n), the minimum value of the lowest price of n days

Middle rail = (upper rail + lower rail)/2

Within the framework of multi-factor analysis in the financial sector, this strategy predicts the price trend after the breakthrough is based on the validity hypothesis of the momentum factor. Of course, the effectiveness of this factor has indeed been rigorously verified and complemented by the Fama-French three-factor model and is widely used in financial markets.

Of course, we can optimize and use more reasonable trend-breaking indicators.

So, since the momentum factor is a factor that has been publicly and widely used, then why can the Turtle Trading Law stand out from the crowd? The answer is simple. The Turtle Trading Rules define a set of very strict rules for position control and stop-loss. Let’s take a look at each one.

    1. The basic unit of the position N

    The principle of the Turtle Rule is to define a small unit (Unit) so that the expected value fluctuation of the position corresponds to 1% of the total net assets. In other words, if you buy the assets of this small unit, the market value of the position on that day will not change by more than 1% of the total net assets.

    So how do you define this small unit? How do you estimate the value fluctuations that this small unit can bring? First, in predicting the value volatility of this small unit (this value volatility is called N), the Turtle Strategy uses a method of statistically averaging historical price volatility. The specific calculation formula is as follows:

    TrueRange = Max(High−Low, High−PreClose, PreClose−Low)

    N = (the sum of the N values ​​of the previous 19 days + the TrueRange at the time) / 20

    Among them, High indicates the highest price of the day, Low indicates the lowest price of the day, and PreClose indicates the closing price of the previous day. We can see from the definition that the value of N can indeed properly express the recent fluctuations in the price of the asset.

    Thus, a Unit should be calculated like this:

    Unit = (1%*Total_net)/N, Total_net is the total net asset value

    It can be seen that the price volatility of a Unit’s assets = 1% of the total net assets

    1. When to open a position

    The action of opening a position comes from the generation of a trend breakthrough signal. If the current price breaks through the upper track, it will generate a buy position signal. If the current price falls below the lower track, it will generate a short position signal (the cryptocurrency market is supported by the short sale!)

    Initial build size = 1 Unit

    1. When is the adding position?

    If the holding position is long positions and the price of the asset has increased by 0.5N based on the last holding position (or adding position), then add a unit of long position;

    If the holding position is short position and the price of the asset has dropped by 0.5N based on the last position (or adding position), then add a unit of short position.

    We have seen that the Turtle Strategy is actually a strategy of chasing up and down.

    1. How to do dynamic stop loss

    If the holding position is long positions and the price of the asset falls by 2N based on the last holding position (or adding position), then stop loss for all positions;

    If the holding position is short position and the price of the asset has increased by 2N based on the last holding position (or adding position), then the entire position must be closed.

    Of course, the user can customize the dynamic stop loss plan, such as a 0.5N drop to start partial closing position, instead of waiting for a 2N decline after a rush to close the position; after all, the impact cost is there.

    1. How to make a profit, can you customizethe dynamic take profit?

    In the Turtle Rule, the Take Profit signal is generated like this:

    If the holding position is long positions and the current asset price falls below the lower track of the 10th Donchian channel, all position closed;

    If the holding position is short position and the current asset price rises above the upper track of the 10th Donchian channel, all position closed.

    Of course, users can customize the dynamic take profit plan, such as when the total net assets / initial net assets > 1.5, just take the profit.

Advantage

The biggest advantage of the Turtle Trading Law is to help us establish an effective method of controlling the size of the position.

Disadvantage

The turtle trading system has a common problem with the trend tracking strategy, which is the withdrawal of floating profit. The floating profit that is chasing up is likely to be spit out due to a sudden drop. It is very strong in the big trend, and it is not perform very well in the shock market.

Enough talk, let’s make it happen!

M language

After 6 years of development, it has absorbed feedback from hundreds of thousands of users. It is a mature and stable model development platform. M language is the most widely used programmatic model development platform in China.

The M language advocates the building block programming concept, which encapsulates complex algorithms into individual functions and adopts the construction mode of “small syntax, large function”. Although the grammar is simple, it can also support logical and complex financial applications with a special programmatic data structure and a rich financial statistical function library.

The function library of the M language is updated frequently, and new functions can be added at any time according to the new requirements of the customer to support the new ideas and new applications of the programmer.

The FMZ Quant not only realized the interpreter of the grammar of M language, but also enhanced its ability to mix programming with high-level language such as JavaScript.

For example:

// here you can call any API function from FMZ Quant scope.TEST = function(obj) { return obj.val * 100; } Closing price: C;

The closing price is magnified 100 times: TEST©;

The previous closing price is magnified 100 times: TEST(REF(C, 1)); // The mouse moves to the backtest K line and the variable value is displayed.

img
img


(*backtest
start: 2018-11-01 00:00:00
end: 2018-12-19 00:00:00
period: 1d
exchanges: [{"eid":"Futures_BitMEX","currency":"XBT_USD"}]
args: [["ContractType","XBTUSD",126961]]
*)

// this demonstration mainly uses the Turtle Trading Rules to demonstrate the method of writing "position management, maximum position control and other fund management".
// only the demonstration key content statement is annotated, other statements please consult customer service
//This model is only used to demonstrate the use of this strategy, and enters the market accordingly, at your own risk.

TR:=MAX(MAX((HIGH-LOW),ABS(REF(CLOSE,1)-HIGH)),ABS(REF(CLOSE,1)-LOW));// True volatility
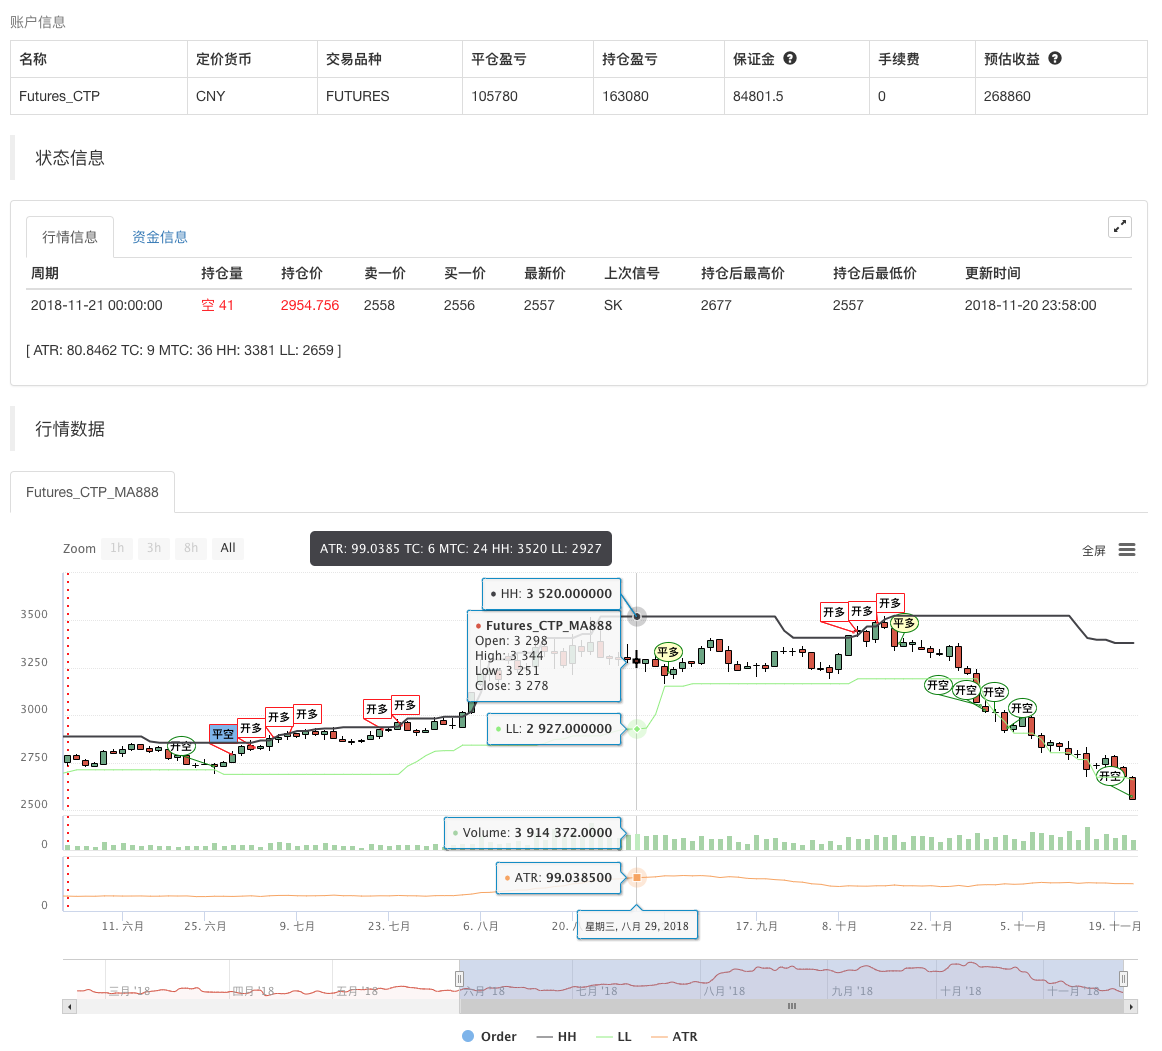
ATR:MA(TR,26); // Find a simple moving average of the true amplitude in 26 cycles, shown in the figure
ZOOM:=IFELSE(ISCONTRACT('@Futures_(?!CTP).*'), CLOSE, 1); // Compatible with cryptocurrency futures as margin
LOT:=((MONEYTOT*0.01*ZOOM)/(UNIT*ATR))*ZOOM;// Calculate the number of one hand based on 1% of equity
TC..IFELSE(ISCONTRACT('@Futures.*'), INTPART(LOT), LOT); // Compatible futures and spot ISCONTRACT starts with @ to indicate matching exchange name, support
MTC..4*TC; // Total position
HH^^HV(H,20); // Attached to the main image display
LL^^LV(L,20); // Attached to the main image display
CROSSUP(C,HH)&&ISLASTBK=0&&ISLASTSK=0&&BARPOS>=26,BK(TC);// The latest price exceeds the highest value of 20 cycles, the first time to buy long, the quality is TC hands
CROSSDOWN(C,LL)&&ISLASTBK=0&&ISLASTSK=0,SK(TC); // The latest price fell below the lowest value of 20 cycles, the first time to sell short, the quality is TC hands 
C>=BKPRICE+0.5*ATR&&BKVOL<MTC&&ISLASTBK,BK(TC);// The price has increased by 0.5 times ATR on the basis of the last holding position, and when the number of hands does not exceed 4 times of TC, buy long the adding position of TC hands
C<=SKPRICE-0.5*ATR&&SKVOL<MTC&&ISLASTSK,SK(TC);// The price fell 0.5 times ATR on the basis of the last holding position, and when the number of hands does not exceed 4 times of TC, sell short the adding position of TC hand.
C<=(BKPRICE-2*ATR)&&BKVOL>0,SP(BKVOL);// The latest price is less than the opening price minus 2 times of ATR, stop loss and close position
C>=(SKPRICE+2*ATR)&&SKVOL>0,BP(SKVOL); // The latest price is greater than the opening price plus 2 times of ATR, stop loss and close position
CROSSUP(H,HV(H,10))&&SKVOL>0,BP(SKVOL);// The highest price up-cross the highest price of 10 cycles, closing the position
CROSSDOWN(L,LV(L,10))&&BKVOL>0,SP(BKVOL); // The lowest price down-cross the lowest price of 10 cycles, closing position
TRADE_AGAIN(10);

Related

More