基于MA和RSI的趋势跟踪摆动策略
Author: ChaoZhang, Date: 2024-03-22 14:31:57Tags:
策略概述
基于MA和RSI的趋势跟踪摆动策略是一种结合移动平均线和相对强弱指标的量化交易策略。该策略旨在捕捉市场的中长期趋势,同时利用RSI指标来判断市场的超买超卖状态,以优化进出场点位。
策略原理
该策略的核心原理如下:
计算两条不同周期的移动平均线(MA),分别为快速MA和慢速MA。当快速MA上穿慢速MA时,认为市场进入上升趋势;当快速MA下穿慢速MA时,认为市场进入下降趋势。
计算RSI指标,用于判断市场的超买超卖状态。当RSI高于超买阈值时,认为市场处于超买状态;当RSI低于超卖阈值时,认为市场处于超卖状态。
综合MA和RSI的信号,当市场处于上升趋势且RSI未超买时,开多仓;当市场处于下降趋势且RSI未超卖时,开空仓。
设置止损和止盈价位,以控制风险和锁定利润。止损价位根据最新收盘价和止损百分比计算,止盈价位根据最新收盘价、止损百分比和风险收益比计算。
当价格触及止损或止盈价位时,平仓离场。
策略优势
趋势跟踪:该策略通过MA交叉来判断市场趋势,能够有效捕捉中长期的价格趋势。
超买超卖判断:引入RSI指标,在趋势判断的基础上,进一步优化进场时机,避免在超买超卖区进场。
风险控制:设置了明确的止损和止盈价位,严格控制每笔交易的风险敞口。
参数灵活:策略的关键参数,如MA周期、RSI周期、超买超卖阈值、止损百分比、风险收益比等,都以输入参数的形式提供,用户可以根据自己的需求进行调整。
策略风险
参数风险:该策略的表现对参数选择较为敏感,不同的参数设置可能导致策略表现差异较大。因此,在实际应用中,需要对参数进行充分的回测和优化。
趋势识别风险:该策略主要依赖MA交叉来判断趋势,但在某些市场情况下(如震荡市或趋势转折点),MA交叉可能会出现误判或滞后。
黑天鹅事件:该策略主要基于历史数据构建,对于一些突发的、极端的市场事件(如重大政治事件、自然灾害等),可能无法及时应对。
优化方向
引入更多技术指标,如布林带、MACD等,以提高趋势判断的准确性和稳健性。
考虑加入市场情绪分析,如通过大数据分析市场情绪,以辅助判断趋势和调整仓位。
对参数进行更全面、细致的优化,可以使用遗传算法等智能优化方法,寻找最优参数组合。
在策略中加入仓位管理和资金管理模块,根据市场波动性和账户盈亏情况动态调整仓位,以进一步控制风险。
总结
基于MA和RSI的趋势跟踪摆动策略是一种较为经典的量化交易策略,通过MA交叉来判断市场趋势,并利用RSI指标优化进出场点位。该策略逻辑清晰,易于实现和优化,能够有效捕捉市场的中长期趋势,同时控制了一定的风险。但该策略对参数选择较为敏感,在实际应用中需要进行充分的回测和优化。此外,该策略主要基于技术指标构建,对于一些极端的市场事件可能应对不足。未来可以考虑引入更多技术指标和市场情绪分析,并加入仓位管理和资金管理模块,以进一步提升策略的稳健性和盈利能力。总的来说,该策略提供了一个基本的量化交易框架,可以作为进一步开发和优化的基础。
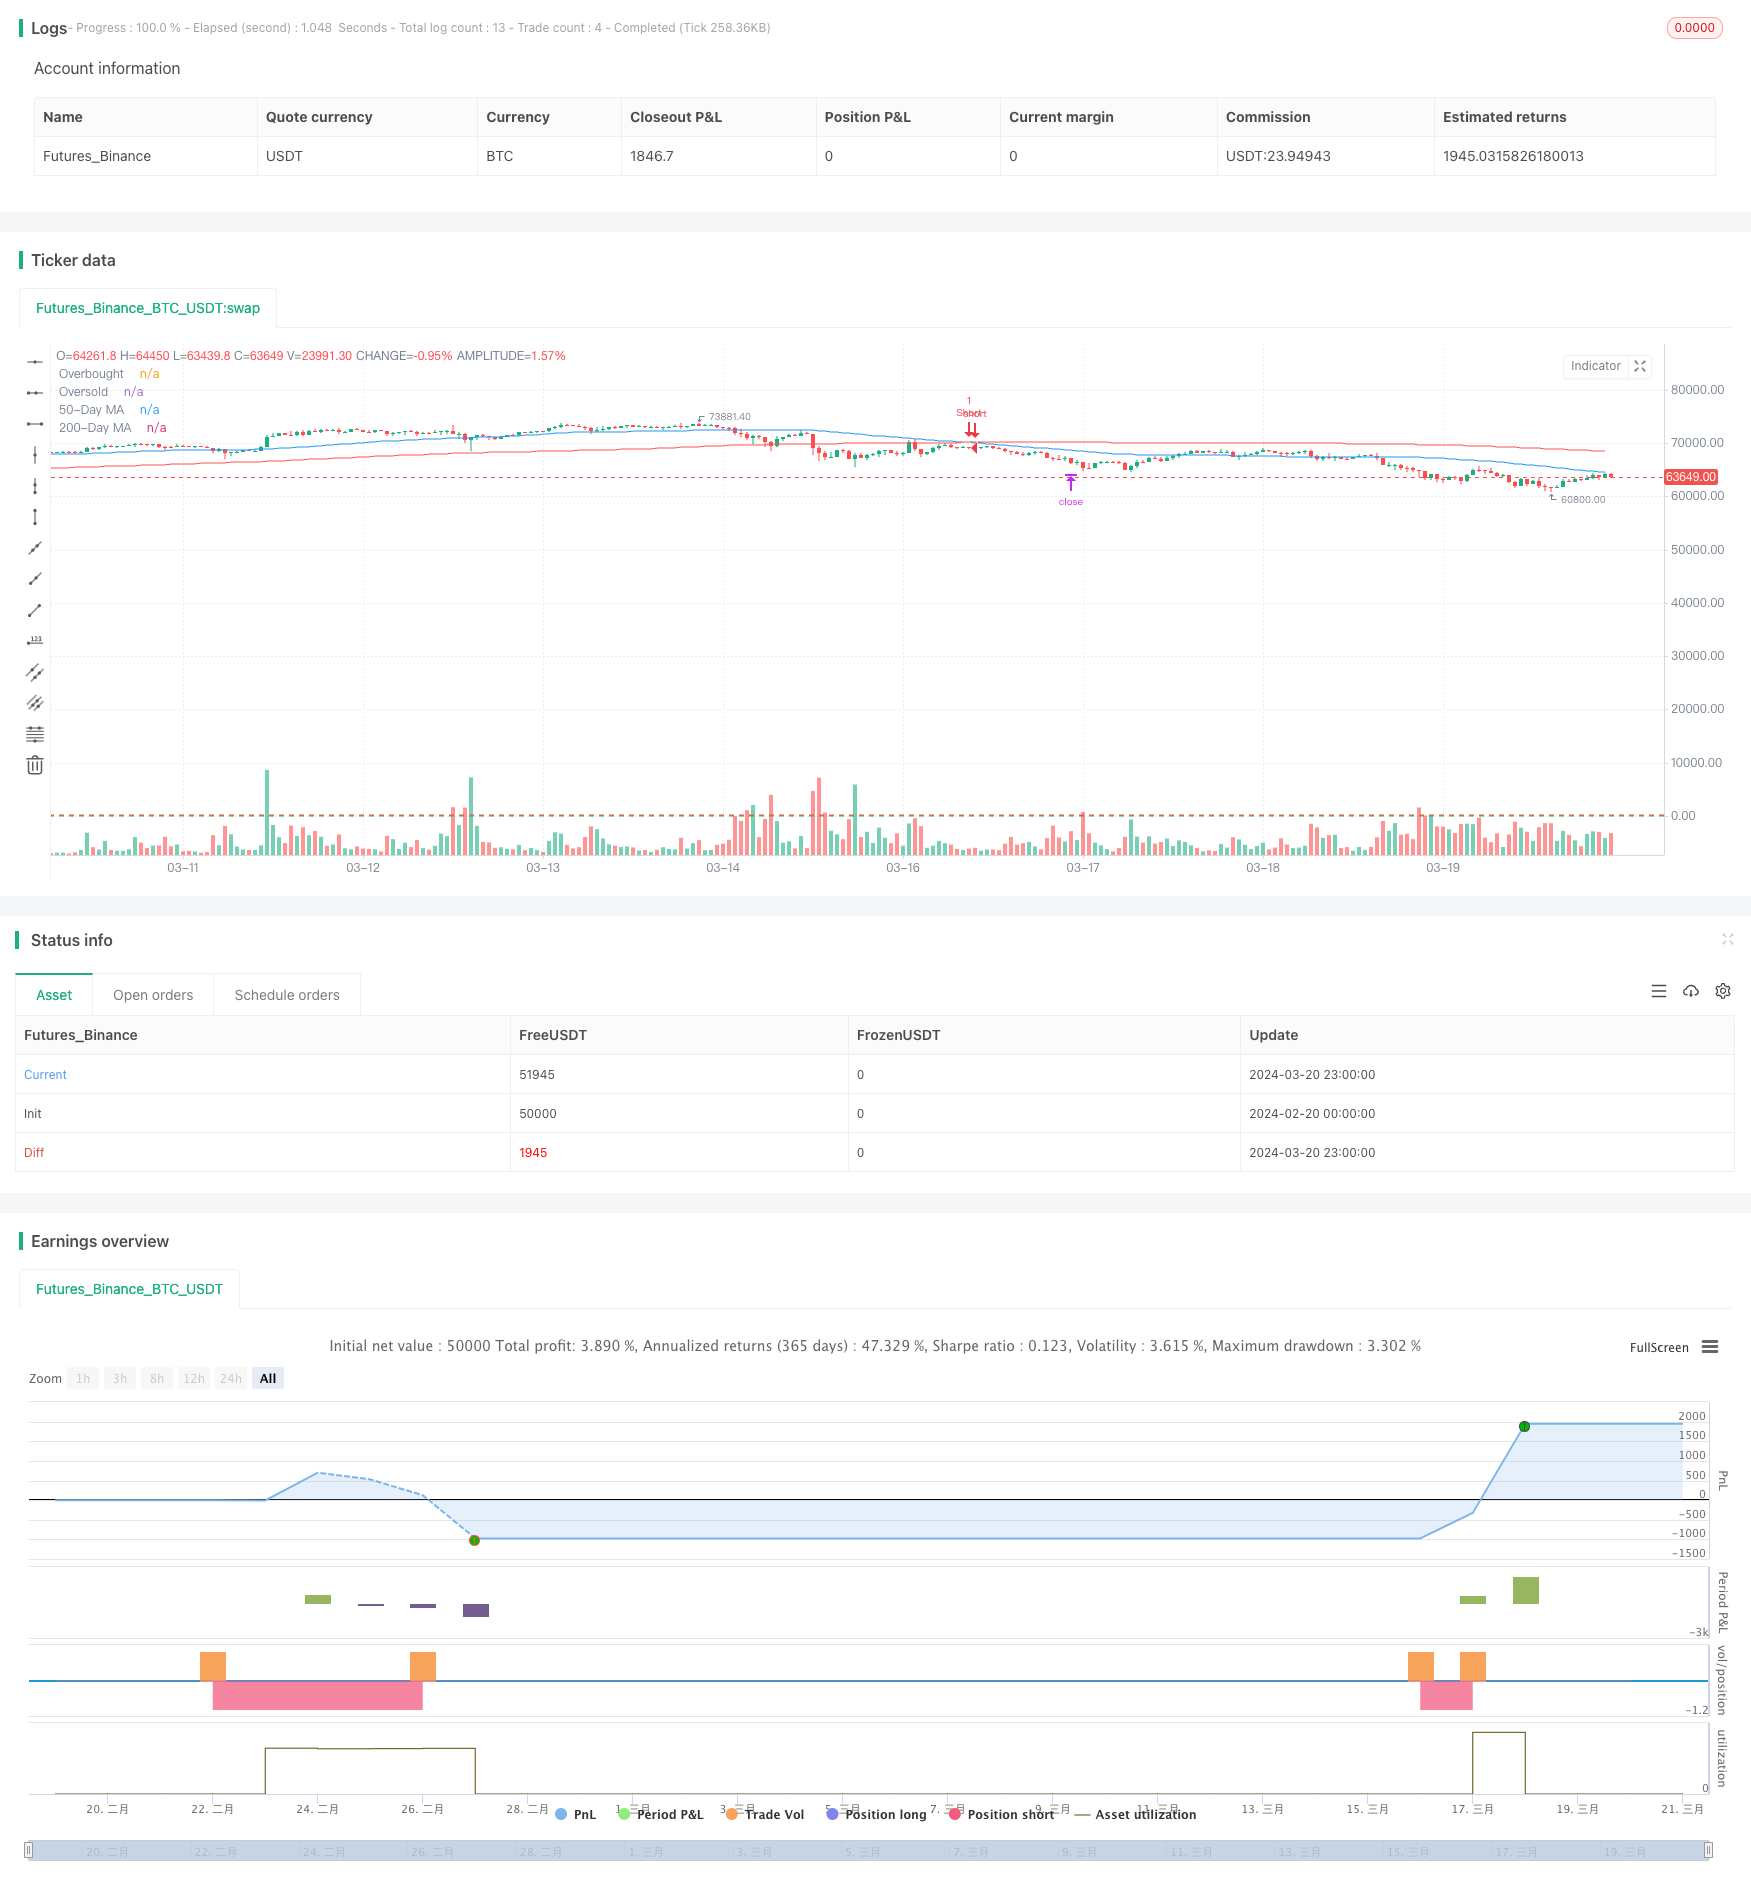
/*backtest
start: 2024-02-20 00:00:00
end: 2024-03-21 00:00:00
period: 1h
basePeriod: 15m
exchanges: [{"eid":"Futures_Binance","currency":"BTC_USDT"}]
*/

//@version=5
strategy("Swing Trading Strategy", overlay=true)

// Inputs
ma_fast_length = input(50, "50-Day MA")
ma_slow_length = input(200, "200-Day MA")
rsi_length = input(14, "RSI Length")
rsi_overbought = input(70, "RSI Overbought")
rsi_oversold = input(30, "RSI Oversold")
risk_reward_ratio = input(2.0, "Risk/Reward Ratio")
stop_loss_percent = input(2.0, "Stop Loss (%)")

// Moving Averages
ma_fast = ta.sma(close, ma_fast_length)
ma_slow = ta.sma(close, ma_slow_length)

// RSI
rsi = ta.rsi(close, rsi_length)

// Trend Identification
bullish_trend = ta.crossover(ma_fast, ma_slow)
bearish_trend = ta.crossunder(ma_fast, ma_slow)

// Entry Conditions
long_entry = bullish_trend and close > ma_fast and rsi < rsi_overbought
short_entry = bearish_trend and close < ma_fast and rsi > rsi_oversold

// Stop Loss and Take Profit Calculations
long_sl = close * (1 - stop_loss_percent / 100)
short_sl = close * (1 + stop_loss_percent / 100)
long_tp = close * (1 + (stop_loss_percent / 100) * risk_reward_ratio)
short_tp = close * (1 - (stop_loss_percent / 100) * risk_reward_ratio)

// Strategy Execution
if (long_entry)
    strategy.entry("Long", strategy.long)
    strategy.exit("Exit Long", "Long", stop=long_sl, limit=long_tp)

if (short_entry)
    strategy.entry("Short", strategy.short)
    strategy.exit("Exit Short", "Short", stop=short_sl, limit=short_tp)

// Plotting
plot(ma_fast, "50-Day MA", color=color.blue)
plot(ma_slow, "200-Day MA", color=color.red)
hline(rsi_overbought, "Overbought", color=color.red)
hline(rsi_oversold, "Oversold", color=color.green)
- 布林带动态止盈与动态加仓策略
- TrippleMACD均线交叉与相对强弱指标结合的高频加密货币交易策略
- RSI与EMA双重过滤策略
- 基于网格的多头 Martingale 动态加仓网格交易策略
- 双重指数移动平均云交叉自动交易策略
- 基于双时间框架EMA交叉信号的多空策略
- 赫尔移动平均交叉策略
- 双均线交叉优化止损策略
- 趋势突破策略
- 多重均线与RSI交叉交易策略
- 布林带+EMA趋势跟踪策略
- 基于双均线交叉和多时间周期DMI指标的趋势策略
- 基于技术分析和资金管理的量化交易策略
- Kuberan策略:市场掌控的交汇策略
- 烛台形态趋势过滤策略
- 双均线趋势跟踪策略
- 基于ATR双重跟踪止损的动态止盈止损策略
- MACD+EMA多时间尺度突破策略
- Flawless Victory DCA 动量与波动率策略
- 基于MACD、ADX和EMA200的多时间框架趋势交易策略