概述
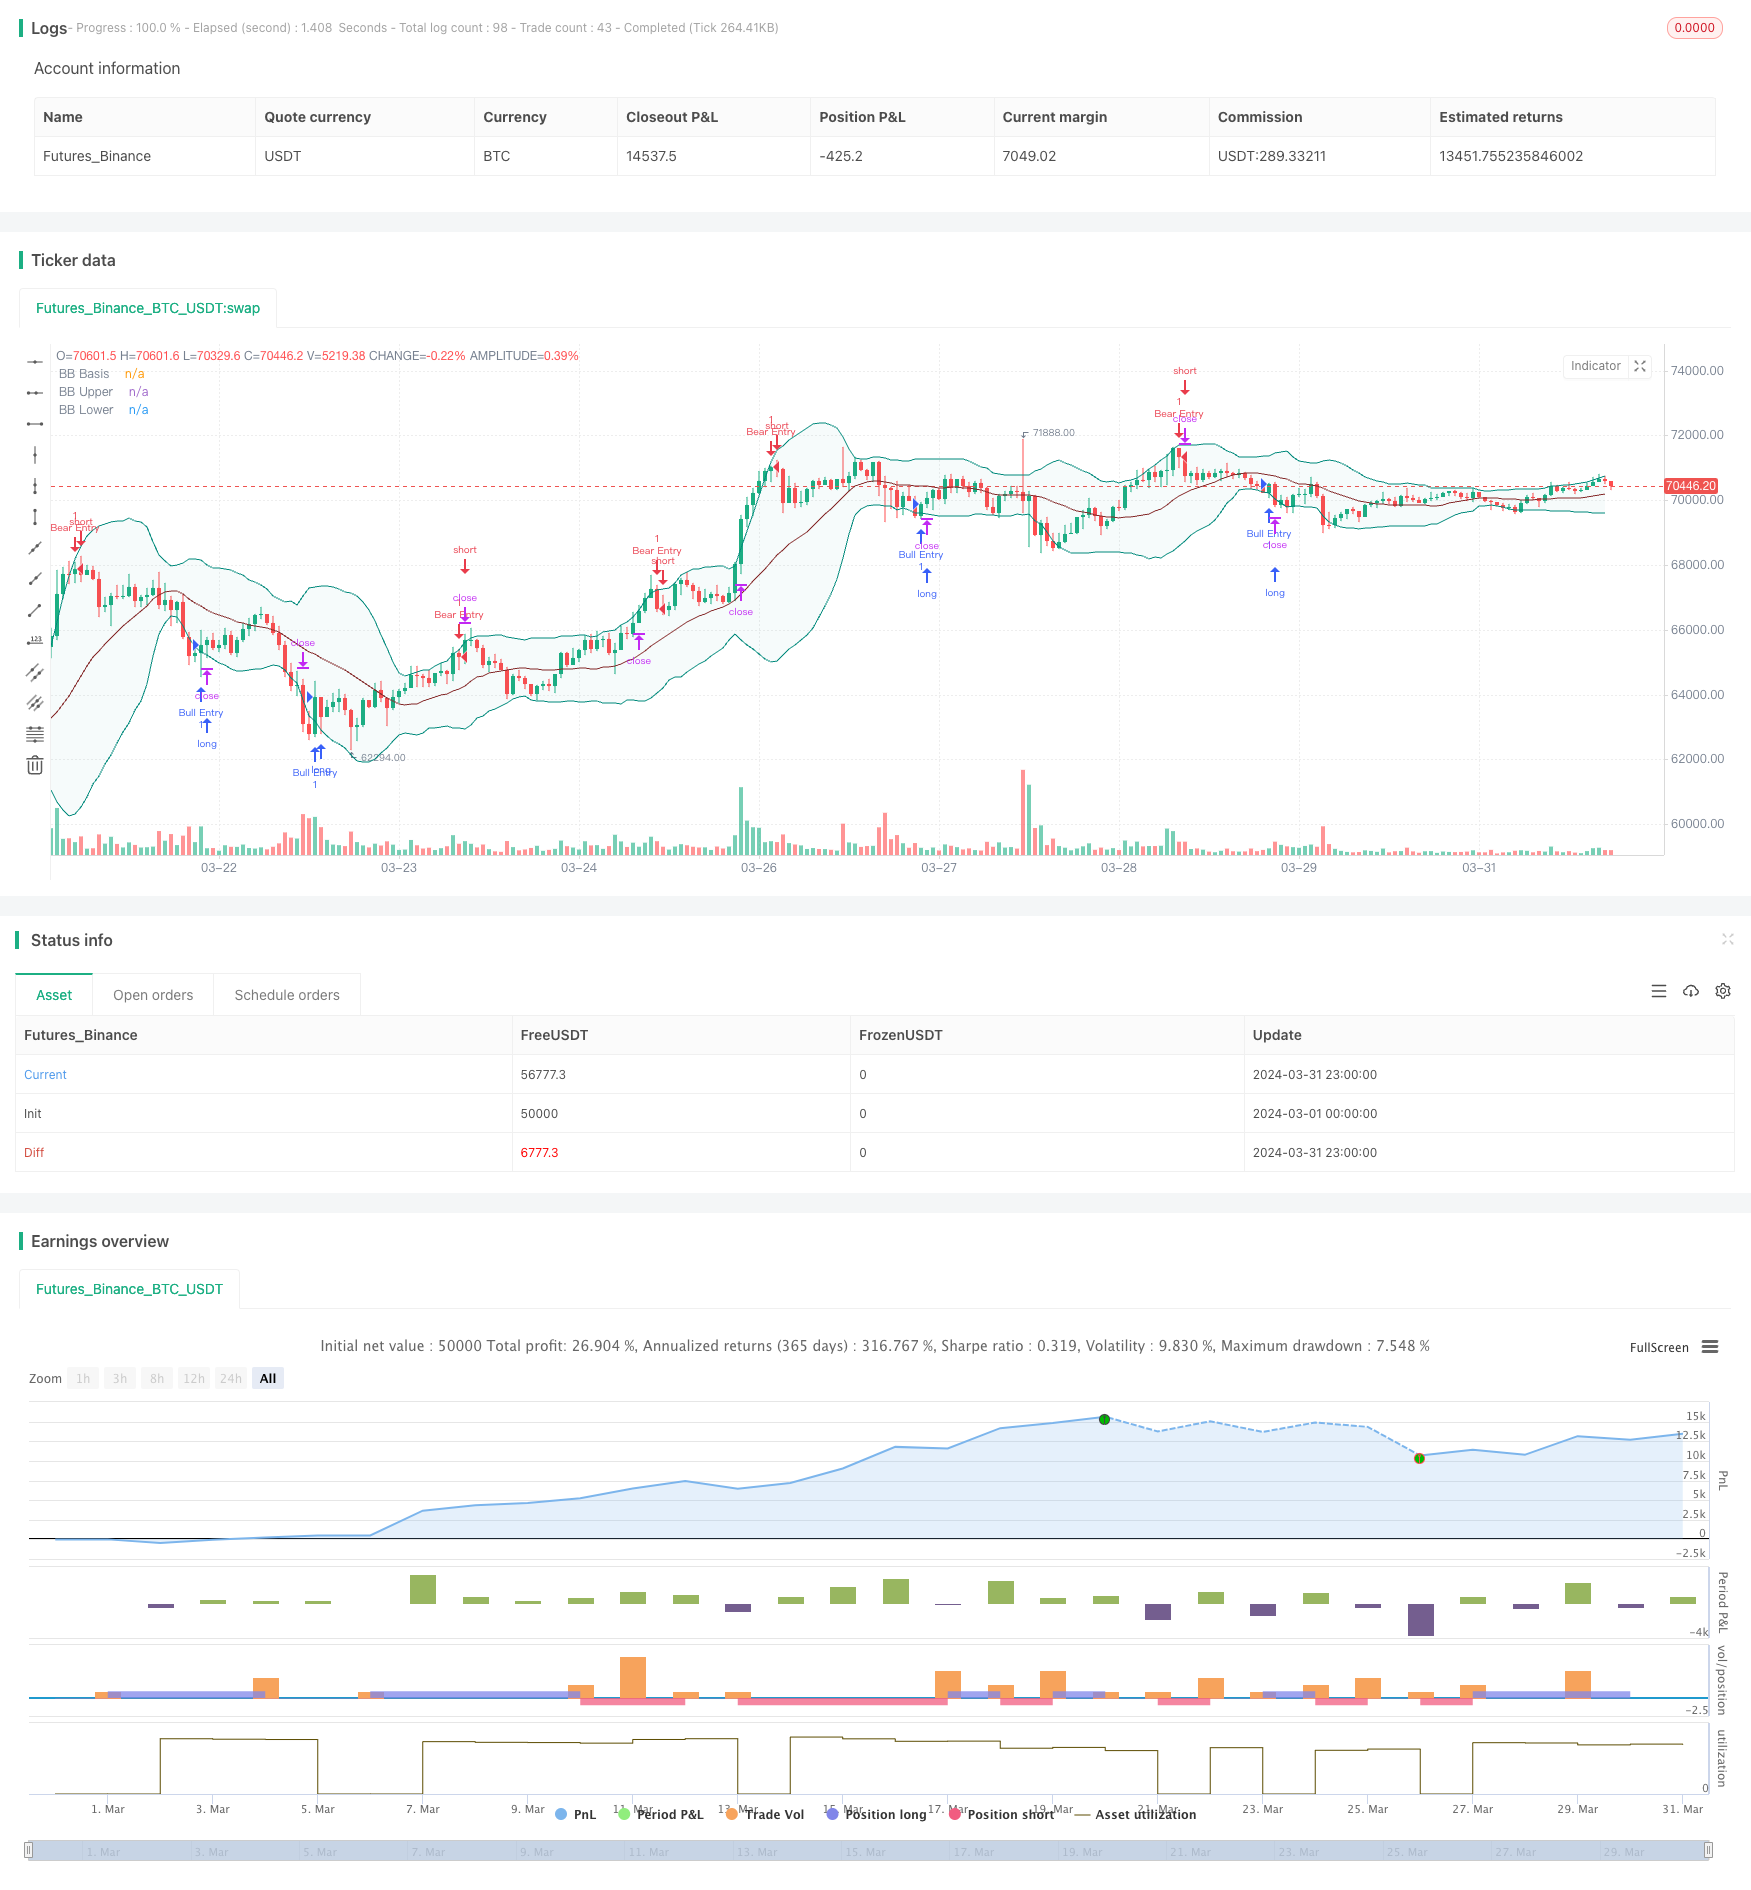
BBSR极限策略是一种全面的交易方法,结合了布林带(Bollinger Bands)和随机RSI(Stochastic RSI)来识别市场中潜在的进场和出场点。该策略利用布林带分析价格波动和水平,通过计算价格在简单移动平均线(SMA)周围的标准差,确定价格波动的上下界限,帮助交易者发现潜在的反转点。同时,随机RSI通过比较收盘价相对于一定时期内价格区间的位置来衡量动量,有助于判断超买或超卖状态,洞察潜在的看涨或看跌动能。
策略原理
- 当价格从布林带下轨以下突破到上方,同时随机RSI表明脱离超卖区域时,该策略发出做多信号,表明上升趋势启动,触发买入指令。
- 相反地,当价格从布林带上轨以上跌破到下方,而随机RSI从超买区域移动时,则发出做空信号,表明可能出现下跌趋势,触发卖出指令。
- 该策略的一个关键特点是纳入了用户自定义的止损百分比,通过指定每笔交易的最大允许损失来管理风险。
- 对于多头仓位,当检测到看跌信号或价格跌破布林带下轨时,建议反转或看涨趋势减弱,平仓离场。
- 对于空头仓位,当出现看涨信号或价格突破布林带上轨时,表明潜在反转或看跌动能减弱,平仓离场。
策略优势
- 该策略提供了一个结构化的框架,利用布林带和随机RSI的优势进行交易的进场和出场。
- 内置止损百分比等可定制参数,允许交易者根据自己的风险承受能力和交易目标来调整策略。
- 能够在TradingView上进行回测和模拟交易,可以洞察该策略在历史市场条件下的表现。
- 专为寻求利用趋势反转和动量转变的交易者而设计,具有内置的风险管理功能,可以防范重大损失。
策略风险
- 在震荡市或趋势不明朗时,频繁的交易信号可能导致过度交易和潜在的损失。
- 止损设置可能无法充分保护交易者免受急剧的不利价格变动的影响。
- 依赖单一的技术指标组合可能无法全面捕捉市场动态,导致错误的交易决策。
- 回测结果可能受到过度拟合的影响,在实际市场条件下表现未必一致。
策略优化方向
- 纳入其他技术指标或市场情绪指标,以改进交易信号的可靠性。
- 引入动态止损或追踪止损机制,以更好地保护利润和限制损失。
- 优化进场和出场规则,例如要求连续多个时间段的确认信号,以过滤掉噪音和假信号。
- 根据不同的市场状况或资产类别,调整布林带和随机RSI的参数设置。
- 考虑交易的资金管理和仓位调整策略,以优化风险回报比。
总结
BBSR极限策略通过创新性地结合布林带和随机RSI,为交易者提供了一个全面的框架,用于识别潜在的趋势反转和动量转变。内置的风险管理功能和可定制参数使其能够适应不同的交易风格和目标。尽管该策略展示了前景,但交易者仍需认识到其局限性,并考虑优化和调整的空间,以提高其在实际市场条件下的稳健性和表现。
策略源码
/*backtest
start: 2024-03-01 00:00:00
end: 2024-03-31 23:59:59
period: 1h
basePeriod: 15m
exchanges: [{"eid":"Futures_Binance","currency":"BTC_USDT"}]
*/

//@version=5
strategy("BBSR Extreme Strategy [nachodog]", shorttitle="BBSRExtStrat", overlay=true)

//General Inputs
src = input(close, title="Source")
offset = input.int(0, title="Offset", minval=-500, maxval=500)
sl_pct = input.float(1.5, title="Stop Loss (%)", minval=0.1, maxval=50)

//Bollinger Inputs
length = input.int(20, title="Bollinger Band Length", minval=1)
mult = input.float(2.0, title="StdDev", minval=0.001, maxval=50)

//Bollinger Code
basis = ta.sma(src, length)
dev = mult * ta.stdev(src, length)
upper = basis + dev
lower = basis - dev
plot(basis, "BB Basis", color=color.new(#872323, 0), offset=offset)
p1 = plot(upper, "BB Upper", color=color.teal, offset=offset)
p2 = plot(lower, "BB Lower", color=color.teal, offset=offset)
fill(p1, p2, title="BB Background", color=color.new(#198787, 95))

//Stoch Inputs
smoothK = input.int(3, "K", minval=1)
smoothD = input.int(3, "D", minval=1)
lengthRSI = input.int(14, "RSI Length", minval=1)
lengthStoch = input.int(14, "Stochastic Length", minval=1)

upperlimit = input.float(90, "Upper Limit", minval=0.01)
lowerlimit = input.float(10, "Lower Limit", minval=0.01)

//Stochastic Code
rsi1 = ta.rsi(src, lengthRSI)
k = ta.sma(ta.stoch(rsi1, rsi1, rsi1, lengthStoch), smoothK)
d = ta.sma(k, smoothD)

//Evaluation
Bear = close[1] > upper[1] and close < upper and k[1] > upperlimit and d[1] > upperlimit
Bull = close[1] < lower[1] and close > lower and k[1] < lowerlimit and d[1] < lowerlimit

//Entering Trades
if (Bull)
    strategy.entry("Bull Entry", strategy.long)
if (Bear)
    strategy.entry("Bear Entry", strategy.short)

//Exiting Trades
strategy.exit("Exit Long", from_entry="Bull Entry", stop=close * (1 - sl_pct / 100), when=Bear or close < lower)
strategy.exit("Exit Short", from_entry="Bear Entry", stop=close * (1 + sl_pct / 100), when=Bull or close > upper)
相关推荐