概述
布林带与相对强弱指数交叉交易策略是一种结合技术分析指标的量化交易方法。该策略主要利用布林带(Bollinger Bands)和相对强弱指数(RSI)这两个指标来生成交易信号。通过监测价格与布林带的交叉以及RSI的超买超卖水平,该策略旨在捕捉市场的反转点和趋势变化。这种方法试图在市场波动中寻找潜在的买入和卖出机会,同时通过RSI指标来确认信号的可靠性。
策略原理
布林带计算:
- 使用20天简单移动平均线(SMA)作为中轨。
- 上轨和下轨分别为中轨加减2倍标准差。
RSI计算:
- 使用14天周期的RSI。
- 设定70为超买水平,30为超卖水平。
买入信号生成:
- 当价格从下方突破布林带下轨。
- 同时RSI低于30(超卖状态)。
卖出信号生成:
- 当价格从上方跌破布林带上轨。
- 同时RSI高于70(超买状态)。
信号可视化:
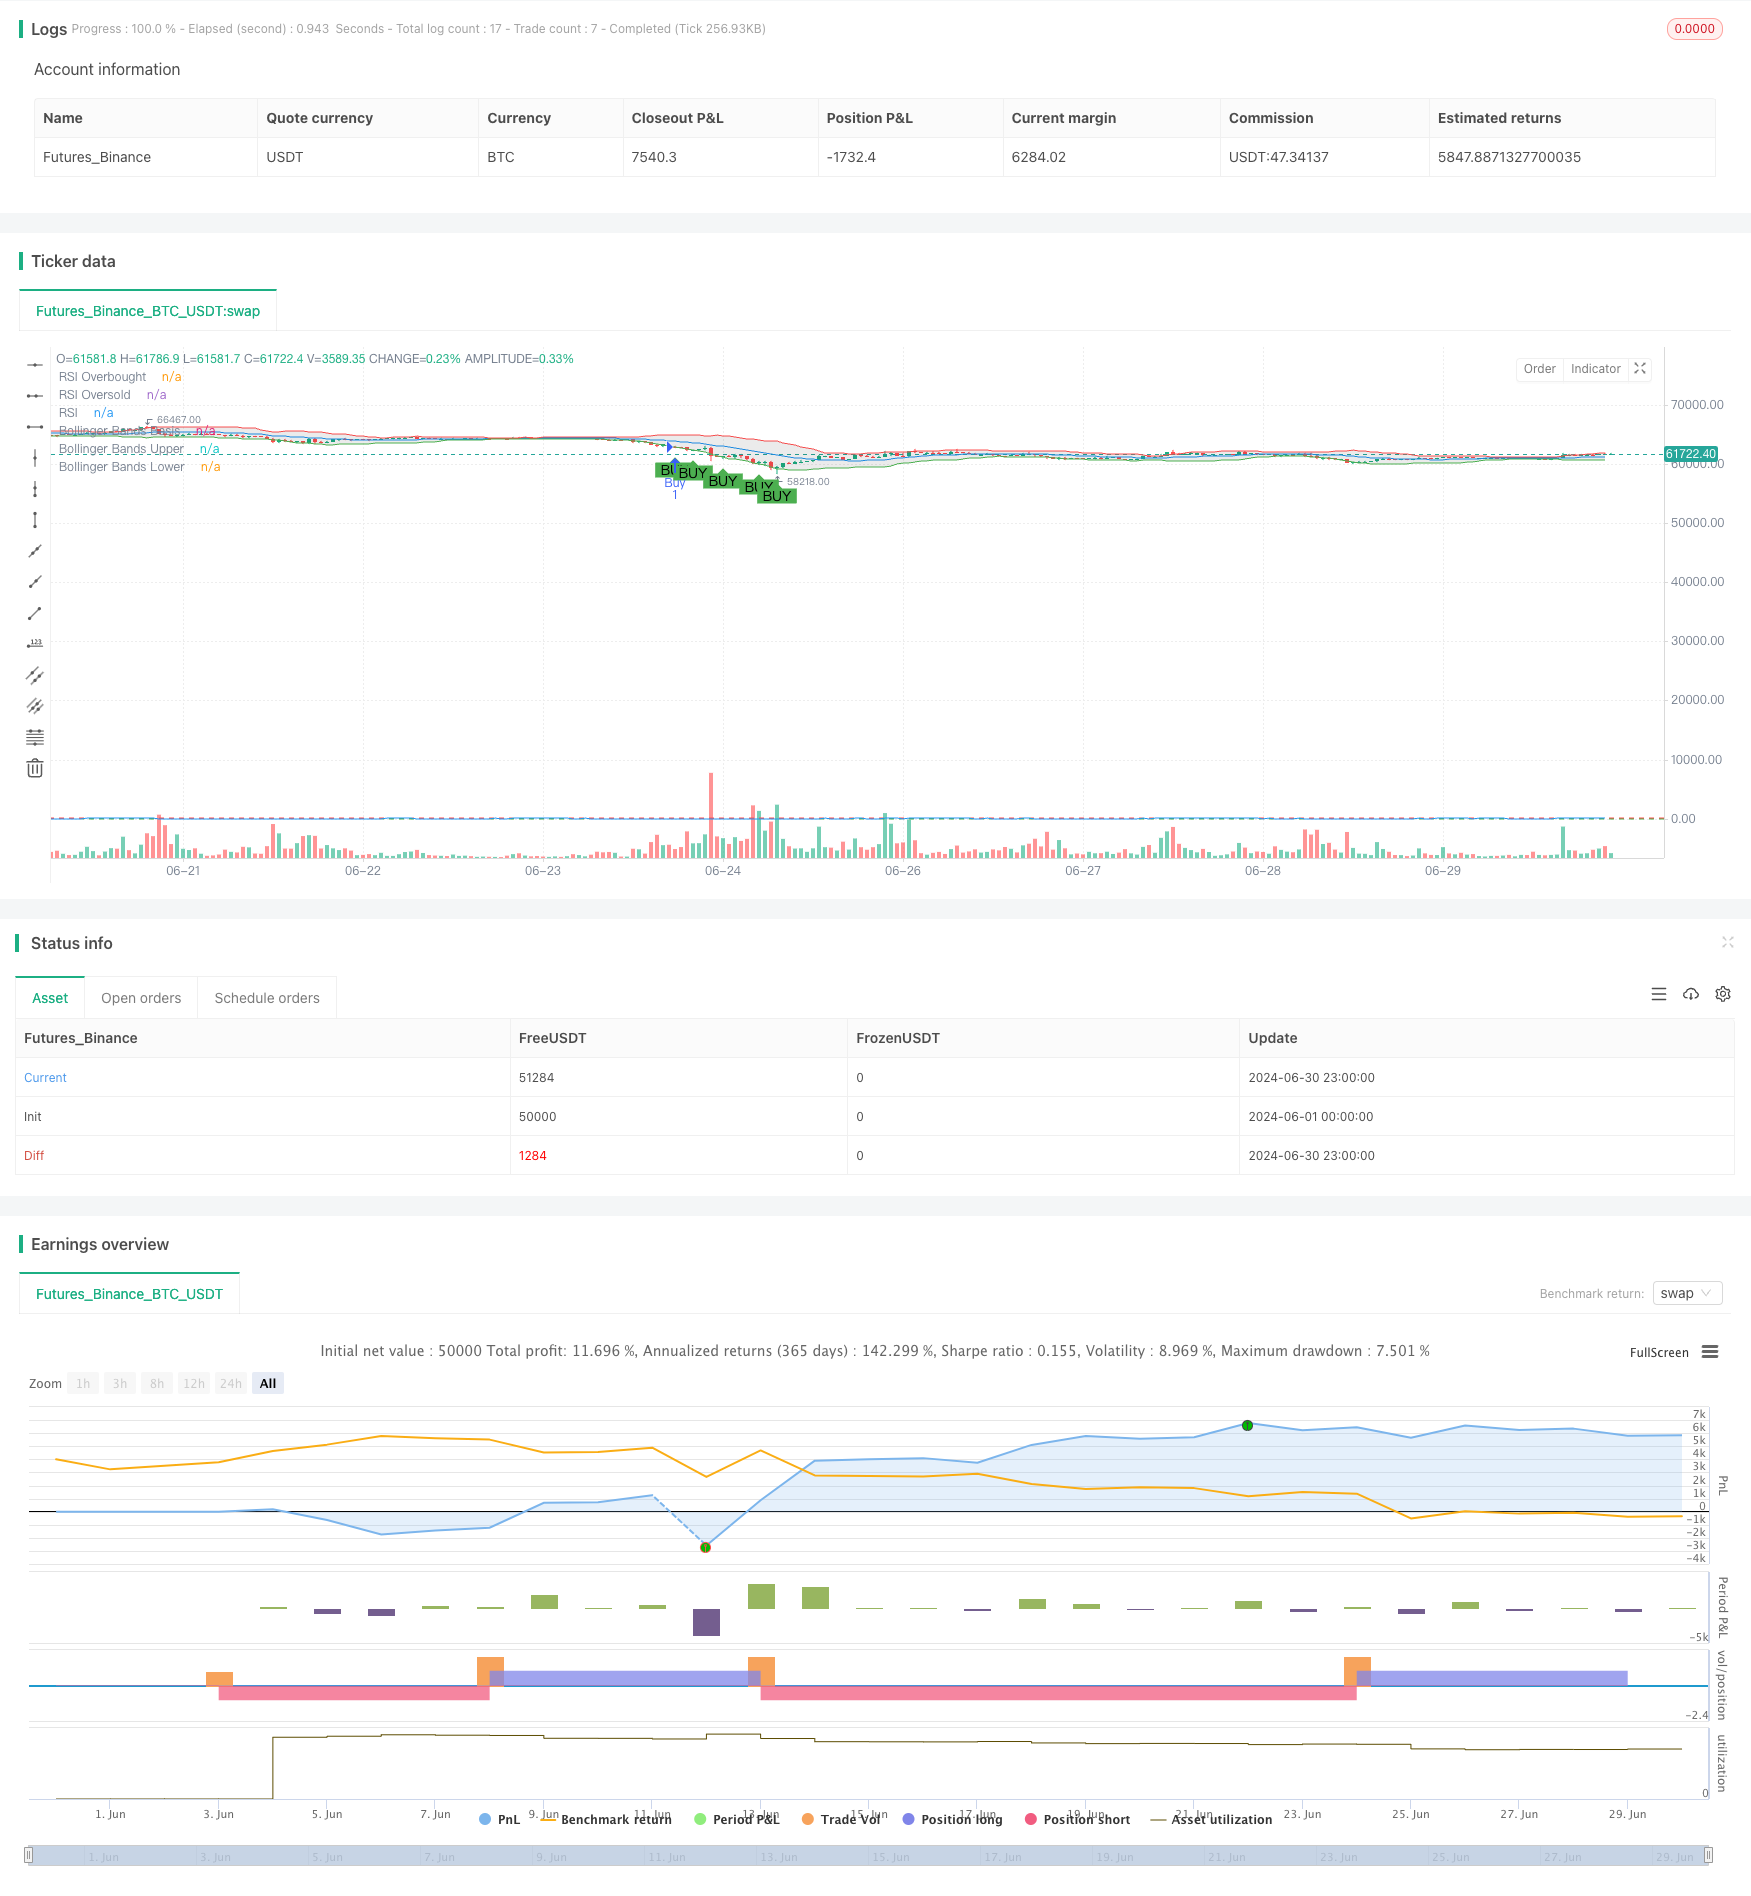
- 在图表上绘制布林带。
- 在价格突破点标注买卖信号。
交易执行:
- 根据生成的信号自动执行买入和卖出操作。
策略优势
多指标结合:通过结合布林带和RSI,策略能够更全面地分析市场状况,减少假信号。
趋势和反转捕捉:布林带有助于识别价格趋势,而RSI则帮助确认潜在的反转点。
风险管理:使用布林带作为动态支撑和阻力水平,有助于控制风险。
适应性强:布林带能够根据市场波动性自动调整,使策略适应不同市场环境。
可视化辅助:通过在图表上直观显示信号,便于交易者快速理解市场动态。
自动化执行:策略可以自动生成和执行交易信号,减少人为干预和情绪影响。
策略风险
假突破风险:市场可能出现短暂突破布林带但随后回落的情况,导致虚假信号。
趋势市场表现欠佳:在强劲趋势市场中,策略可能频繁生成反向信号,造成亏损。
参数敏感性:策略性能高度依赖于布林带和RSI的参数设置,不同市场可能需要不同的优化。
滞后性:作为滞后指标,布林带和RSI可能无法及时捕捉到快速的市场变化。
过度交易:在波动剧烈的市场中,可能产生过多的交易信号,增加交易成本。
市场噪音:在横盘市场或低波动期,策略可能受到市场噪音的影响,生成错误信号。
策略优化方向
动态参数调整:
- 实现布林带周期和乘数的自适应调整。
- 根据市场波动性动态调整RSI的超买超卖阈值。
增加趋势过滤器:
- 引入长期移动平均线或ADX指标来判断市场趋势。
- 在强趋势中抑制反向交易信号。
整合成交量分析:
- 将成交量指标纳入信号确认过程。
- 要求突破时伴随成交量增加,以提高信号可靠性。
优化止损和获利策略:
- 实现基于ATR的动态止损。
- 设计阶梯式获利了结机制。
引入时间过滤:
- 分析不同时间段的策略表现。
- 在效果最佳的时间段内执行交易。
多时间框架分析:
- 结合更长和更短时间周期的信号。
- 通过多时间框架确认来增强信号可靠性。
总结
布林带与相对强弱指数交叉交易策略是一种结合技术分析工具的量化交易方法。通过同时利用布林带的趋势跟踪特性和RSI的超买超卖指示,该策略旨在捕捉市场的重要转折点。虽然这种方法在识别潜在交易机会方面具有优势,但也面临着假突破和参数敏感性等挑战。为了提高策略的稳健性和适应性,可以考虑引入动态参数调整、趋势过滤器和多时间框架分析等优化措施。总的来说,这是一个值得进一步研究和优化的策略框架,有潜力在各种市场条件下产生稳定的交易结果。
//@version=5
strategy("Bollinger Bands and RSI Strategy", overlay=true)

// Define Bollinger Bands parameters
length = input(20, title="Bollinger Bands Length")
src = close
mult = input(2.0, title="Bollinger Bands Multiplier")
basis = ta.sma(src, length)
dev = mult * ta.stdev(src, length)
upper = basis + dev
lower = basis - dev

// Define RSI parameters
rsiLength = input(14, title="RSI Length")
rsiOverbought = input(70, title="RSI Overbought Level")
rsiOversold = input(30, title="RSI Oversold Level")
rsi = ta.rsi(close, rsiLength)

// Generate Buy Signal
buySignal = ta.crossover(close, lower) and rsi < rsiOversold

// Generate Sell Signal
sellSignal = ta.crossunder(close, upper) and rsi > rsiOverbought

// Plot Bollinger Bands on Chart
plot(basis, color=color.blue, title="Bollinger Bands Basis")
p1 = plot(upper, color=color.red, title="Bollinger Bands Upper")
p2 = plot(lower, color=color.green, title="Bollinger Bands Lower")
fill(p1, p2, color=color.rgb(0, 0, 0, 90))

// Plot Buy and Sell Signals on Chart
plotshape(series=buySignal, location=location.belowbar, color=color.green, style=shape.labelup, text="BUY")
plotshape(series=sellSignal, location=location.abovebar, color=color.red, style=shape.labeldown, text="SELL")

// Execute Buy and Sell Orders
if (buySignal)
    strategy.entry("Buy", strategy.long)
if (sellSignal)
    strategy.entry("Sell", strategy.short)

// Plot RSI on separate chart
hline(rsiOverbought, "RSI Overbought", color=color.red)
hline(rsiOversold, "RSI Oversold", color=color.green)
plot(rsi, color=color.blue, title="RSI")