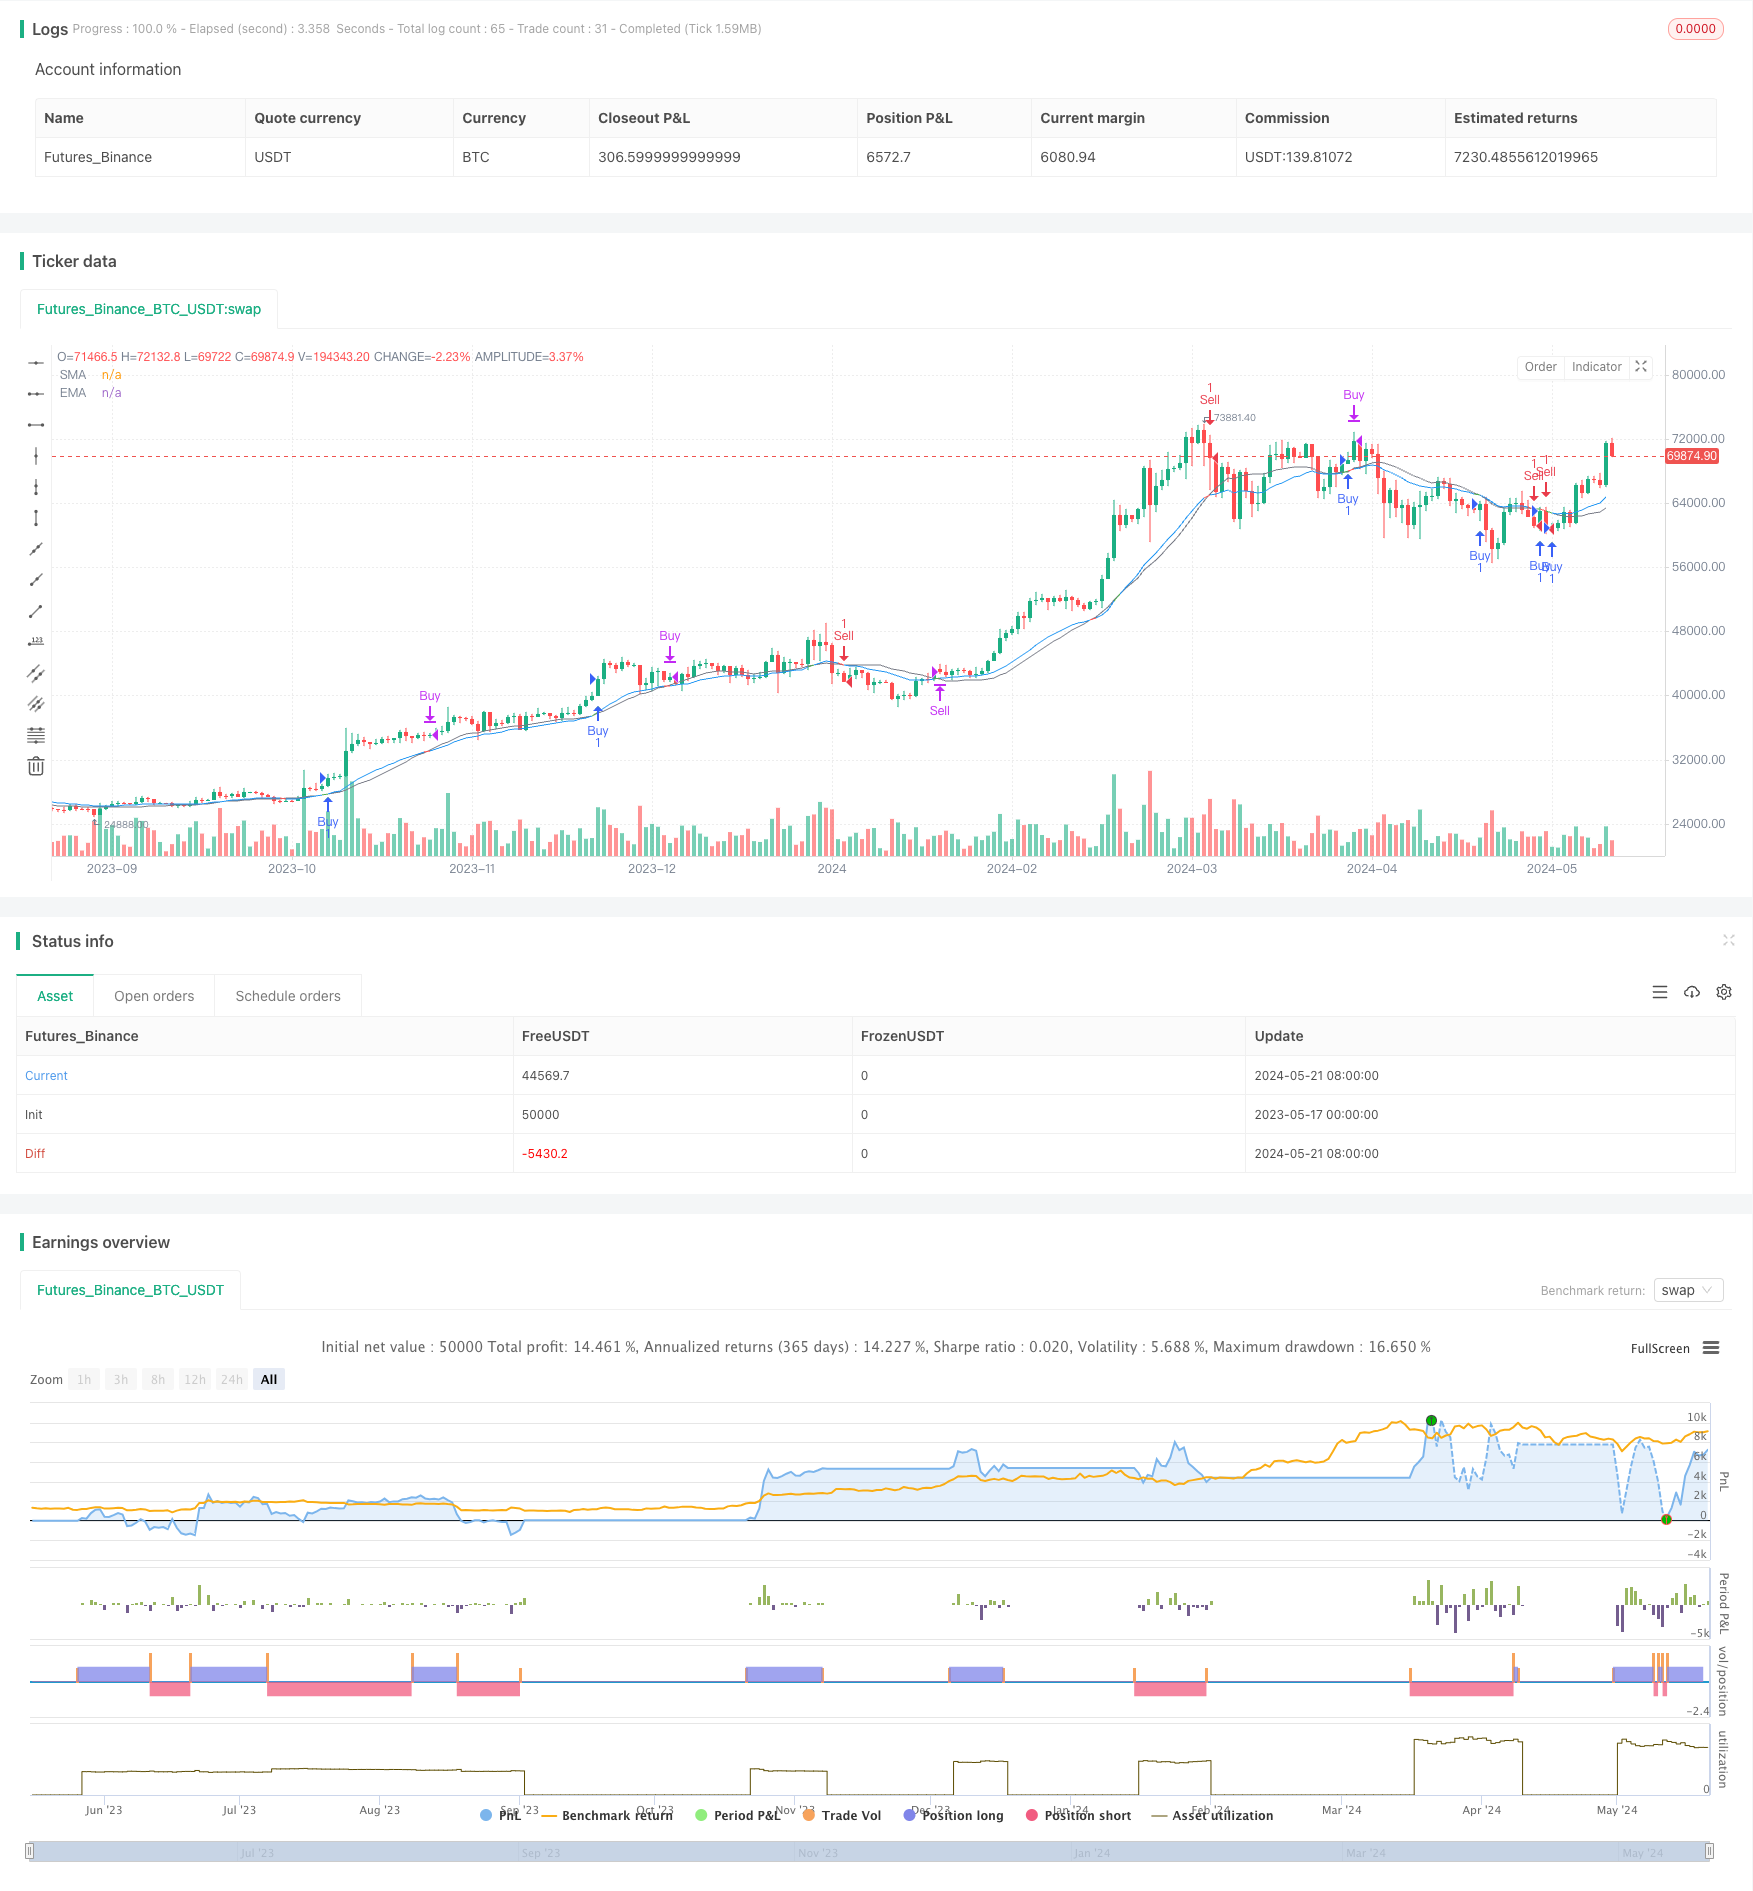
概述
该策略是一个基于EMA和SMA两条移动平均线的交叉策略。当较慢的EMA从下向上穿过较快的SMA时,产生买入信号;当较慢的EMA从上向下穿过较快的SMA时,产生卖出信号。该策略旨在捕捉牛市中的上涨趋势,同时提供一定的支撑。
策略原理
该策略使用两条移动平均线:20周期的SMA和21周期的EMA。当EMA从下向上穿过SMA时,表明市场可能正在转向上涨趋势,因此产生买入信号。反之,当EMA从上向下穿过SMA时,表明市场可能正在转向下跌趋势,因此产生卖出信号。为了确认信号,该策略还要求当前收盘价高于前一个收盘价(买入信号)或低于前一个收盘价(卖出信号)。
优势分析
- 简单易懂:该策略基于两条常用的移动平均线,原理简单,易于理解和实现。
- 趋势跟踪:通过移动平均线的交叉,该策略能够较好地捕捉市场的趋势变化,特别是在牛市中的上涨趋势。
- 支撑作用:较慢的EMA可以作为一定的支撑位,在价格回撤时提供支撑。
风险分析
- 假信号:在市场波动较大或震荡行情中,该策略可能产生较多的假信号,导致频繁交易和高昂的交易成本。
- 滞后性:移动平均线具有一定的滞后性,可能导致错过最佳的入场和出场时机。
- 趋势识别:该策略对于趋势的识别能力有限,在市场转折点或趋势不明确时,可能表现不佳。
优化方向
- 结合其他指标:可以考虑结合其他技术指标,如RSI、MACD等,以提高信号的可靠性和准确性。
- 优化参数:可以通过优化移动平均线的周期参数,以适应不同的市场状况和交易品种。
- 加入止损和止盈:为了控制风险和保护利润,可以在策略中加入合适的止损和止盈机制。
总结
均线交叉牛市支撑带策略是一个简单易懂的趋势跟踪策略,特别适用于牛市行情。然而,该策略也存在一定的局限性,如假信号、滞后性和趋势识别能力有限等。通过结合其他指标、优化参数和加入止损止盈等方法,可以进一步提高该策略的表现和稳健性。
策略源码
/*backtest
start: 2023-05-17 00:00:00
end: 2024-05-22 00:00:00
period: 1d
basePeriod: 1h
exchanges: [{"eid":"Futures_Binance","currency":"BTC_USDT"}]
*/

// This source code is subject to the terms of the Mozilla Public License 2.0 at https://mozilla.org/MPL/2.0/
// © rodrinverte

//@version=5
strategy("EMA-SMA Crossover Strategy", overlay=true, initial_capital = 1000)

// Definir la longitud de las medias móviles
fast = ta.sma(close, 20)
slow = ta.ema(close, 21)

// Definir condiciones de compra y venta
buySignal = ta.crossover(slow, fast)
sellSignal = ta.crossunder(slow, fast)

// Configurar colores de las líneas y relleno
emaColor = buySignal ? color.green : sellSignal ? color.red : color.blue
smaColor = color.gray
fillColor = slow < fast ? color.new(color.green, 90) : color.new(color.red, 90)

// Esperar un periodo para confirmar la señal de compra o venta
buyConfirmation = close > close[1] and buySignal
sellConfirmation = close < close[1] and sellSignal

// Dibujar las medias móviles
plot(slow, title="EMA", color=emaColor)
plot(fast, title="SMA", color=smaColor)

// Configurar las señales de compra y venta
plotshape(buyConfirmation, style=shape.triangleup, location=location.belowbar, color=color.green, size=size.small)
plotshape(sellConfirmation, style=shape.triangledown, location=location.abovebar, color=color.red, size=size.small)

// Estrategia de compra y venta
if (buyConfirmation)
    strategy.entry("Buy", strategy.long)

if (sellConfirmation)
    strategy.entry("Sell", strategy.short)

// Cerrar posición opuesta al cruce original
if (sellSignal)
    strategy.close("Buy")

if (buySignal)
    strategy.close("Sell")
相关推荐