概述
动态趋势跟踪EMA交叉策略是一种结合了指数移动平均线(EMA)、支撑阻力位和趋势跟踪原理的量化交易策略。该策略主要利用短期和长期EMA的交叉来判断市场趋势,并结合高低点突破来寻找入场时机。策略还包含了止盈、止损和追踪止损等风险管理机制,旨在捕捉市场趋势并控制风险。
策略原理
趋势判断:使用55周期EMA和200周期EMA的相对位置来确定市场趋势。当55EMA位于200EMA之上时,判断为上升趋势;反之则为下降趋势。
入场信号:
- 多头入场:在上升趋势中,当价格突破自定义周期的最低价并同时突破55EMA时,触发买入信号。
- 空头入场:在下降趋势中,当价格跌破自定义周期的最高价并同时跌破55EMA时,触发卖出信号。
出场条件:
- 趋势反转:当市场趋势发生改变时,策略会平仓当前持仓。
- EMA交叉:当价格与55EMA发生反向交叉时,也会触发平仓信号。
风险管理:
- 设置固定止盈和止损:在开仓时就设定好预定的止盈和止损价位。
- 追踪止损:使用动态的追踪止损来保护已获得的利润。
策略优势
趋势跟踪:通过EMA交叉和高低点突破,策略能够有效捕捉市场趋势,提高盈利机会。
动态适应:使用EMA而非简单移动平均线(SMA),使得策略能更快地适应市场变化。
多重确认:结合趋势判断、价格突破和EMA交叉等多重条件,降低了虚假信号的可能性。
风险控制:内置的止盈、止损和追踪止损机制,有助于控制风险和锁定利润。
可视化辅助:策略在图表上标注了入场和出场信号,便于交易者直观理解和回测分析。
灵活性:通过输入参数,用户可以根据不同市场和个人偏好调整策略表现。
策略风险
震荡市场风险:在横盘或者震荡市场中,可能会频繁产生虚假信号,导致过度交易和亏损。
滞后性:EMA本质上是滞后指标,在剧烈波动的市场中可能会错过最佳入场或出场时机。
参数敏感性:策略性能高度依赖于EMA周期、高低点周期等参数的设置,不同市场可能需要不同的最优参数。
趋势反转风险:在强烈的趋势反转时,策略可能反应不够迅速,导致较大回撤。
过度依赖技术指标:策略未考虑基本面因素,在重大新闻或事件发生时可能会表现不佳。
策略优化方向
加入成交量指标:结合成交量分析可以提高信号的可靠性,特别是在判断趋势强度和潜在反转时。
引入波动率过滤:通过加入ATR(真实波幅)或Bollinger Bands等指标,可以帮助策略在高波动性环境中更好地表现。
优化止损机制:可以考虑使用基于波动率的动态止损,而不是固定点数的止损,以适应不同市场条件。
多时间框架分析:引入更长期的时间框架分析,可以提高趋势判断的准确性,减少假突破。
加入市场情绪指标:如RSI或MACD,可以帮助过滤掉一些潜在的虚假信号。
自适应参数:开发一种机制,使策略能够根据recent market conditions自动调整EMA周期和其他参数。
总结
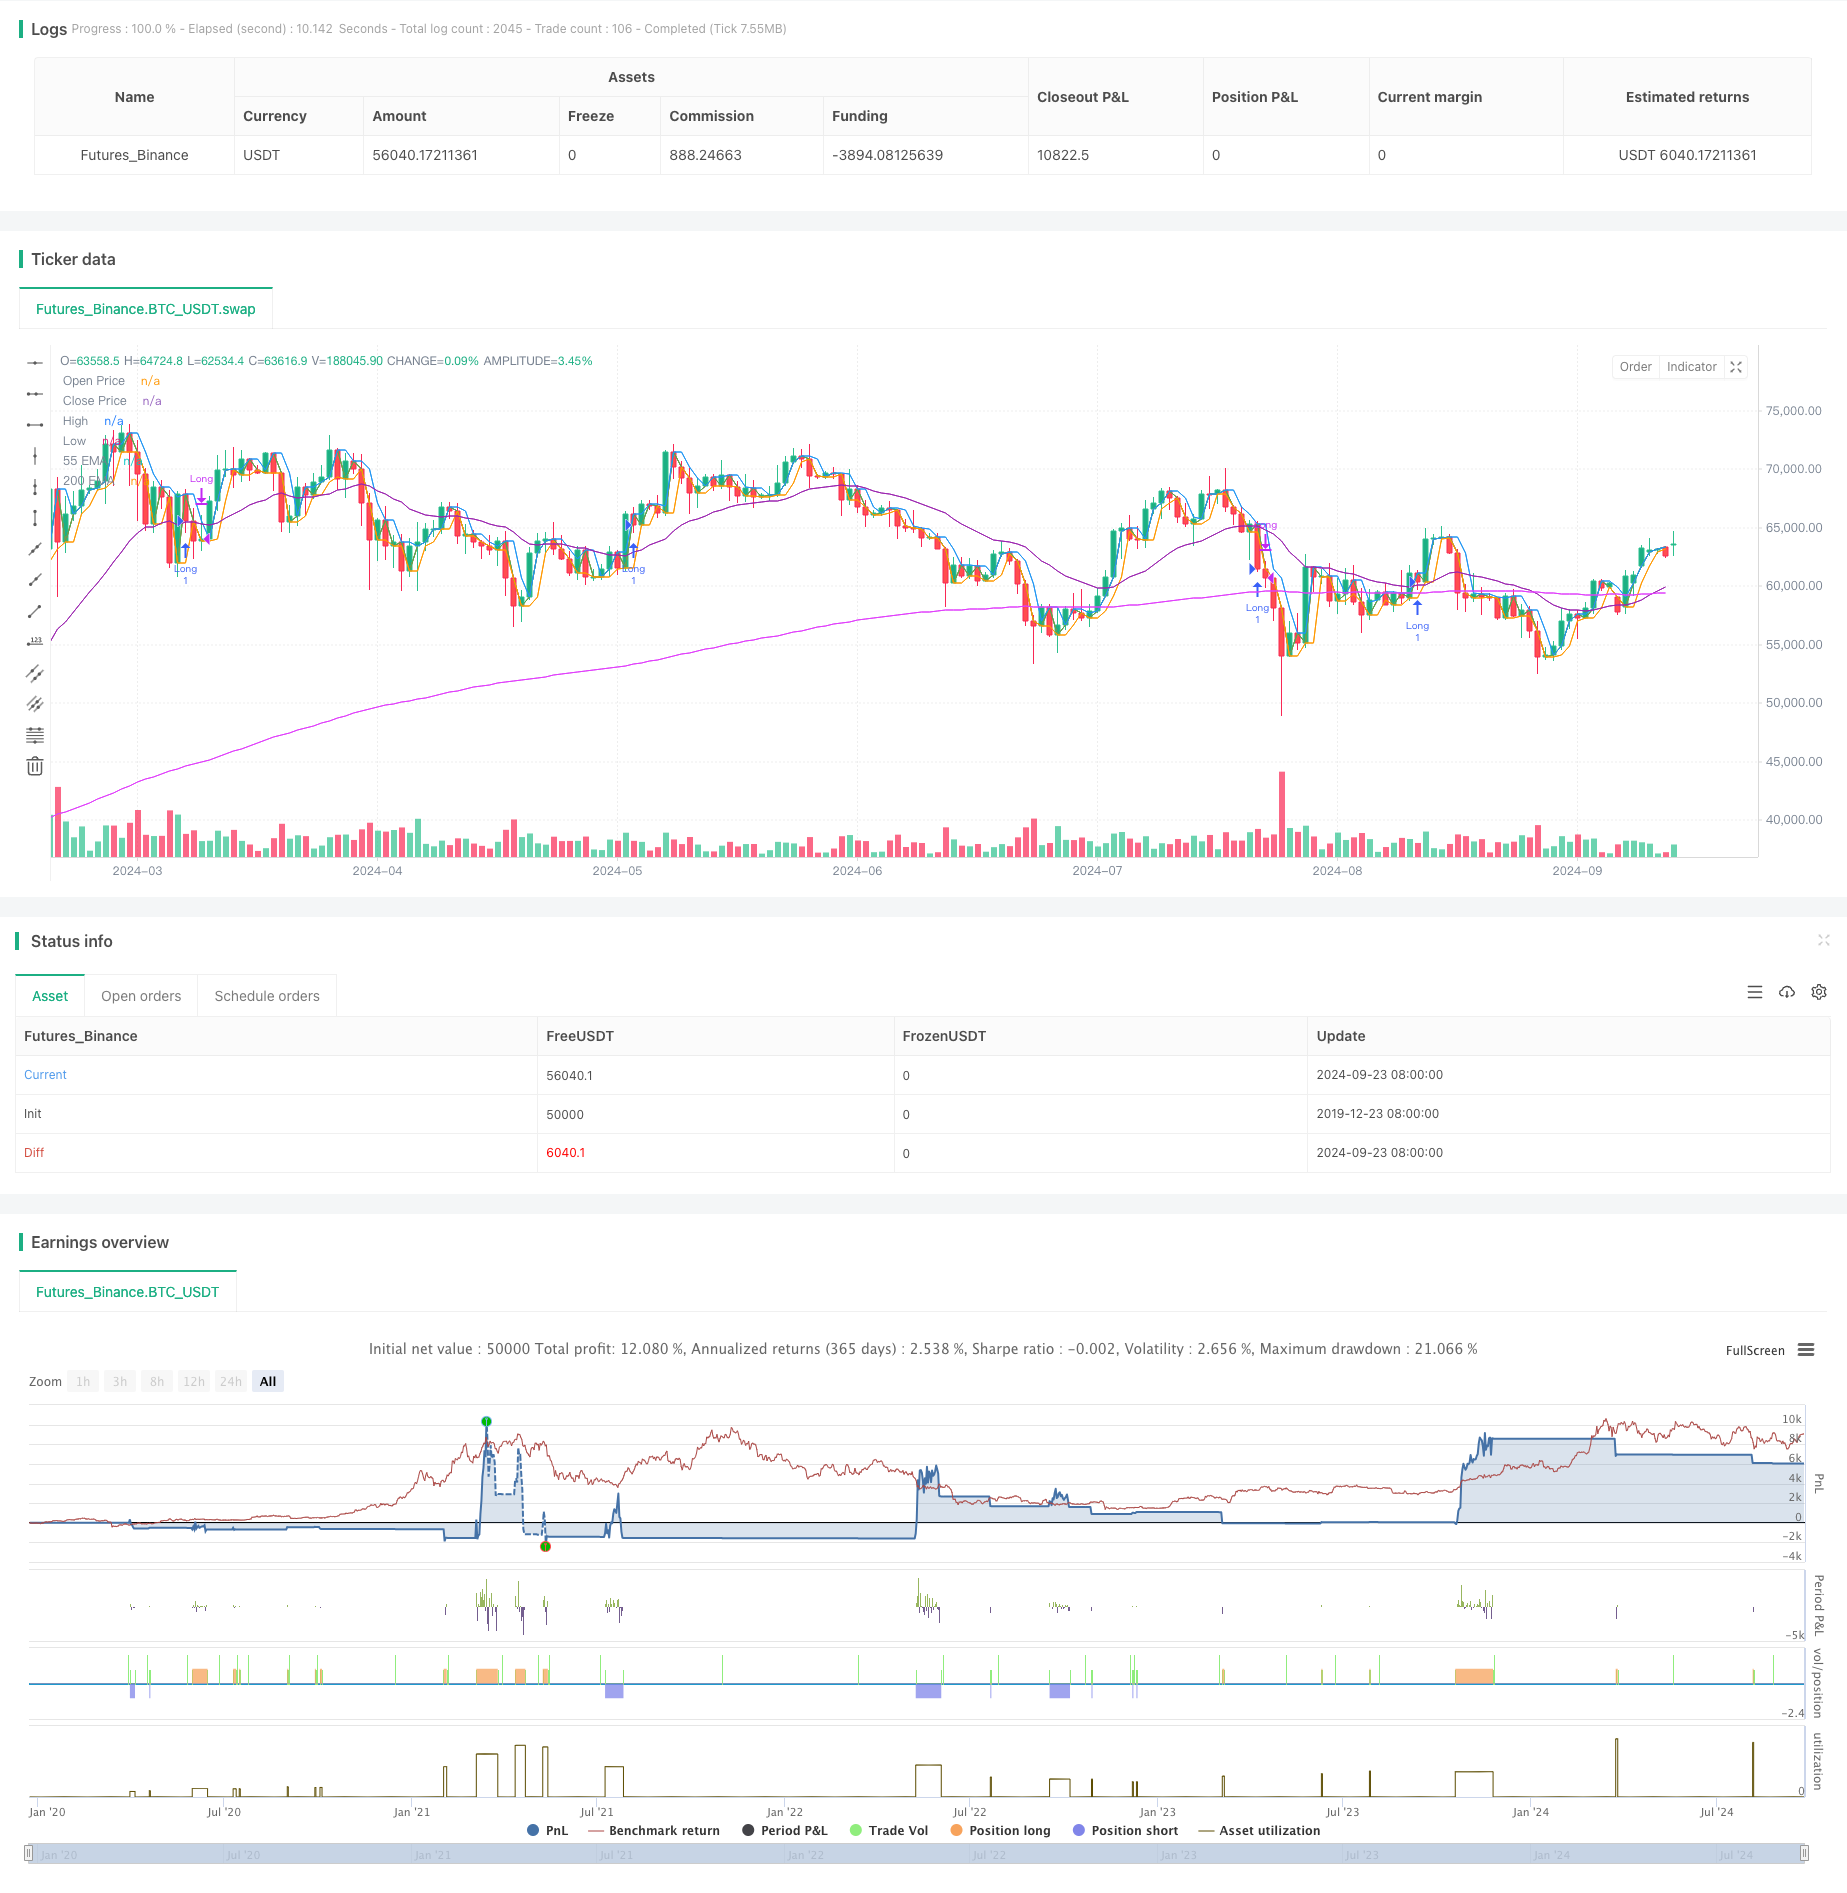
动态趋势跟踪EMA交叉策略是一个结合了多重技术指标的量化交易系统,通过EMA交叉和价格突破来捕捉市场趋势。该策略的优势在于其对趋势的敏感性和内置的风险管理机制,但同时也面临着震荡市场和参数优化的挑战。未来的优化方向可以集中在提高信号质量、增强适应性和引入更多维度的市场分析上。对于寻求中长期趋势交易机会的投资者来说,这是一个值得考虑的策略框架,但在实际应用中需要根据具体市场特征和个人风险偏好进行深入的回测和参数优化。
/*backtest
start: 2019-12-23 08:00:00
end: 2024-09-24 08:00:00
period: 1d
basePeriod: 1d
exchanges: [{"eid":"Futures_Binance","currency":"BTC_USDT"}]
*/

//@version=5
strategy("gucci 1.0 ", overlay=true)

// Input parameters
boxClose = input(true, title="Enable on Box Close")
timeframe = input.timeframe("1", title="Timeframe")
highLowPeriod = input.int(2, title="High/Low Period")
ema55Period = input.int(21, title="55 EMA Period")
ema200Period = input.int(200, title="200 EMA Period")
takeProfitTicks = input.int(55, title="Take Profit (in Ticks)")
stopLossTicks = input.int(30, title="Stop Loss (in Ticks)")
trailingStopTicks = input.int(25, title="Trailing Stop (in Ticks)")

// Security data
openPrice = request.security(syminfo.tickerid, timeframe, open)
closePrice = request.security(syminfo.tickerid, timeframe, close)

// Calculate high and low for the user-defined period
highCustomPeriod = ta.highest(closePrice, highLowPeriod)
lowCustomPeriod = ta.lowest(closePrice, highLowPeriod)

// Calculate customizable EMAs
ema55 = ta.ema(closePrice, ema55Period)
ema200 = ta.ema(closePrice, ema200Period)

// Plotting the open, close, high/low, and EMAs for reference
plot(openPrice, color=color.red, title="Open Price")
plot(closePrice, color=color.green, title="Close Price")
plot(highCustomPeriod, color=color.blue, title="High", linewidth=1)
plot(lowCustomPeriod, color=color.orange, title="Low", linewidth=1)
plot(ema55, color=color.purple, title="55 EMA", linewidth=1)
plot(ema200, color=color.fuchsia, title="200 EMA", linewidth=1)

// Determine trend direction
bullishTrend = ema55 > ema200
bearishTrend = ema55 < ema200

// Define entry conditions
longCondition = bullishTrend and ta.crossover(closePrice, lowCustomPeriod) and ta.crossover(closePrice, ema55)
shortCondition = bearishTrend and ta.crossunder(closePrice, highCustomPeriod) and ta.crossunder(closePrice, ema55)

// Entry conditions and auto take profit, stop loss, and trailing stop
if (boxClose)
    if (longCondition)
        takeProfitPriceLong = closePrice + takeProfitTicks * syminfo.mintick
        stopLossPriceLong = closePrice - stopLossTicks * syminfo.mintick
        strategy.entry("Long", strategy.long)
        strategy.exit("Take Profit Long", "Long", limit=takeProfitPriceLong, stop=stopLossPriceLong, trail_offset=trailingStopTicks * syminfo.mintick)
        // Plot visual signal for long entry
        label.new(bar_index, closePrice, "Buy", color=color.green, textcolor=color.white, style=label.style_label_up, size=size.small)
        // Send alert for long entry
        alert("Long entry signal - price: " + str.tostring(closePrice), alert.freq_once_per_bar)

    if (shortCondition)
        takeProfitPriceShort = closePrice - takeProfitTicks * syminfo.mintick
        stopLossPriceShort = closePrice + stopLossTicks * syminfo.mintick
        strategy.entry("Short", strategy.short)
        strategy.exit("Take Profit Short", "Short", limit=takeProfitPriceShort, stop=stopLossPriceShort, trail_offset=trailingStopTicks * syminfo.mintick)
        // Plot visual signal for short entry
        label.new(bar_index, closePrice, "Sell", color=color.red, textcolor=color.white, style=label.style_label_down, size=size.small)
        // Send alert for short entry
        alert("Short entry signal - price: " + str.tostring(closePrice), alert.freq_once_per_bar)

// Optional: Define exit conditions
longExitCondition = bearishTrend or ta.crossunder(closePrice, ema55)
shortExitCondition = bullishTrend or ta.crossover(closePrice, ema55)

if (longExitCondition)
    strategy.close("Long")
    // Plot visual signal for long exit
    label.new(bar_index, closePrice, "Sell Exit", color=color.red, textcolor=color.white, style=label.style_label_down, size=size.small)
    // Send alert for long exit
    alert("Long exit signal - price: " + str.tostring(closePrice), alert.freq_once_per_bar)

if (shortExitCondition)
    strategy.close("Short")
    // Plot visual signal for short exit
    label.new(bar_index, closePrice, "Buy Exit", color=color.green, textcolor=color.white, style=label.style_label_up, size=size.small)
    // Send alert for short exit
    alert("Short exit signal - price: " + str.tostring(closePrice), alert.freq_once_per_bar)