概述
该策略使用线性回归的斜率来识别不同的市场状态(看涨或看跌)。通过计算一段时间内收盘价的线性回归斜率,可以衡量市场趋势的方向和强度。当斜率大于某个阈值时,市场被认为是看涨的,策略进入多头仓位;当斜率小于负阈值时,市场被认为是看跌的,策略进入空头仓位。当价格穿过简单移动平均线(SMA)时,策略平仓,表明可能出现反转或趋势变化。
策略原理
该策略的核心原理是使用线性回归的斜率来识别市场状态。通过对一段时间内的收盘价进行线性回归,可以得到一条最佳拟合直线。这条直线的斜率反映了价格在该时间段内的总体趋势方向和强度。正斜率表明价格呈上升趋势,斜率越大,上升趋势越强;负斜率表明价格呈下降趋势,斜率越小,下降趋势越强。通过设置斜率阈值,可以确定市场状态是看涨还是看跌,从而做出相应的交易决策。
策略优势
- 客观性:该策略基于数学计算得出的斜率值来判断市场状态,避免了主观判断的影响,提高了决策的客观性。
- 适应性:通过动态调整斜率阈值,该策略可以适应不同的市场状况和品种特性,具有良好的适应性。
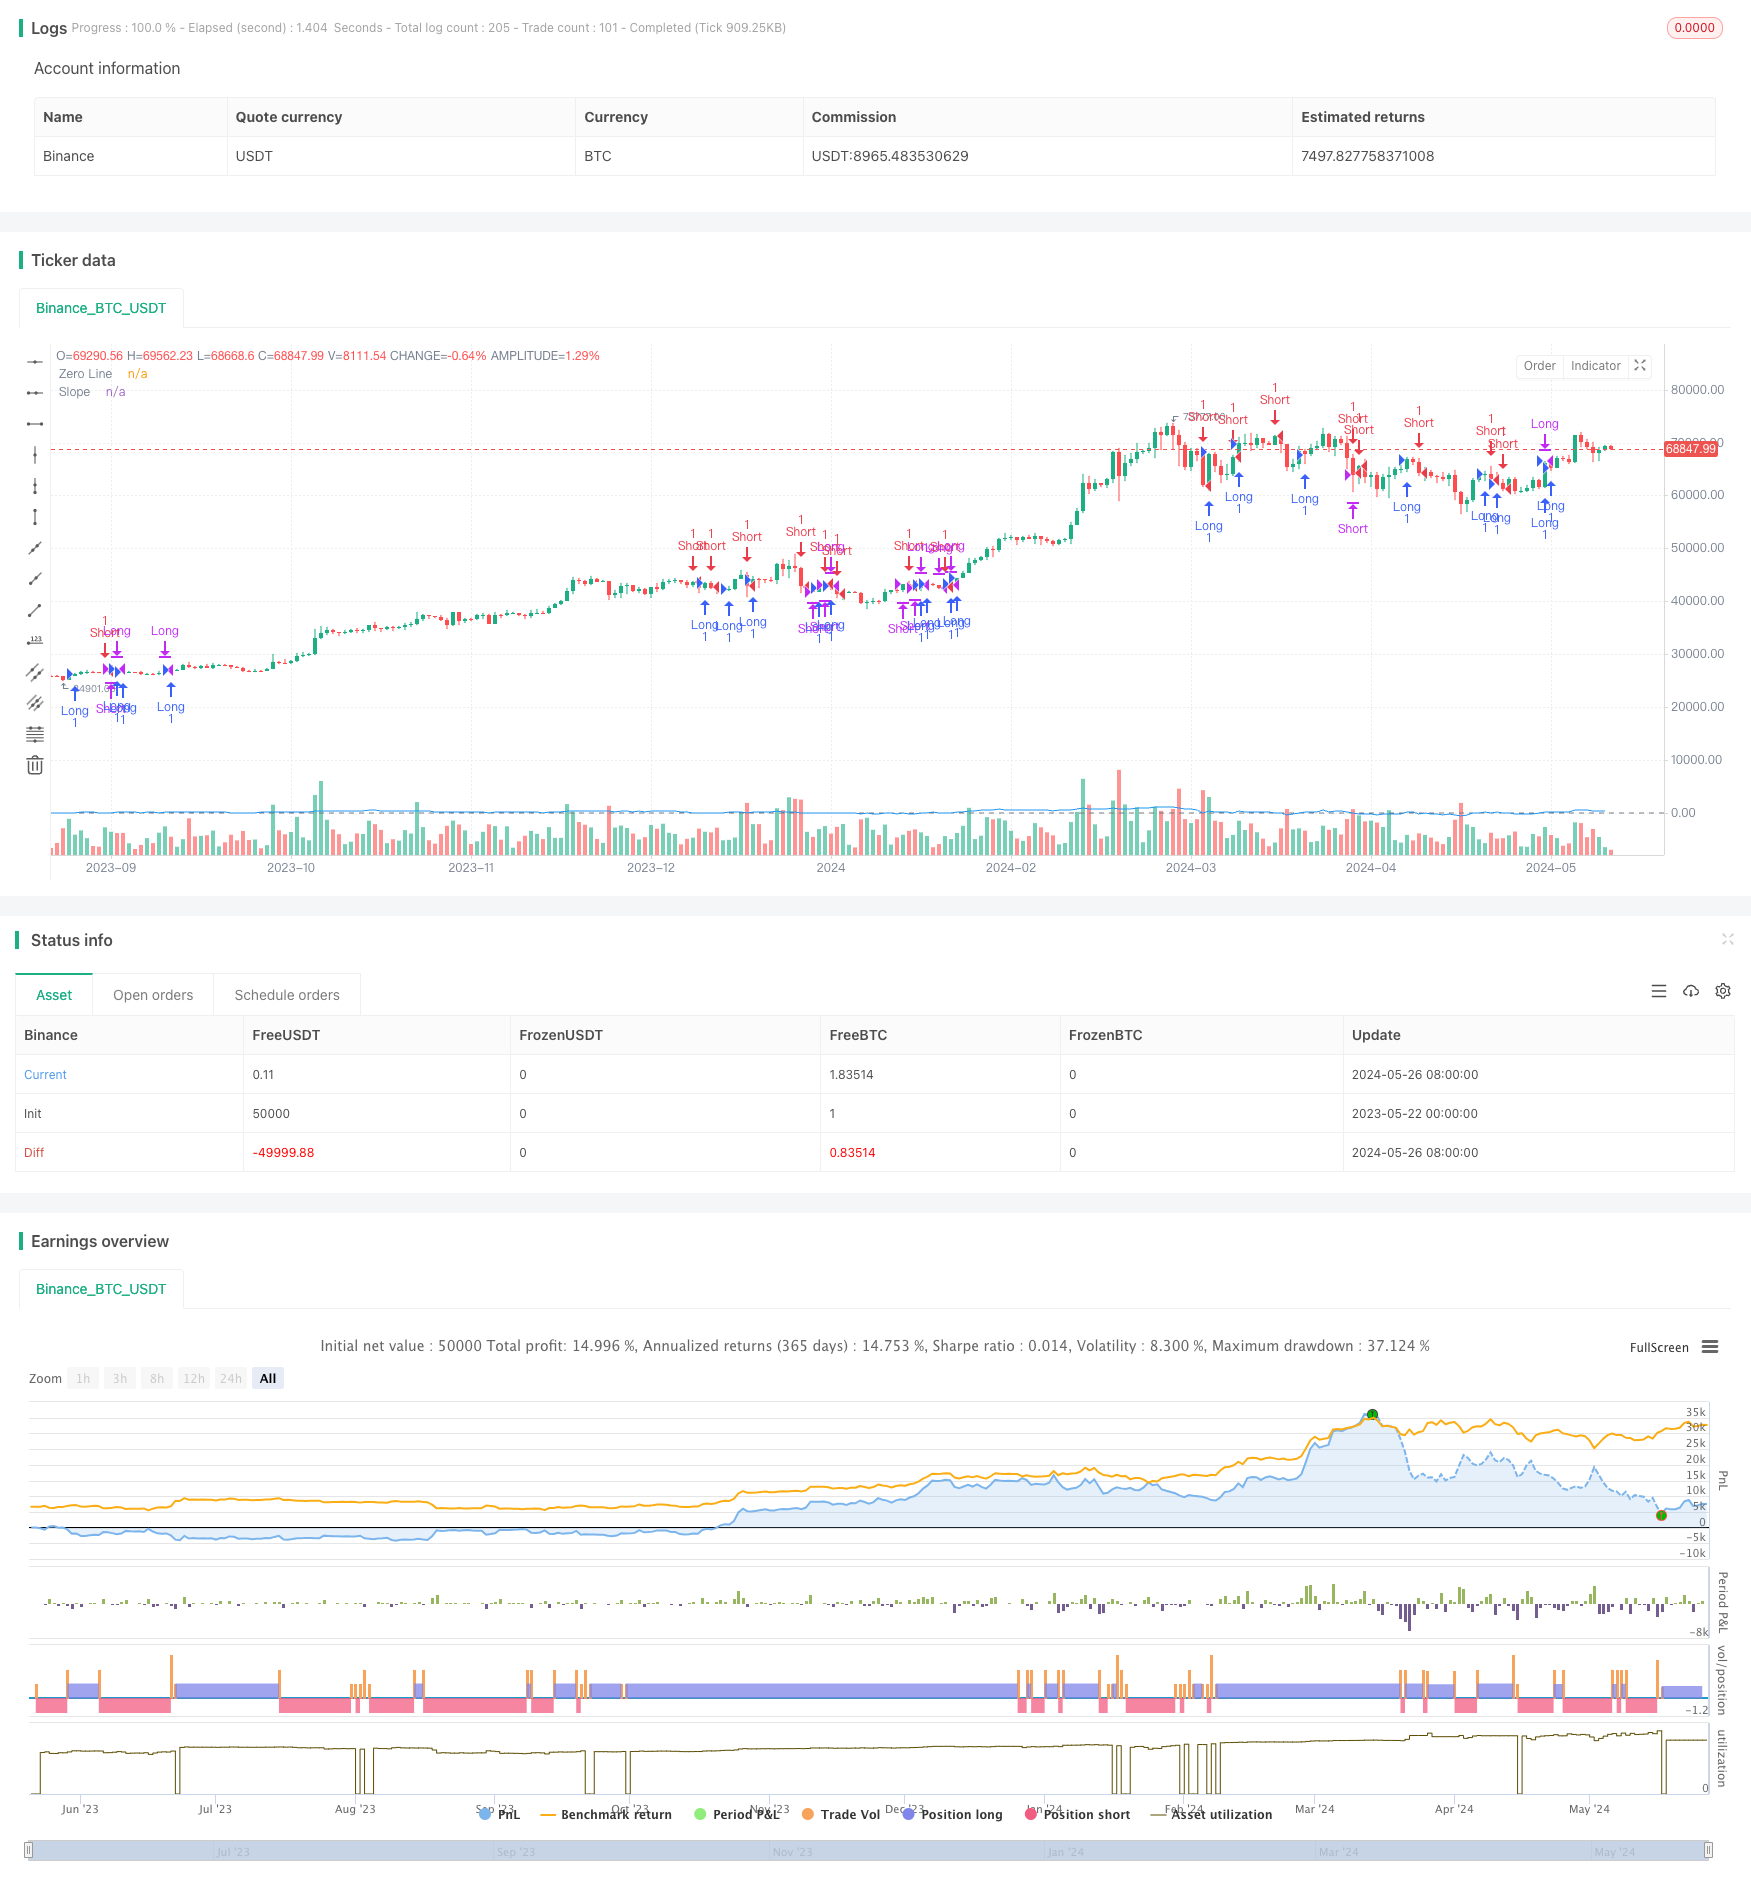
- 趋势捕捉:该策略能够有效捕捉市场的主要趋势,在趋势明确时获得较好的收益。
- 简单易用:策略逻辑清晰,计算简单,易于理解和实现。
策略风险
- 震荡市:在震荡市场中,价格频繁波动,趋势不明确,该策略可能会出现频繁的交易信号,导致高额交易成本和潜在损失。
- 参数敏感:该策略的表现依赖于斜率长度、SMA长度和斜率阈值等参数的选择,不同参数可能导致不同的结果,需要谨慎优化。
- 趋势转折:在趋势转折点附近,该策略可能会出现错误信号,导致潜在损失。
- 滞后性:由于该策略基于一段时间内的数据计算斜率,因此存在一定的滞后性,可能错过最佳的入场时机。
策略优化方向
- 参数优化:对斜率长度、SMA长度和斜率阈值等参数进行优化,以适应不同的市场状况和品种特性,提高策略的稳定性和盈利能力。
- 趋势过滤:引入其他趋势指标,如MACD、ADX等,对趋势进行二次确认,过滤掉震荡市中的假信号。
- 止损止盈:设置合理的止损和止盈位,控制单笔交易的风险和收益,提高策略的风险收益比。
- 多时间框架分析:结合不同时间框架的斜率信号,如日线和4小时线,对趋势进行更全面的判断,提高决策的准确性。
总结
基于线性回归斜率的动态市场状态识别策略通过计算价格的线性回归斜率来判断市场状态,进而做出相应的交易决策。该策略逻辑清晰,计算简单,能够有效捕捉市场主要趋势。但在震荡市中可能出现频繁交易,且对参数选择较为敏感。通过参数优化、趋势过滤、止损止盈和多时间框架分析等方法,可以进一步提高该策略的稳定性和盈利能力。
策略源码
/*backtest
start: 2023-05-22 00:00:00
end: 2024-05-27 00:00:00
period: 1d
basePeriod: 1h
exchanges: [{"eid":"Binance","currency":"BTC_USDT"}]
*/

// This Pine Script™ code is subject to the terms of the Mozilla Public License 2.0 at https://mozilla.org/MPL/2.0/
// © tmalvao
//@version=5
strategy("Minha estratégia", overlay=true, margin_long=100, margin_short=100)

// Função para calcular o slope (inclinação) com base na média móvel simples (SMA)
slope_length = input(20, title="Slope Length")
sma_length = input(50, title="SMA Length")
slope_threshold = input.float(0.1, title="Slope Threshold")

sma = ta.sma(close, sma_length)

// Calculando o slope (inclinação)
var float slope = na
if (not na(close[slope_length - 1]))
    slope := (close - close[slope_length]) / slope_length

// Identificação dos regimes de mercado com base no slope
bullish_market = slope > slope_threshold
bearish_market = slope < -slope_threshold

// Condições de entrada e saída para mercados bullish e bearish
if (bullish_market)
    strategy.entry("Long", strategy.long)

if (bearish_market)
    strategy.entry("Short", strategy.short)

// Saída das posições
exit_condition = ta.crossover(close, sma) or ta.crossunder(close, sma)
if (exit_condition)
    strategy.close("Long")
    strategy.close("Short")

// Exibir a inclinação em uma janela separada
slope_plot = plot(slope, title="Slope", color=color.blue)
hline(0, "Zero Line", color=color.gray)
相关推荐