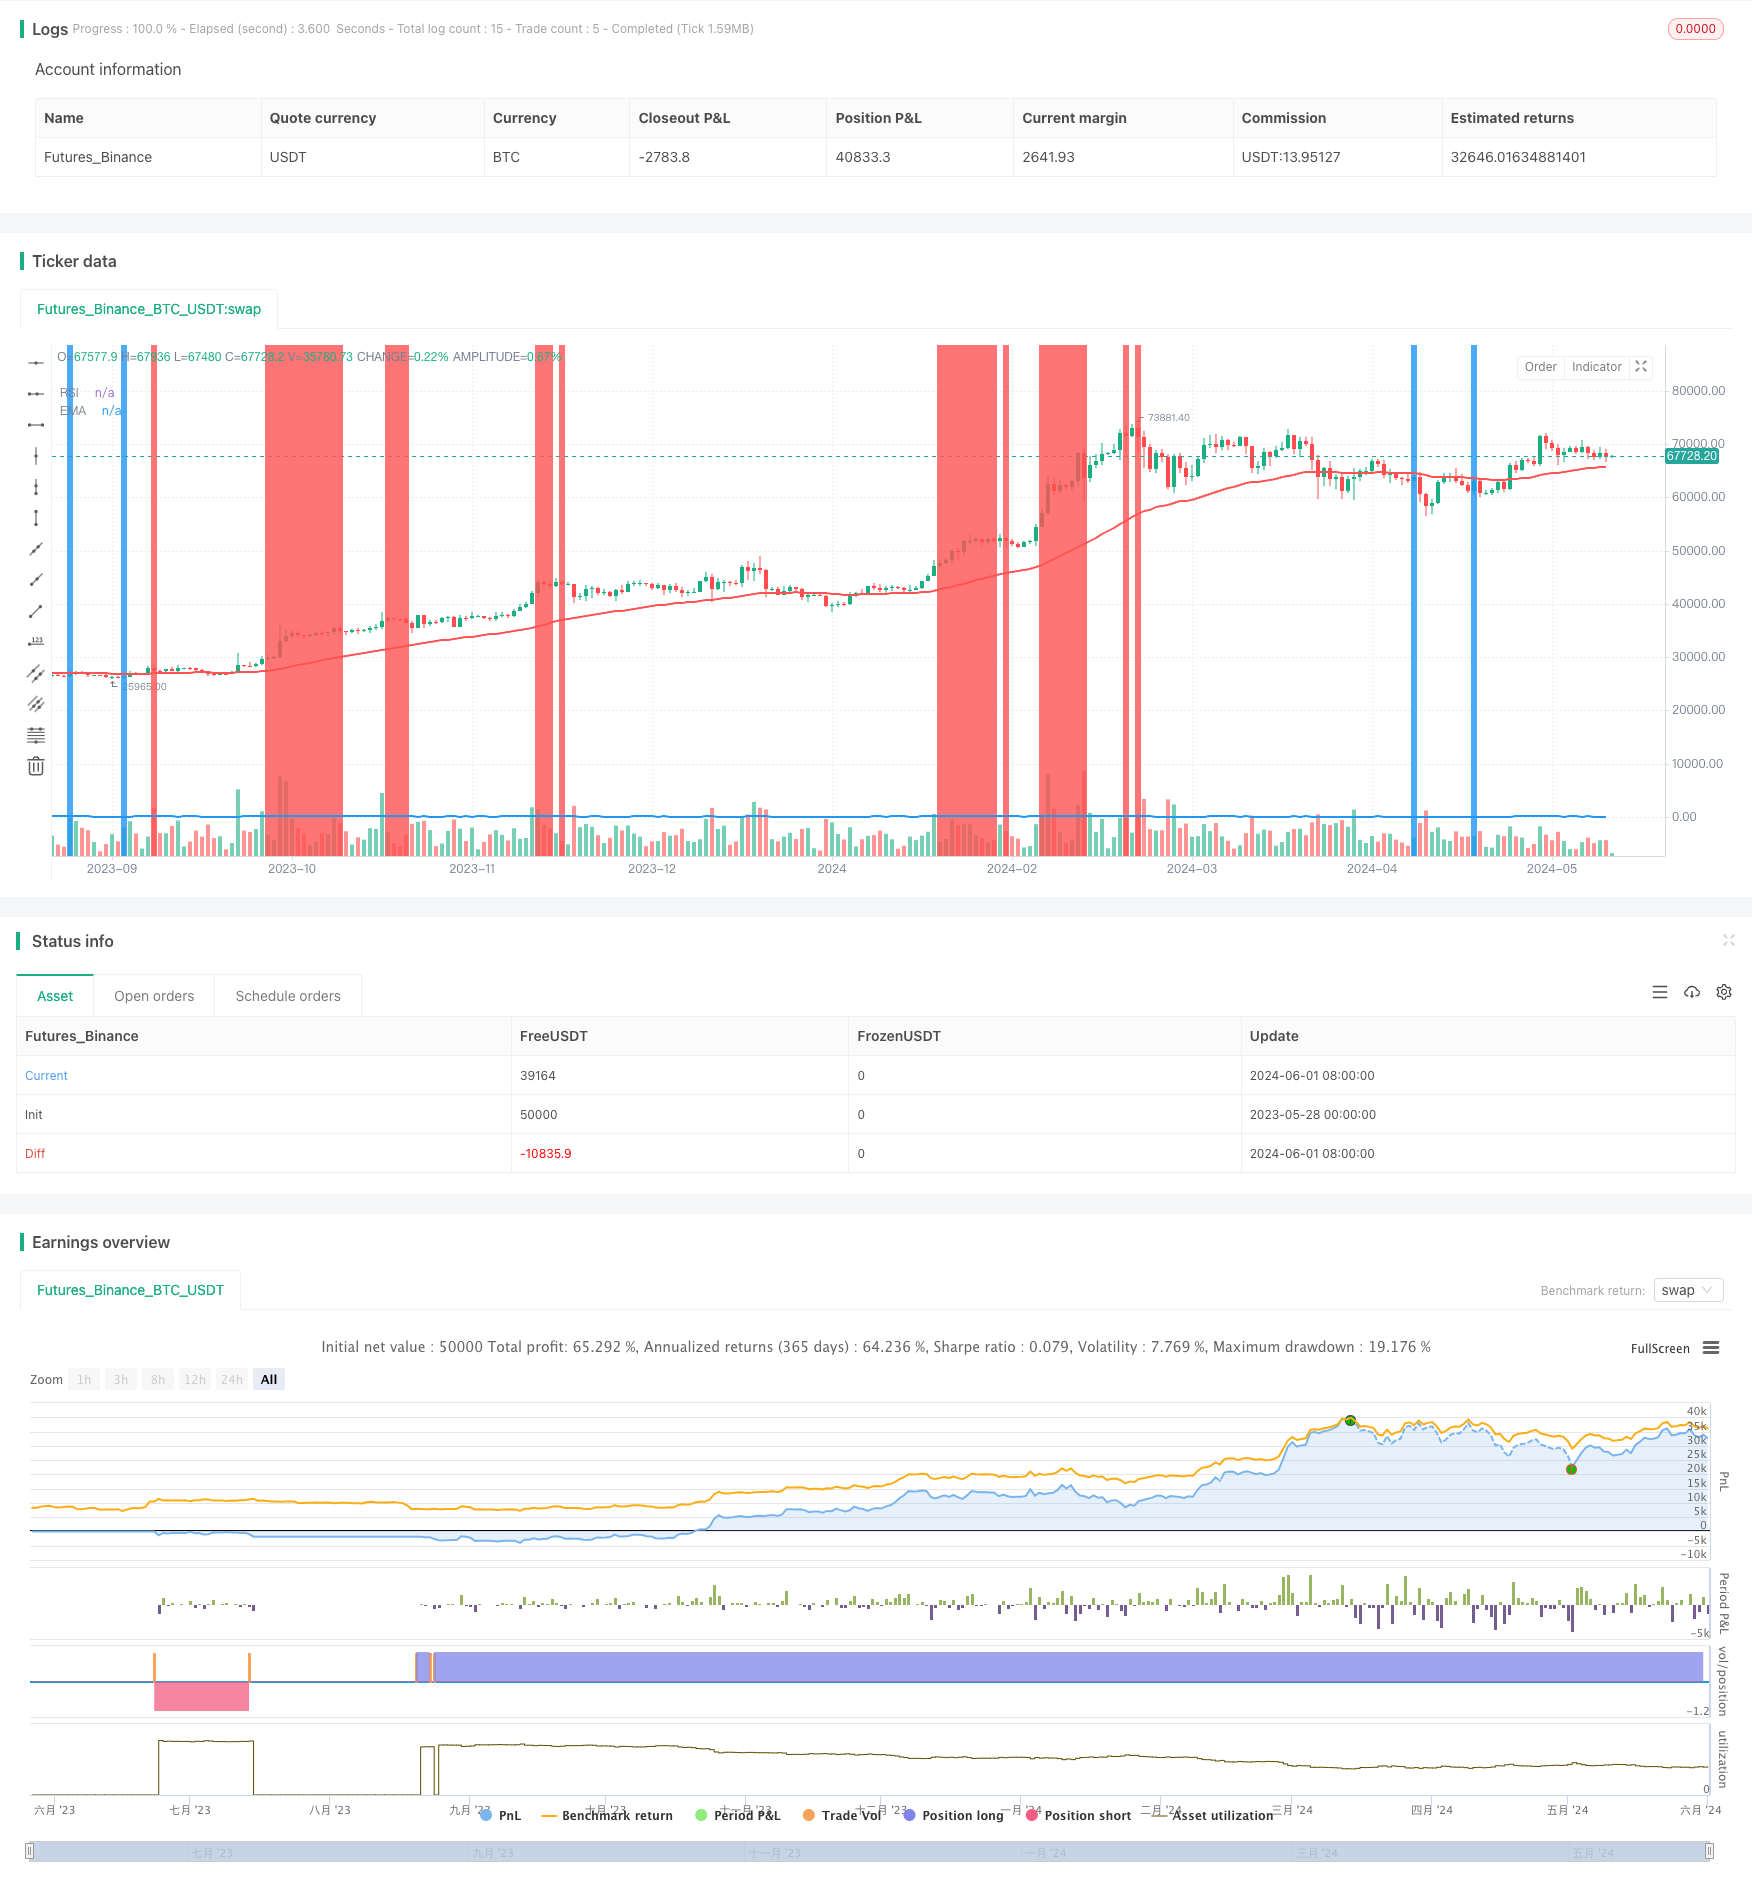
概述
EMA与RSI交叉策略通过结合指数移动平均线(EMA)和相对强弱指数(RSI)两个技术指标,来识别潜在的买入或卖出信号。当EMA和RSI出现交叉时,表明市场动量可能发生变化。例如,当较短周期的EMA上穿较长周期的EMA,同时RSI上穿某一阈值,就表明可能出现上升趋势,称为看涨交叉。反之,当较短周期的EMA下穿较长周期的EMA,同时RSI下穿某一阈值,就表明可能出现下降趋势,称为看跌交叉。交易者通常根据这些交叉信号进行入场或离场操作,以把握趋势和市场反转。
策略原理
- 计算指定周期的RSI指标值,并绘制在图表上。
- 计算指定周期的EMA指标值,并绘制在图表上。
- 当价格低于EMA且RSI小于20时,视为买入信号;当价格高于EMA且RSI大于80时,视为卖出信号。
- 当出现买入信号且当前蜡烛线收盘价高于前一根蜡烛线时,开仓做多;当出现卖出信号且当前蜡烛线收盘价低于前一根蜡烛线时,开仓做空。
- 使用平均真实波动幅度(ATR)计算止损和止盈价位。止损价位为开仓价格减去(ATR+蜡烛线实体长度),止盈价位为开仓价格加上(1.2*(ATR+蜡烛线实体长度))。
策略优势
- 结合了趋势跟踪指标EMA和动量指标RSI,能够更全面地判断市场走势。
- 在趋势形成初期即可发出交易信号,有助于尽早把握趋势机会。
- 使用ATR动态调整止损和止盈距离,可以更好地适应市场波动。
- 同时考虑了价格与指标的位置关系和蜡烛线的形态,提高了信号的可靠性。
策略风险
- EMA和RSI指标都有一定的滞后性,可能出现指标交叉而价格并未立即反转的情况,导致虚假信号。
- RSI指标在震荡市中频繁产生交叉信号,可能导致过度交易。
- 固定的RSI阈值可能不适用于所有市场状况,需要根据市场特点进行调整。
- 策略heavily依赖ATR计算止损和止盈,但ATR值可能受到价格突然大幅波动的影响而失真。
策略优化方向
- 对EMA和RSI的参数进行优化,找到最适合当前市场的参数组合。
- 在震荡市中加入其他过滤条件,如交易量变化、波动率等,以过滤掉频繁的虚假信号。
- 对RSI的上下阈值进行自适应调整,使其能够适应不同的市场状态。
- 采用多种止损和止盈方法,如基于支撑阻力位的止损止盈,或结合趋势方向的移动止损,以提高风险控制能力。
- 加入仓位管理模块,根据市场波动和账户风险状况动态调整每笔交易的仓位大小。
总结
EMA与RSI交叉策略是一个简单易用的趋势跟踪策略,通过结合趋势和动量两个维度的指标,可以比较全面地判断市场走向。同时,该策略采用了一些过滤条件和动态止损止盈方法,以提高信号质量和风险控制能力。但是,该策略也存在一些局限性,如指标滞后、频繁交易等问题。因此,在实际应用中,还需要根据具体市场特点和个人风险偏好,对策略进行进一步的优化和改进。
策略源码
/*backtest
start: 2023-05-28 00:00:00
end: 2024-06-02 00:00:00
period: 1d
basePeriod: 1h
exchanges: [{"eid":"Futures_Binance","currency":"BTC_USDT"}]
*/

// This Pine Script™ code is subject to the terms of the Mozilla Public License 2.0 at https://mozilla.org/MPL/2.0/
// © pritom980

//@version=5
strategy("EMA RSI Cross", overlay=true, margin_long=100, margin_short=100)

// add RSI

rsi_period = input.int(7,"RSI Period")
rsi_val =  ta.rsi(close[1],rsi_period)
plot(rsi_val, color=color.blue, linewidth=2, title="RSI")

buyRsiFlag = rsi_val < 20
sellRsiFlag = rsi_val > 80

// add EMA
ema = ta.ema(close, 50)
plot(ema, color=color.red, linewidth=2, title="EMA")


// check buy

// buy when the price is below ema
buyFlag = ema > close ? true : false

// sell when the price is above ema
sellFlag = ema < close ? true : false


bgcolor(buyFlag and buyRsiFlag ? color.green : na )
bgcolor(sellFlag and sellRsiFlag ? color.red : na )


// Check if current candle's body is bigger than previous candle's body and of opposite color
is_body_bigger_long = math.abs(close - open) > math.abs(close[1] - open[1]) and close > open != close[1] > open[1]


greenCandle = close > close[1]
redCandle = close < close[1]
// Mark the candle
bgcolor(is_body_bigger_long and greenCandle and buyFlag  ? color.blue : na, transp=70)


// ENTRY ---------------------

// Input for ATR period
atr_length = input(14, title="ATR Length")

// Calculate ATR
atr_value = ta.atr(atr_length)

// Calculate stop loss and take profit levels
candleBody = math.abs(close-open)
slDist = atr_value + candleBody

stop_loss_long = close - slDist
take_profit_long = close + (1.2 * slDist)


stop_loss_short = high + slDist
take_profit_short = high - (1.2 * slDist)

// Entry and exit conditions
if (buyFlag and buyRsiFlag  and strategy.opentrades >= 0 and greenCandle)
    strategy.entry("Long", strategy.long)
    strategy.exit("Take Profit/Stop Loss", "Long", stop=stop_loss_long, limit=take_profit_long)

// Entry and exit conditions
if (sellFlag and sellRsiFlag   and strategy.opentrades <= 0 and redCandle)
    strategy.entry("Short", strategy.short)
    strategy.exit("Take Profit/Stop Loss", "Short", stop=stop_loss_short, limit=take_profit_short)
相关推荐