概述
该策略结合了移动平均线(MA)、相对强弱指数(RSI)和平均真实波幅(ATR)等技术分析工具,旨在捕捉市场的趋势性机会。策略通过双均线交叉来判断趋势方向,并利用RSI指标对交易信号进行动量过滤,同时采用ATR作为止损依据,以控制风险。
策略原理
该策略的核心是利用两条不同周期的移动平均线(快线和慢线)的交叉来判断市场趋势。当快线上穿慢线时,表明上升趋势,策略将产生做多信号;反之,当快线下穿慢线时,表明下降趋势,策略将产生做空信号。
为了提高交易信号的可靠性,策略引入了RSI指标作为动量过滤器。当RSI高于某一阈值(如50)时,才允许开多仓;当RSI低于该阈值时,才允许开空仓。这样可以避免在横盘市或动量不足时交易,提高信号质量。
此外,策略采用ATR作为止损依据,根据最近一段时间内价格的波动幅度来动态调整止损位,以适应不同的市场状态。这种自适应的止损方式可以在趋势不明朗时快速止损,控制回撤;在趋势强劲时给予更大的盈利空间,提高策略收益。
策略优势
- 趋势跟随:通过双均线交叉捕捉市场趋势,能够顺应市场主要方向,提高策略胜率。
- 动量过滤:利用RSI指标对交易信号进行二次确认,避免在动量不足时盲目入场,提高单笔交易质量。
- 自适应止损:根据ATR动态调整止损位,可以在不同市场状态下实现风险自适应,降低回撤,提高资金利用效率。
- 简单易用:策略逻辑清晰,参数较少,易于理解和实现,适合大多数投资者使用。
策略风险
- 震荡市风险:在走势反复震荡、趋势不明朗时,频繁的交叉可能导致策略产生较多的交易信号,引发频繁交易和资金快速损耗。
- 参数风险:策略的表现对参数设置较为敏感,不同参数可能带来完全不同的结果。如果参数选择不当,可能导致策略失效。
- 趋势突变风险:当市场突然出现剧烈变化、趋势急转直下时,策略可能来不及止损而遭受较大损失。
- 整体风险:该策略虽然加入了动量过滤,但整体上仍是一个趋势策略,在市场长期震荡、趋势不明显时可能面临系统性风险。
策略优化方向
- 趋势强度识别:在趋势判断的基础上,可以进一步引入趋势强度指标(如ADX),避免在弱趋势下频繁交易,提高趋势把握的精准度。
- 多空动量区分:现有策略对多空信号采取了同样的动量过滤方式,可以考虑对多头和空头分别设置不同的RSI阈值,更好地适应多空趋势的不对称性。
- 止损优化:在ATR止损的基础上,可以结合其他止损方式(如百分比止损、支撑/阻力位止损等),构建多元化止损体系,进一步控制风险。
- 参数自适应:考虑引入参数优化或自适应算法,使策略参数能够根据市场状态的变化自动调整,提高策略的适应性和稳健性。
总结
该策略通过趋势跟随和动量过滤的有机结合,在捕捉市场趋势性机会的同时,较好地控制了风险。策略逻辑清晰,易于实现和优化。但在实际应用中,仍需注意震荡市风险和参数风险,并根据市场特点和自身需求,灵活调整和优化策略。总的来说,这是一个兼顾趋势把握和风险控制的balanced策略,值得进一步探索和实践。
策略源码
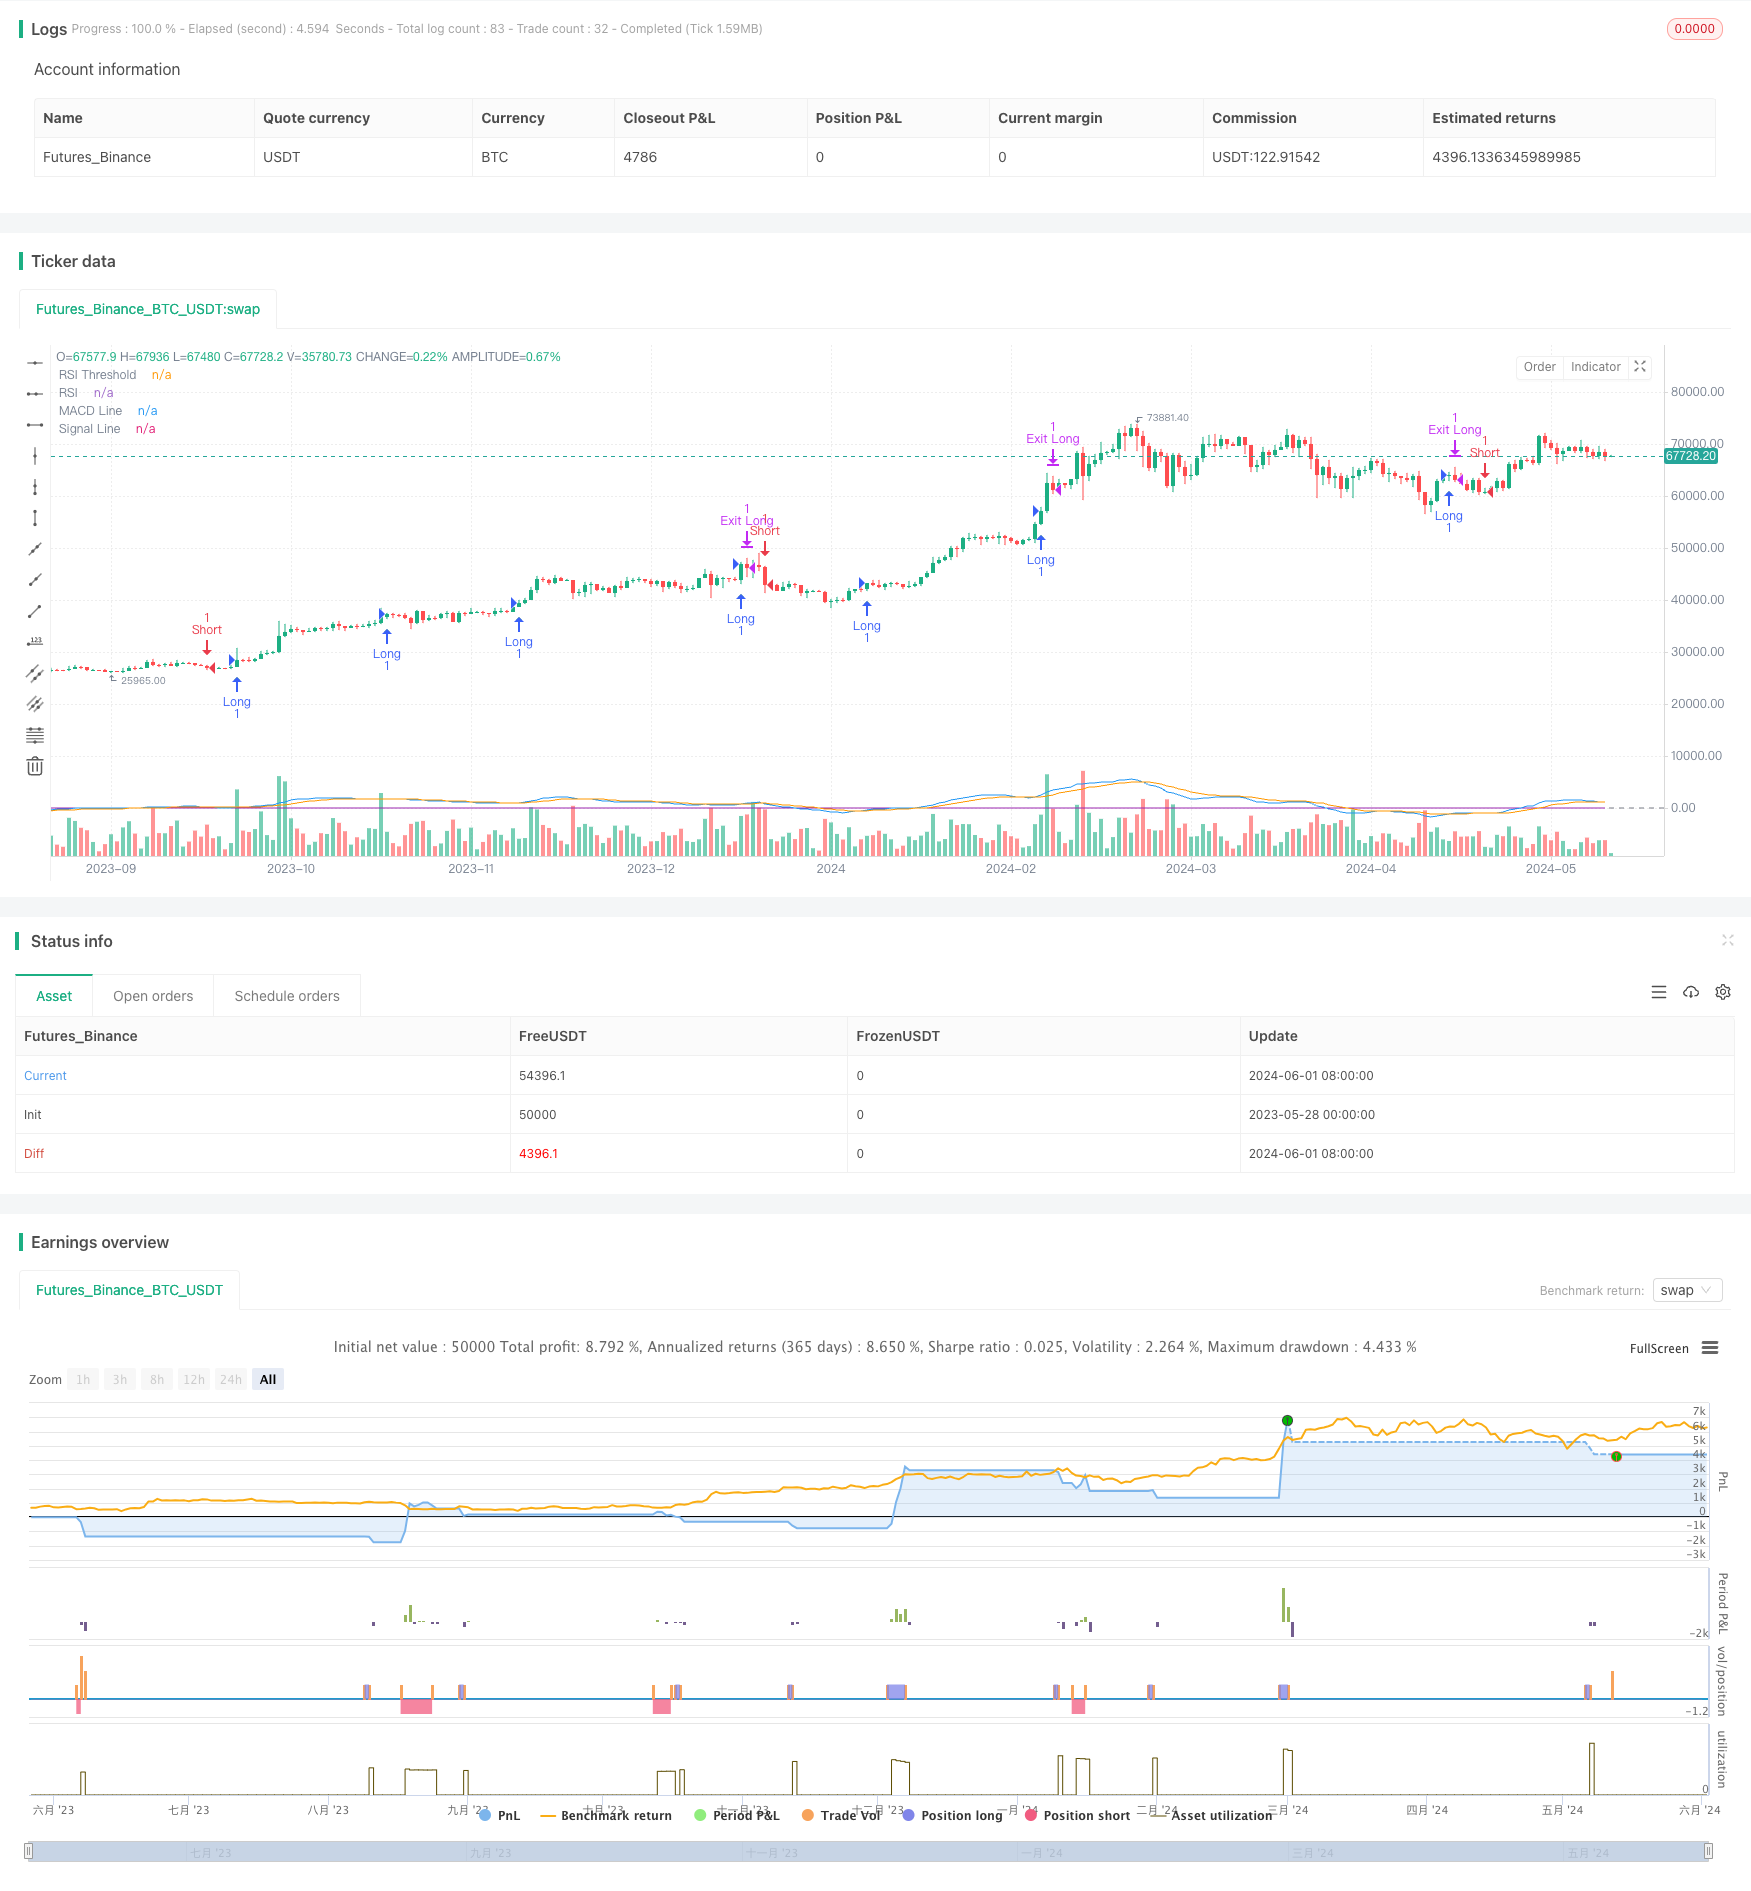
/*backtest
start: 2023-05-28 00:00:00
end: 2024-06-02 00:00:00
period: 1d
basePeriod: 1h
exchanges: [{"eid":"Futures_Binance","currency":"BTC_USDT"}]
*/

//@version=5
strategy("Trend-Following Strategy with MACD and RSI Filter", overlay=true)

// Input variables
fastLength = input(12, title="Fast MA Length")
slowLength = input(26, title="Slow MA Length")
signalLength = input(9, title="Signal Line Length")
stopLossPct = input(1.0, title="Stop Loss %") / 100
rsiLength = input(14, title="RSI Length")
rsiThreshold = input(50, title="RSI Threshold")

// Moving averages
fastMA = ta.sma(close, fastLength)
slowMA = ta.sma(close, slowLength)

// MACD
[macdLine, signalLine, _] = ta.macd(close, fastLength, slowLength, signalLength)

// RSI
rsi = ta.rsi(close, rsiLength)

// Entry conditions with RSI filter
bullishSignal = ta.crossover(macdLine, signalLine) and rsi > rsiThreshold
bearishSignal = ta.crossunder(macdLine, signalLine) and rsi < rsiThreshold

// Calculate stop loss levels
longStopLoss = ta.highest(close, 10)[1] * (1 - stopLossPct)
shortStopLoss = ta.lowest(close, 10)[1] * (1 + stopLossPct)

// Execute trades
strategy.entry("Long", strategy.long, when=bullishSignal)
strategy.entry("Short", strategy.short, when=bearishSignal)
strategy.exit("Exit Long", "Long", stop=longStopLoss)
strategy.exit("Exit Short", "Short", stop=shortStopLoss)

// Plotting signals
plotshape(bullishSignal, style=shape.triangleup, location=location.belowbar, color=color.green, size=size.small, title="Bullish Signal")
plotshape(bearishSignal, style=shape.triangledown, location=location.abovebar, color=color.red, size=size.small, title="Bearish Signal")

// Plot MACD
plot(macdLine, color=color.blue, title="MACD Line")
plot(signalLine, color=color.orange, title="Signal Line")

// Plot RSI
hline(rsiThreshold, "RSI Threshold", color=color.gray)
plot(rsi, color=color.purple, title="RSI")
相关推荐