概述
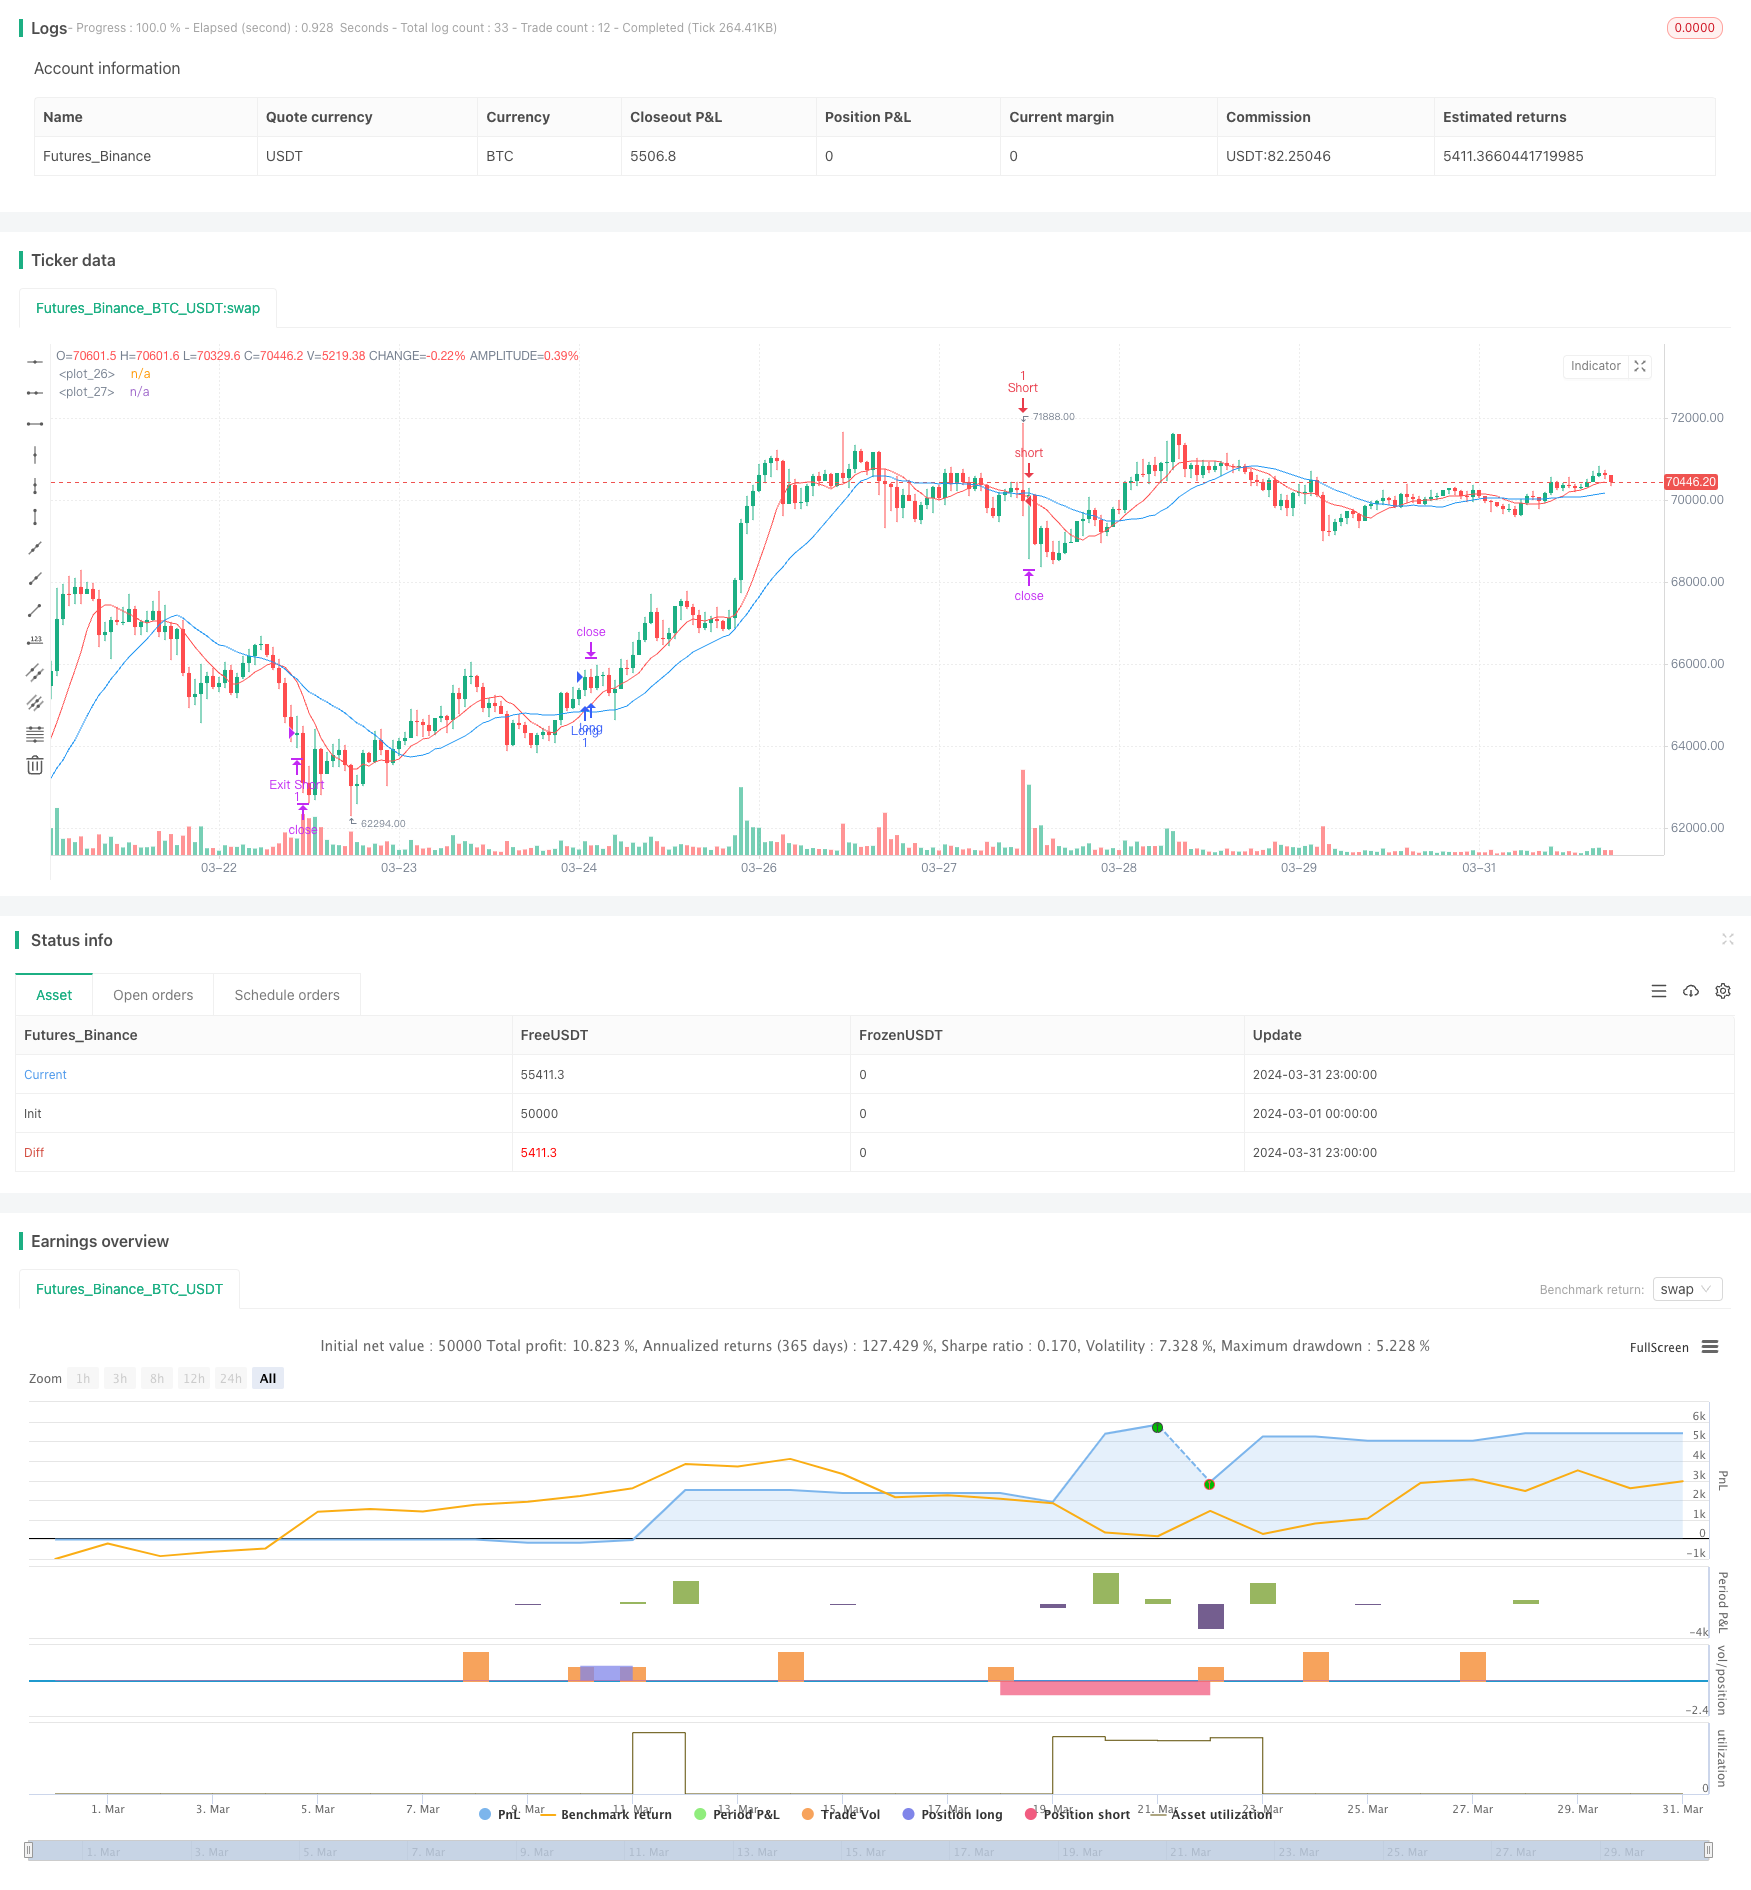
该策略名为”Jancok Strategycs v3”,是一个基于移动平均线(MA)、移动平均线收敛散度(MACD)、相对强弱指标(RSI)和平均真实范围(ATR)的多指标趋势追踪策略。该策略的主要思路是利用多个指标的组合来判断市场趋势,并在趋势方向上进行交易。同时,该策略还采用了动态止损和止盈方法,以及基于ATR的风险管理,以控制风险和优化收益。
策略原理
该策略使用了以下四个指标来判断市场趋势: 1. 移动平均线(MA):计算短期(9周期)和长期(21周期)的移动平均线,当短期均线上穿长期均线时,表明上升趋势;当短期均线下穿长期均线时,表明下降趋势。 2. 移动平均线收敛散度(MACD):计算MACD线和信号线,当MACD线上穿信号线时,表明上升趋势;当MACD线下穿信号线时,表明下降趋势。 3. 相对强弱指标(RSI):计算14周期的RSI,当RSI大于70时,表明市场可能超买;当RSI小于30时,表明市场可能超卖。 4. 平均真实范围(ATR):计算14周期的ATR,用于衡量市场波动性和设置止损止盈点。
该策略的交易逻辑如下: - 当短期均线上穿长期均线,MACD线上穿信号线,成交量大于其移动平均线,且波动率低于阈值时,开多单。 - 当短期均线下穿长期均线,MACD线下穿信号线,成交量大于其移动平均线,且波动率低于阈值时,开空单。 - 止损和止盈点根据ATR动态设置,止损点为ATR的2倍,止盈点为ATR的4倍。 - 可选择使用基于ATR的跟踪止损,跟踪止损点为ATR的2.5倍。
策略优势
- 多指标组合判断趋势,提高趋势判断的准确性。
- 动态止损和止盈,根据市场波动性自适应调整,更好地控制风险和优化收益。
- 引入成交量和波动率过滤,避免在低流动性和高波动时交易,减少虚假信号。
- 可选择跟踪止损,在趋势持续时保留更多利润。
策略风险
- 在震荡市或趋势转折时,可能产生虚假信号,导致亏损。
- 参数设置对策略性能影响较大,需要根据不同市场和资产进行优化。
- 过度优化参数可能导致过拟合,在实际交易中表现不佳。
- 市场异常波动或黑天鹅事件发生时,策略可能承受较大损失。
策略优化方向
- 引入更多指标,如布林带、随机指标等,进一步提高趋势判断准确性。
- 优化参数选择,如使用遗传算法、网格搜索等方法,找到最优参数组合。
- 针对不同市场和资产,设置不同的参数和规则,提高策略的适应性。
- 加入仓位管理,根据市场趋势强度和账户风险,动态调整仓位大小。
- 设置最大回撤限制,当账户达到最大回撤时,暂停交易或减小仓位,控制风险。
总结
“Jancok Strategycs v3”是一个基于多指标组合的趋势追踪策略,通过移动平均线、MACD、RSI和ATR等指标来判断市场趋势,并采用动态止损止盈和跟踪止损等风险管理手段,以控制风险和优化收益。该策略的优势在于趋势判断准确性高,风险管理灵活,适应性强。但同时也存在一定的风险,如虚假信号、参数设置敏感性和黑天鹅事件等。未来可以通过引入更多指标、优化参数选择、加入仓位管理和设置最大回撤限制等方式,进一步提升策略的性能和稳定性。
/*backtest
start: 2024-03-01 00:00:00
end: 2024-03-31 23:59:59
period: 1h
basePeriod: 15m
exchanges: [{"eid":"Futures_Binance","currency":"BTC_USDT"}]
*/

// This Pine Script™ code is subject to the terms of the Mozilla Public License 2.0 at https://mozilla.org/MPL/2.0/
// © financialAccou42381

//@version=5
strategy("Jancok Strategycs v3", overlay=true, initial_capital=100, currency="USD")

// Inputs
short_ma_length = input.int(9, title="Short MA Length", minval=1)
long_ma_length = input.int(21, title="Long MA Length", minval=1)
atr_multiplier_for_sl = input.float(2, title="ATR Multiplier for Stop Loss", minval=1.0)
atr_multiplier_for_tp = input.float(4, title="ATR Multiplier for Take Profit", minval=1.0)
volume_ma_length = input.int(20, title="Volume MA Length", minval=1)
volatility_threshold = input.float(1.5, title="Volatility Threshold", minval=0.1, step=0.1)
use_trailing_stop = input.bool(false, title="Use Trailing Stop")
trailing_stop_atr_multiplier = input.float(2.5, title="Trailing Stop ATR Multiplier", minval=1.0)

// Calculating indicators
short_ma = ta.sma(close, short_ma_length)
long_ma = ta.sma(close, long_ma_length)
[macdLine, signalLine, _] = ta.macd(close, 12, 26, 9)
atr = ta.atr(14)
volume_ma = ta.sma(volume, volume_ma_length)
volatility = atr / close

// Plotting indicators
plot(short_ma, color=color.red)
plot(long_ma, color=color.blue)

// Defining entry conditions with added indicators and filters
long_condition = ta.crossover(short_ma, long_ma) and (macdLine > signalLine) and (volume > volume_ma) and (volatility < volatility_threshold)
short_condition = ta.crossunder(short_ma, long_ma) and (macdLine < signalLine) and (volume > volume_ma) and (volatility < volatility_threshold)

// Entering trades with dynamic stop loss and take profit based on ATR
if (long_condition)
    strategy.entry("Long", strategy.long)
    if use_trailing_stop
        strategy.exit("Exit Long", "Long", trail_points=atr * trailing_stop_atr_multiplier, trail_offset=atr * 0.5)
    else
        strategy.exit("Exit Long", "Long", loss=atr * atr_multiplier_for_sl, profit=atr * atr_multiplier_for_tp)

if (short_condition)
    strategy.entry("Short", strategy.short)
    if use_trailing_stop
        strategy.exit("Exit Short", "Short", trail_points=atr * trailing_stop_atr_multiplier, trail_offset=atr * 0.5)
    else
        strategy.exit("Exit Short", "Short", loss=atr * atr_multiplier_for_sl, profit=atr * atr_multiplier_for_tp)