概述
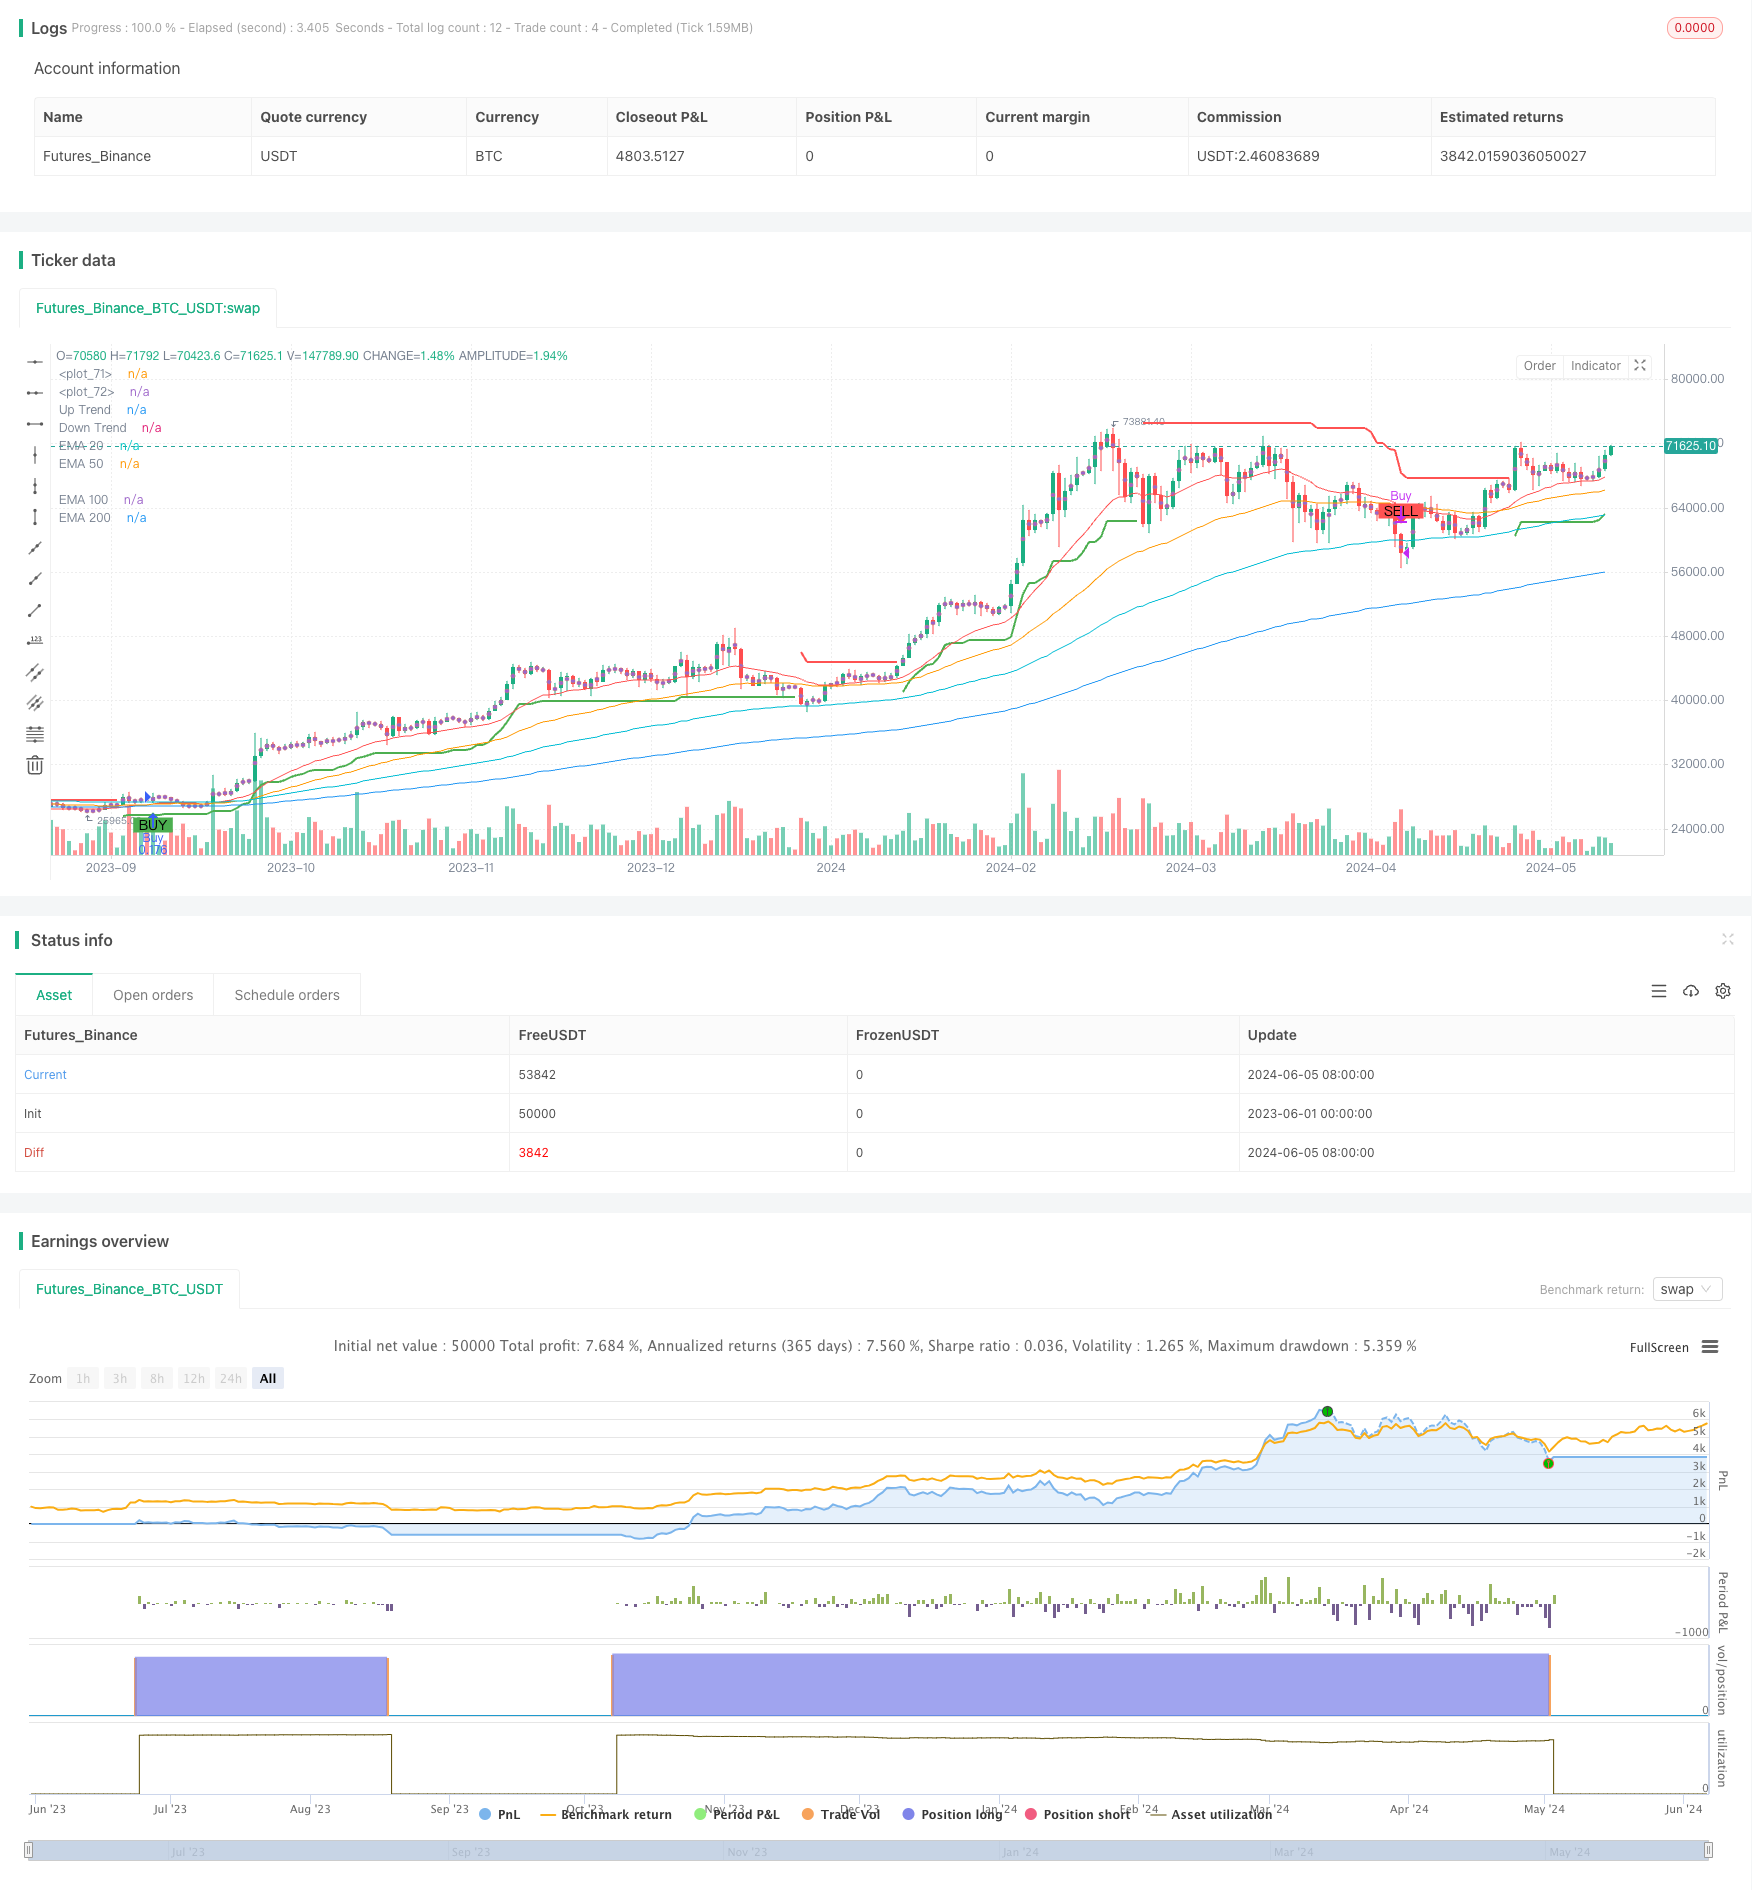
Supertrend和EMA组合策略是一种利用Supertrend指标和多重EMA指标相结合的交易策略。该策略通过Supertrend指标判断当前市场的趋势方向,同时使用不同周期的EMA指标作为买卖信号的触发条件。当短期EMA与中期EMA发生金叉时,且Supertrend指标显示上升趋势,则产生买入信号;当短期EMA与中期EMA发生死叉时,且Supertrend指标显示下降趋势,则产生卖出信号。
策略原理
Supertrend和EMA组合策略的核心原理是利用Supertrend指标和EMA指标的特性,捕捉市场的趋势变化和价格波动。Supertrend指标通过比较当前收盘价与前一周期的上下轨道,判断当前市场的趋势方向。当收盘价突破上轨时,表明市场进入上升趋势;当收盘价跌破下轨时,表明市场进入下降趋势。同时,该策略使用了四个不同周期的EMA指标(20日、50日、100日和200日),通过比较短期EMA与中期EMA的交叉情况,产生买卖信号。当短期EMA上穿中期EMA时,表明市场可能出现上涨动能,结合Supertrend指标的上升趋势,产生买入信号;当短期EMA下穿中期EMA时,表明市场可能出现下跌压力,结合Supertrend指标的下降趋势,产生卖出信号。
策略优势
- 趋势跟踪能力强:Supertrend指标可以有效地捕捉市场的趋势变化,帮助策略顺应市场趋势进行交易。
- 多重EMA确认:使用不同周期的EMA指标作为买卖信号的触发条件,可以提高信号的可靠性,减少假信号的出现。
- 风险控制:通过Supertrend指标的趋势判断,可以避免在逆势行情中进行交易,降低风险。
- 适应性强:该策略可以应用于不同的市场和品种,具有较好的适应性和灵活性。
策略风险
- 参数优化风险:Supertrend指标和EMA指标的参数设置对策略性能有较大影响,不恰当的参数可能导致策略失效。
- 市场波动风险:在市场波动剧烈时,短期EMA与中期EMA可能出现频繁的交叉,导致策略产生多个虚假信号。
- 趋势转折风险:当市场趋势发生转折时,Supertrend指标可能出现滞后,导致策略在趋势转折初期出现损失。
策略优化方向
- 参数优化:通过对Supertrend指标的乘数和EMA指标的周期进行优化,找到最佳的参数组合,提高策略的稳定性和盈利能力。
- 信号过滤:在EMA交叉信号产生后,可以结合其他技术指标(如RSI、MACD等)对信号进行二次确认,提高信号的可靠性。
- 止损止盈:引入合理的止损止盈机制,控制单笔交易的风险,提高策略的风险收益比。
- 多品种多周期:将该策略应用于不同的品种和周期,通过分散投资降低整体风险。
总结
Supertrend和EMA组合策略通过将Supertrend指标与多重EMA指标相结合,形成了一套完整的趋势跟踪交易系统。该策略利用Supertrend指标判断市场趋势,同时通过EMA指标的交叉情况产生买卖信号,具有趋势跟踪能力强、信号确认可靠、适应性广等优势。然而,策略也面临参数优化、市场波动和趋势转折等风险,需要通过参数优化、信号过滤、止损止盈和多品种多周期等方式进行优化和改进,以提高策略的稳健性和盈利能力。
策略源码
/*backtest
start: 2023-06-01 00:00:00
end: 2024-06-06 00:00:00
period: 1d
basePeriod: 1h
exchanges: [{"eid":"Futures_Binance","currency":"BTC_USDT"}]
*/

//@version=4
strategy("Supertrend EMA Strategy", overlay=true, default_qty_type=strategy.percent_of_equity, default_qty_value=10)

// Supertrend Parameters
atrPeriod = input(10, title="ATR Period")
src = input(hl2, title="Source")
multiplier = input(3.0, title="ATR Multiplier", step=0.1)
changeATR = input(true, title="Change ATR Calculation Method?")
showSignals = input(true, title="Show Buy/Sell Signals?")
highlighting = input(true, title="Highlighter On/Off?")

// Calculate ATR
atr = changeATR ? atr(atrPeriod) : sma(tr, atrPeriod)

// Calculate Supertrend
up = src - (multiplier * atr)
dn = src + (multiplier * atr)
up1 = nz(up[1], up)
dn1 = nz(dn[1], dn)
up := close[1] > up1 ? max(up, up1) : up
dn := close[1] < dn1 ? min(dn, dn1) : dn
trend = 1
trend := nz(trend[1], trend)
trend := trend == -1 and close > dn1 ? 1 : trend == 1 and close < up1 ? -1 : trend

// Plot Supertrend
upPlot = plot(trend == 1 ? up : na, title="Up Trend", style=plot.style_linebr, linewidth=2, color=color.green)
dnPlot = plot(trend == 1 ? na : dn, title="Down Trend", style=plot.style_linebr, linewidth=2, color=color.red)

// EMA Parameters
shortEmaLength = input(20, title="Short EMA Length")
mediumEmaLength = input(50, title="Medium EMA Length")
longEmaLength = input(100, title="Long EMA Length")
longestEmaLength = input(200, title="Longest EMA Length")

// Calculate EMA
shortEma = ema(close, shortEmaLength)
mediumEma = ema(close, mediumEmaLength)
longEma = ema(close, longEmaLength)
longestEma = ema(close, longestEmaLength)

// Plot EMA
plot(shortEma, color=color.red, title="EMA 20")
plot(mediumEma, color=color.orange, title="EMA 50")
plot(longEma, color=color.aqua, title="EMA 100")
plot(longestEma, color=color.blue, title="EMA 200")

// Define Buy and Sell Conditions
buyCondition = crossover(shortEma, mediumEma) and trend == 1
sellCondition = crossunder(shortEma, mediumEma) and trend == -1

// Plot Buy/Sell Signals
plotshape(series=buyCondition, location=location.belowbar, color=color.green, style=shape.labelup, text="BUY")
plotshape(series=sellCondition, location=location.abovebar, color=color.red, style=shape.labeldown, text="SELL")

// Add Text Labels for Buy and Sell Signals
if (buyCondition)
    label.new(bar_index, high, text="Buy", color=color.green, textcolor=color.white, style=label.style_label_up, yloc=yloc.abovebar)
if (sellCondition)
    label.new(bar_index, low, text="Sell", color=color.red, textcolor=color.white, style=label.style_label_down, yloc=yloc.belowbar)

// Strategy Entry and Exit
if (buyCondition)
    strategy.entry("Buy", strategy.long)
if (sellCondition)
    strategy.close("Buy")

// Highlight Trend
longFillColor = highlighting ? (trend == 1 ? color.green : color.white) : color.white
shortFillColor = highlighting ? (trend == -1 ? color.red : color.white) : color.white
fill(plot(ohlc4, title="", style=plot.style_circles, linewidth=0), upPlot, title="UpTrend Highlighter", color=longFillColor)
fill(plot(ohlc4, title="", style=plot.style_circles, linewidth=0), dnPlot, title="DownTrend Highlighter", color=shortFillColor)

// Alerts
alertcondition(buyCondition, title="Buy Alert", message="Supertrend EMA Buy Signal")
alertcondition(sellCondition, title="Sell Alert", message="Supertrend EMA Sell Signal")
相关推荐