概述
该策略是一个结合了双均线和随机RSI指标的趋势跟踪交易系统。通过21周期和55周期简单移动平均线判断市场趋势,利用随机RSI的超买超卖区间寻找最优入场点和出场点,实现对趋势交易的优化。策略在确认上升趋势的基础上,在超卖区域寻找买入机会,在超买区域寻找卖出时机。
策略原理
策略采用以下核心逻辑: 1. 趋势确认:使用21周期SMA和55周期SMA,当短期均线位于长期均线之上时,确认上升趋势。 2. 入场信号:在确认趋势后,等待随机RSI的K线在20以下的超卖区域与D线形成黄金交叉。 3. 出场信号:当随机RSI的K线在80以上的超买区域与D线形成死亡交叉时,平仓出场。 4. 信号过滤:通过结合趋势和动量指标,有效降低假信号。
策略优势
- 多重确认机制:通过趋势和动量双重确认,提高交易的可靠性。
- 风险控制优化:利用超买超卖区间,在趋势方向上选择更优的入场点。
- 自适应性强:策略参数可根据不同市场特征进行调整。
- 信号明确:入场和出场条件清晰,易于执行。
- 系统化程度高:策略逻辑完全系统化,减少主观判断。
策略风险
- 震荡市场风险:在横盘震荡市场可能产生频繁交易。
- 滞后性风险:移动平均线具有一定滞后性,可能错过最佳入场时机。
- 假突破风险:随机RSI可能在震荡市场产生虚假信号。
- 参数敏感性:不同参数组合可能导致策略表现差异较大。
策略优化方向
- 加入波动率过滤:引入ATR指标,在低波动率期间减少交易频率。
- 优化出场机制:可考虑加入移动止损或利润目标。
- 市场环境分类:根据不同市场环境动态调整参数。
- 增加成交量确认:加入成交量指标验证信号有效性。
- 引入趋势强度指标:如ADX,用于过滤弱趋势环境。
总结
该策略通过结合经典技术指标,构建了一个完整的趋势跟踪交易系统。策略在保持简单直观的同时,通过多重信号确认提高了可靠性。通过合理的参数优化和风险管理,该策略具有良好的实用价值。建议交易者在实盘使用前进行充分的回测,并根据具体市场特征调整参数。
策略源码
/*backtest
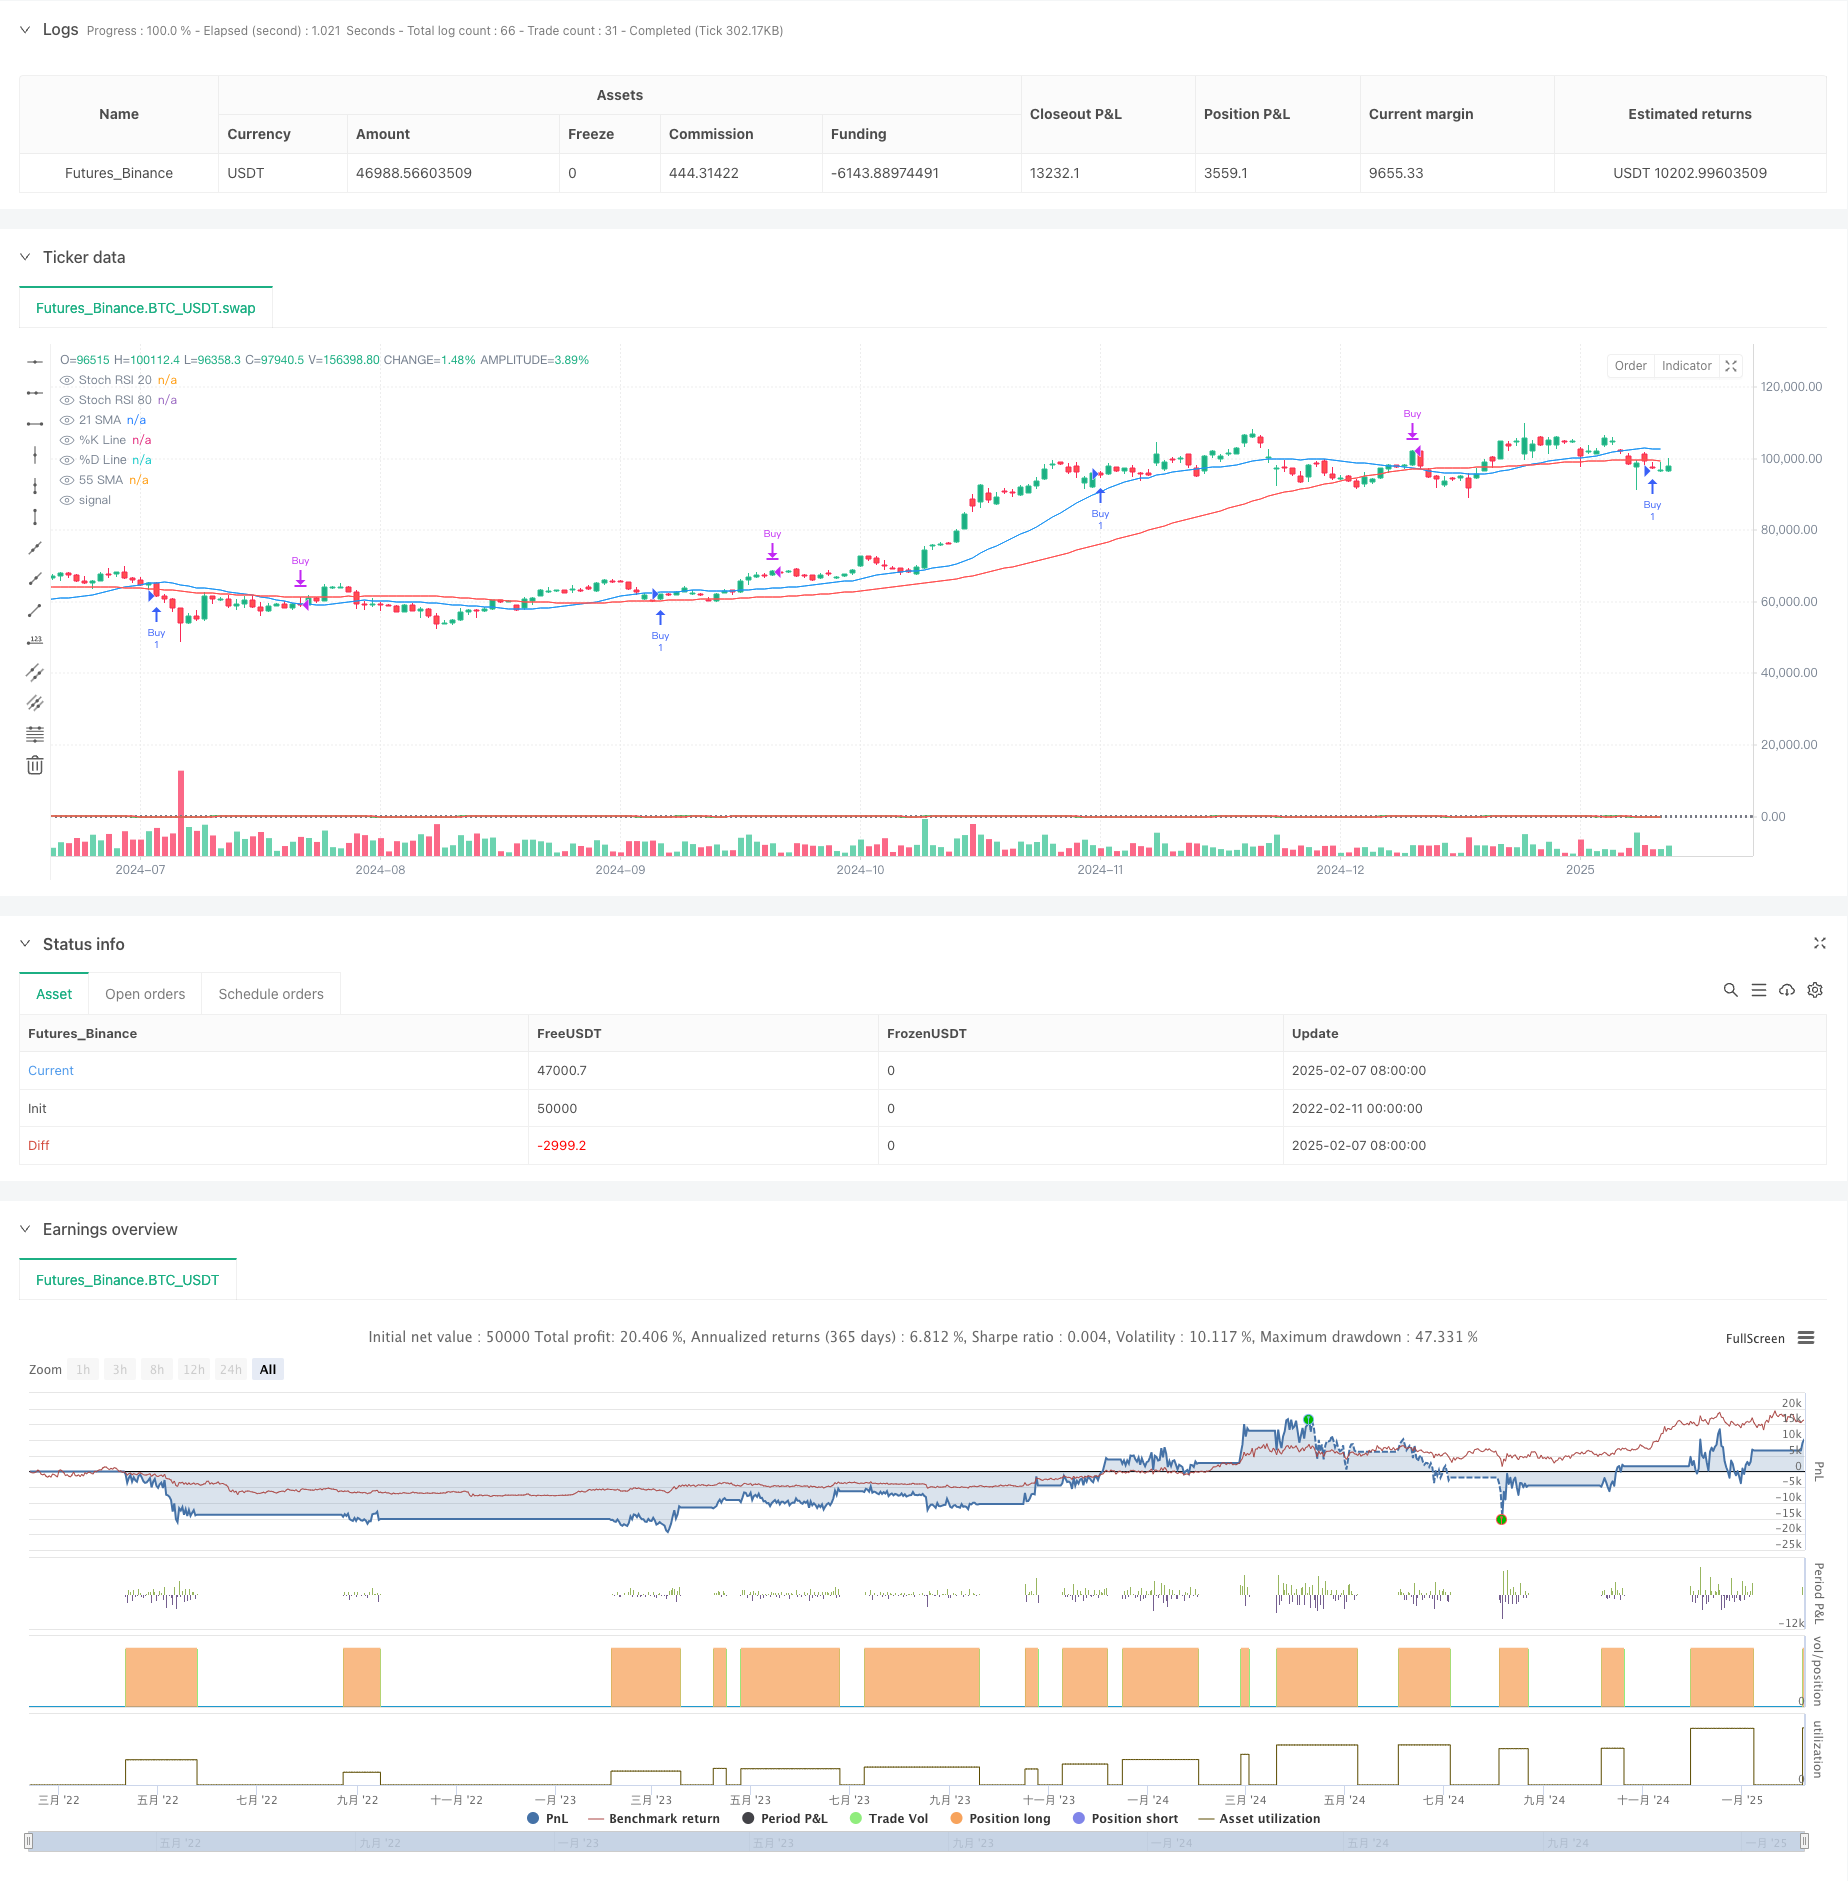
start: 2022-02-11 00:00:00
end: 2025-02-08 08:00:00
period: 1d
basePeriod: 1d
exchanges: [{"eid":"Futures_Binance","currency":"BTC_USDT"}]
*/
//@version=6
strategy("SMA & Stoch RSI Buy Strategy with K > 80 Exit", overlay=true)
// Input parameters for the SMAs
sma21Length = input(21, title="21 SMA Length")
sma55Length = input(55, title="55 SMA Length")
// Input parameters for the Stochastic RSI
stochRsiLength = input(14, title="Stoch RSI Length")
stochRsiK = input(3, title="Stoch RSI %K Smoothing")
stochRsiD = input(3, title="Stoch RSI %D Smoothing")
// Calculate the SMAs
sma21 = ta.sma(close, sma21Length)
sma55 = ta.sma(close, sma55Length)
// Calculate the Stochastic RSI
rsiValue = ta.rsi(close, stochRsiLength)
stochRsi = ta.stoch(rsiValue, rsiValue, rsiValue, stochRsiLength)
stochRsiKLine = ta.sma(stochRsi, stochRsiK)
stochRsiDLine = ta.sma(stochRsiKLine, stochRsiD)
// Buy signal conditions
smaCondition = sma21 > sma55
stochRsiCondition = ta.crossover(stochRsiKLine, stochRsiDLine) and stochRsiKLine < 20
// Entry condition
buySignal = smaCondition and stochRsiCondition
// Exit condition: Stochastic RSI K > 80 and K crosses below D
exitCondition = ta.crossunder(stochRsiKLine, stochRsiDLine) and stochRsiKLine > 80
// Execute buy order on signal
if (buySignal)
strategy.entry("Buy", strategy.long)
// Exit the trade on the modified exit condition
if (exitCondition)
strategy.close("Buy")
// Plot the SMAs
plot(sma21, color=color.blue, title="21 SMA")
plot(sma55, color=color.red, title="55 SMA")
// Plot Stochastic RSI for reference (not overlayed)
hline(20, "Stoch RSI 20", color=color.gray, linestyle=hline.style_dotted)
hline(80, "Stoch RSI 80", color=color.gray, linestyle=hline.style_dotted)
plot(stochRsiKLine, title="%K Line", color=color.green)
plot(stochRsiDLine, title="%D Line", color=color.red)
相关推荐