概述
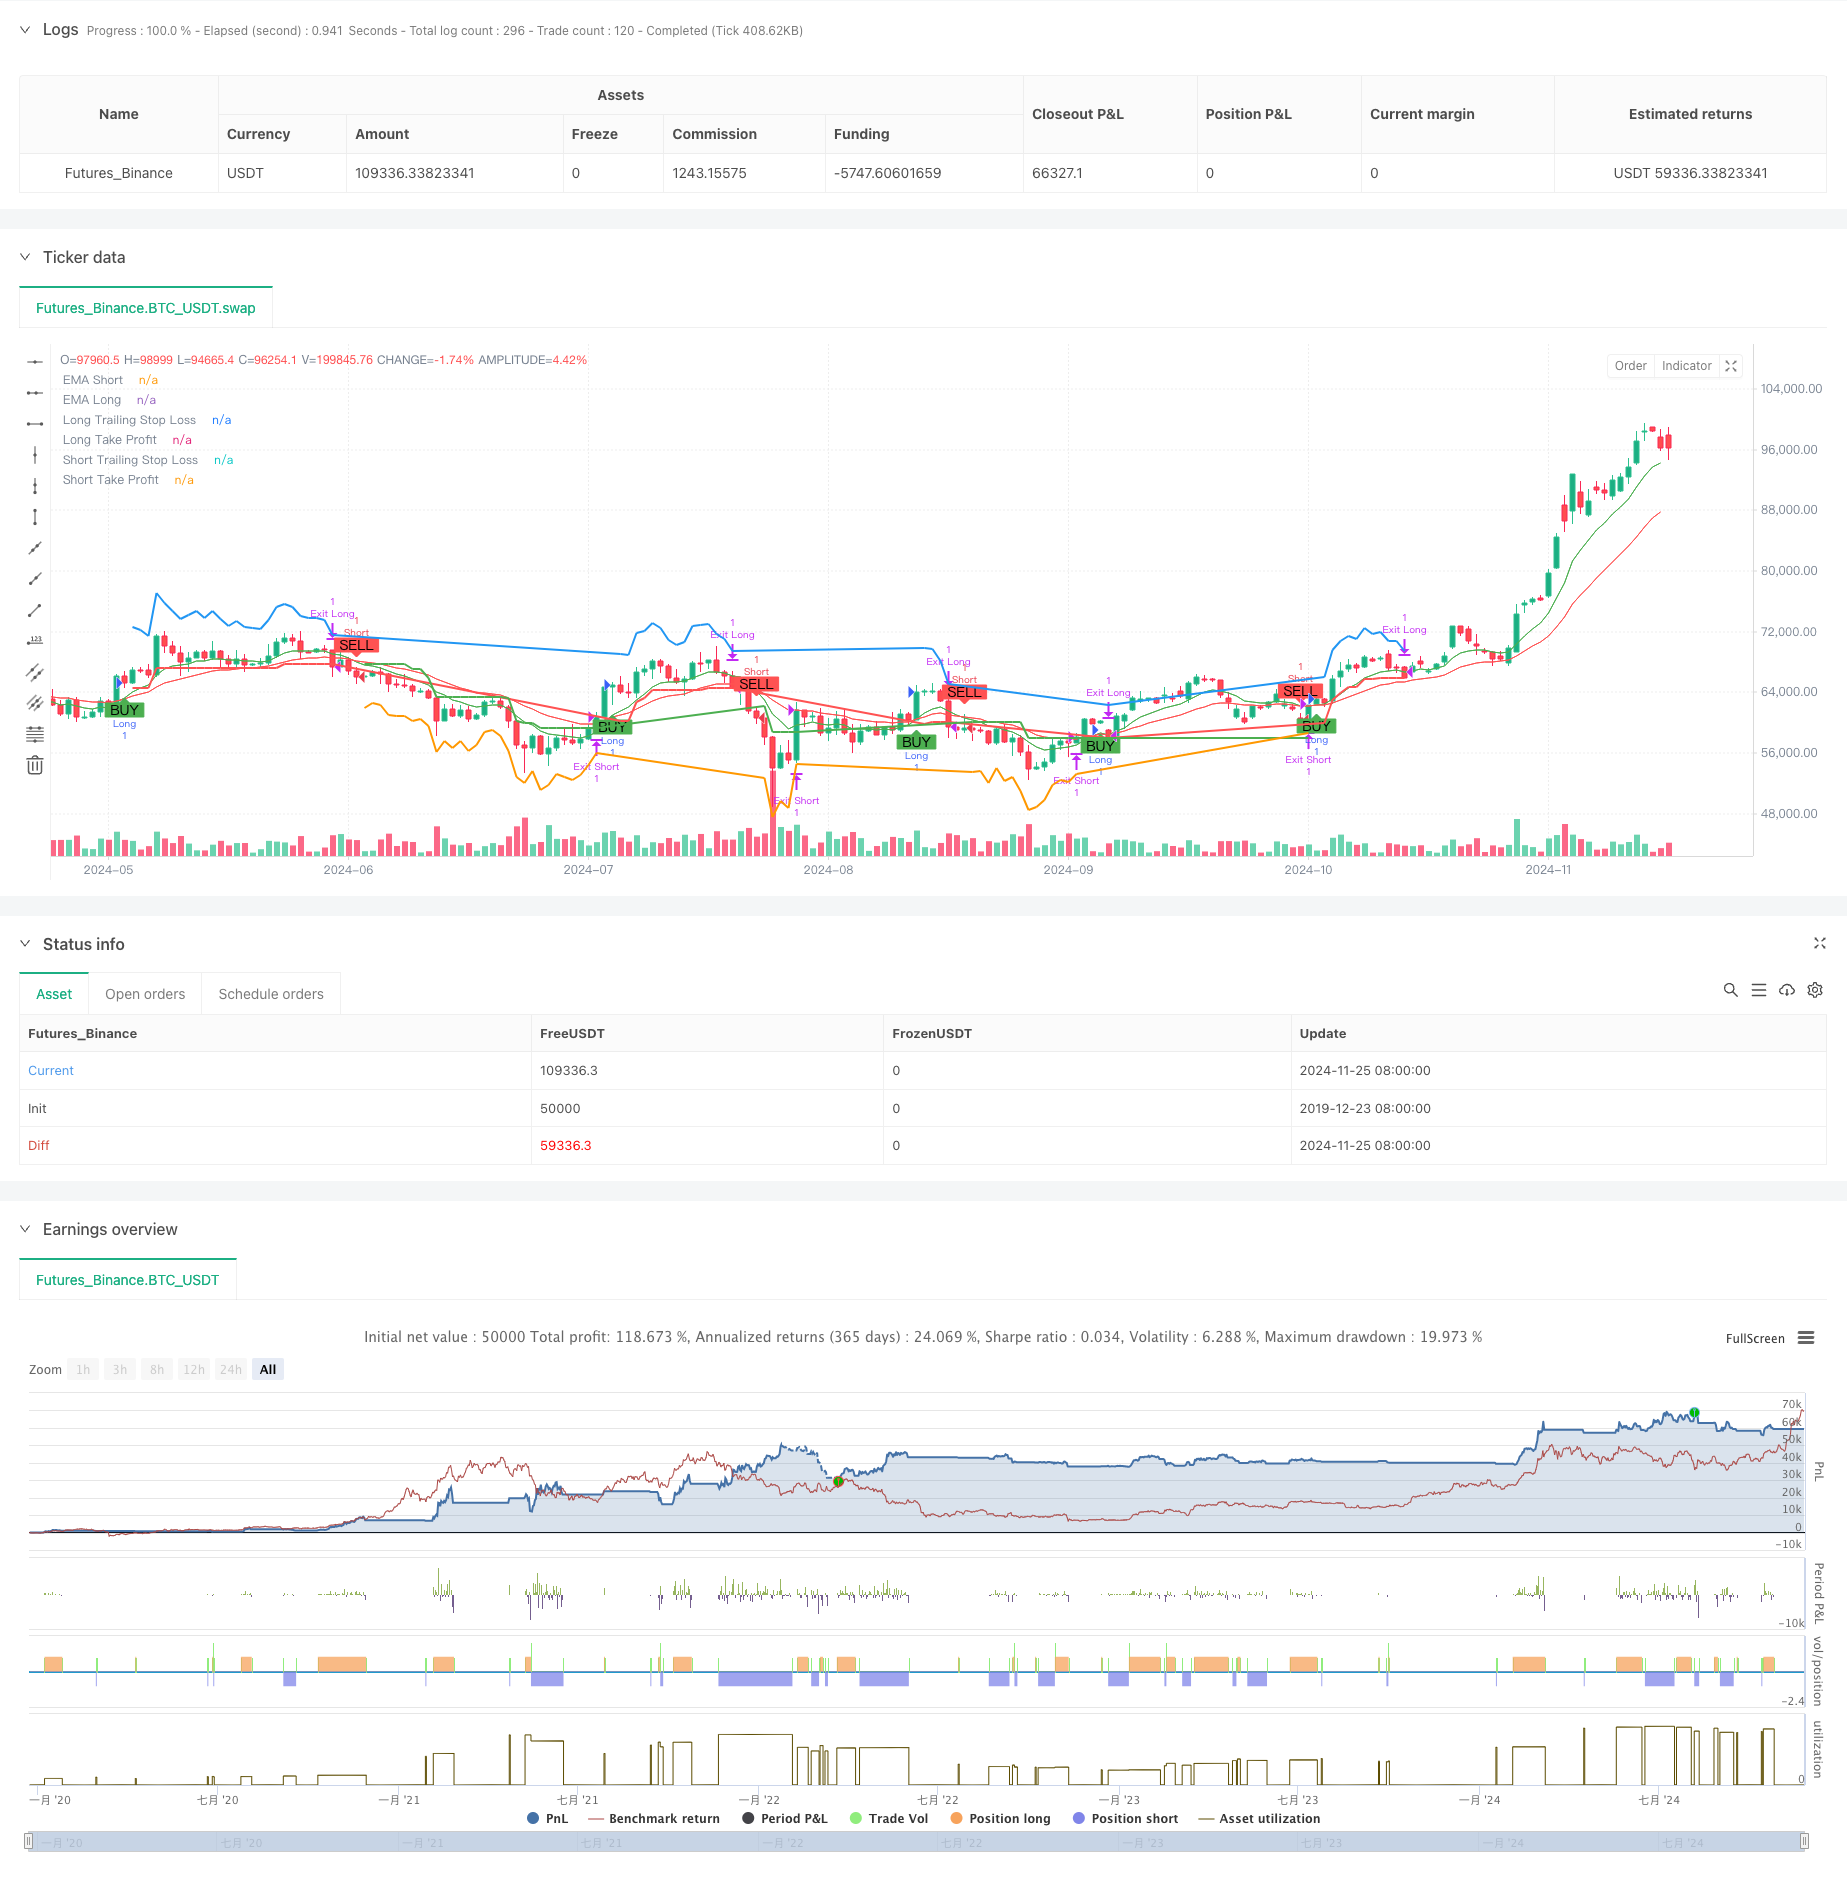
这是一个结合了多周期分析和波动率管理的趋势跟踪策略。策略核心采用双均线交叉判断趋势方向,通过RSI指标进行超买超卖过滤,引入更高时间周期EMA确认整体趋势,并利用ATR指标动态管理止损和获利目标。该策略通过多重技术指标的配合使用,既保证了交易信号的可靠性,又实现了对风险的有效控制。
策略原理
策略的核心交易逻辑分为以下几个关键部分: 1. 趋势识别:使用短周期和长周期EMA的交叉来识别趋势变化,当短期EMA上穿长期EMA时产生做多信号,下穿时产生做空信号。 2. 趋势确认:引入更高时间周期的EMA作为趋势过滤器,只有当价格位于高周期EMA之上时才允许做多,反之才允许做空。 3. 波动率过滤:使用RSI指标进行超买超卖判断,防止在过度追涨杀跌的情况下入场。 4. 仓位管理:基于ATR设置动态的止损和获利目标,随着价格变动自动调整止损位置,保护既有利润。 5. 多维度防护:策略通过多个技术指标的综合运用,构建了一个完整的交易决策系统。
策略优势
- 信号可靠性高:通过多重技术指标的配合使用,显著提高了交易信号的可靠性。
- 风险控制完善:采用基于ATR的动态止损方案,能够根据市场波动性自适应调整止损位置。
- 趋势把握准确:利用多周期分析方法,提高了对主要趋势的判断准确度。
- 获利目标灵活:take-profit设置也基于ATR动态调整,在保证盈利的同时不会过早离场。
- 适应性强:策略参数可调整性强,能够适应不同市场环境。
策略风险
- 震荡市场风险:在横盘震荡行情下可能频繁交易导致亏损。
- 滑点风险:在波动剧烈时期,实际成交价格可能与理论价格存在较大偏差。
- 假突破风险:可能在短期突破后出现反转,导致止损出场。
- 参数敏感性:不同参数组合对策略表现影响较大,需要充分测试。
策略优化方向
- 市场环境识别:可以添加趋势强度指标,在震荡市场自动降低仓位或暂停交易。
- 入场时机优化:可以结合成交量指标,提高入场信号的可靠性。
- 动态参数调整:可以根据市场波动率自动调整EMA周期和ATR倍数。
- 分批建仓方案:可以设计分批建仓和减仓机制,降低单一价格点位的风险。
- 仓位管理优化:可以基于账户风险和市场波动性动态调整持仓规模。
总结
这是一个设计完善的趋势跟踪策略,通过多周期分析和波动率管理实现了较好的风险收益特征。策略的核心优势在于多重技术指标的有机结合,既保证了交易的可靠性,又实现了风险的有效控制。虽然存在一些潜在风险,但通过持续优化和完善,策略的整体表现仍有提升空间。要充分重视参数优化和回测验证,在实盘交易中严格执行风险控制措施。
策略源码
/*backtest
start: 2019-12-23 08:00:00
end: 2024-11-26 00:00:00
period: 1d
basePeriod: 1d
exchanges: [{"eid":"Futures_Binance","currency":"BTC_USDT"}]
*/

//@version=5
strategy("Trend Following with ATR and MTF Confirmation", overlay=true)

// Parameters
emaShortPeriod = input.int(9, title="Short EMA Period", minval=1)
emaLongPeriod = input.int(21, title="Long EMA Period", minval=1)
rsiPeriod = input.int(14, title="RSI Period", minval=1)
rsiOverbought = input.int(70, title="RSI Overbought", minval=50)
rsiOversold = input.int(30, title="RSI Oversold", minval=1)
atrPeriod = input.int(14, title="ATR Period", minval=1)
atrMultiplier = input.float(1.5, title="ATR Multiplier", minval=0.1)
takeProfitATRMultiplier = input.float(2.0, title="Take Profit ATR Multiplier", minval=0.1)

// Multi-timeframe settings
htfEMAEnabled = input.bool(true, title="Use Higher Timeframe EMA Confirmation?", inline="htf")
htfEMATimeframe = input.timeframe("D", title="Higher Timeframe", inline="htf")

// Select trade direction
tradeDirection = input.string("Both", title="Trade Direction", options=["Both", "Long", "Short"])

// Calculating indicators
emaShort = ta.ema(close, emaShortPeriod)
emaLong = ta.ema(close, emaLongPeriod)
rsiValue = ta.rsi(close, rsiPeriod)
atrValue = ta.atr(atrPeriod)

// Higher timeframe EMA confirmation
htfEMALong = request.security(syminfo.tickerid, htfEMATimeframe, ta.ema(close, emaLongPeriod))

// Trading conditions
longCondition = ta.crossover(emaShort, emaLong) and rsiValue < rsiOverbought and (not htfEMAEnabled or close > htfEMALong)
shortCondition = ta.crossunder(emaShort, emaLong) and rsiValue > rsiOversold and (not htfEMAEnabled or close < htfEMALong)

// Plotting EMAs
plot(emaShort, title="EMA Short", color=color.green)
plot(emaLong, title="EMA Long", color=color.red)

// Trailing Stop-Loss and Take-Profit levels
var float trailStopLoss = na
var float trailTakeProfit = na

// Exit conditions
var bool exitLongCondition = na
var bool exitShortCondition = na

if (strategy.position_size != 0)
    if (strategy.position_size > 0) // Long Position
        trailStopLoss := na(trailStopLoss) ? close - atrValue * atrMultiplier : math.max(trailStopLoss, close - atrValue * atrMultiplier)
        trailTakeProfit := close + atrValue * takeProfitATRMultiplier
        exitLongCondition := close <= trailStopLoss or close >= trailTakeProfit
        strategy.exit("Exit Long", "Long", stop=trailStopLoss, limit=trailTakeProfit, when=exitLongCondition)
    else // Short Position
        trailStopLoss := na(trailStopLoss) ? close + atrValue * atrMultiplier : math.min(trailStopLoss, close + atrValue * atrMultiplier)
        trailTakeProfit := close - atrValue * takeProfitATRMultiplier
        exitShortCondition := close >= trailStopLoss or close <= trailTakeProfit
        strategy.exit("Exit Short", "Short", stop=trailStopLoss, limit=trailTakeProfit, when=exitShortCondition)

// Strategy Entry
if (longCondition and (tradeDirection == "Both" or tradeDirection == "Long"))
    strategy.entry("Long", strategy.long)

if (shortCondition and (tradeDirection == "Both" or tradeDirection == "Short"))
    strategy.entry("Short", strategy.short)

// Plotting Buy/Sell signals
plotshape(series=longCondition, title="Buy Signal", location=location.belowbar, color=color.green, style=shape.labelup, text="BUY")
plotshape(series=shortCondition, title="Sell Signal", location=location.abovebar, color=color.red, style=shape.labeldown, text="SELL")

// Plotting Trailing Stop-Loss and Take-Profit levels
plot(strategy.position_size > 0 ? trailStopLoss : na, title="Long Trailing Stop Loss", color=color.red, linewidth=2, style=plot.style_line)
plot(strategy.position_size < 0 ? trailStopLoss : na, title="Short Trailing Stop Loss", color=color.green, linewidth=2, style=plot.style_line)
plot(strategy.position_size > 0 ? trailTakeProfit : na, title="Long Take Profit", color=color.blue, linewidth=2, style=plot.style_line)
plot(strategy.position_size < 0 ? trailTakeProfit : na, title="Short Take Profit", color=color.orange, linewidth=2, style=plot.style_line)

// Alerts
alertcondition(longCondition, title="Buy Alert", message="Buy Signal Triggered")
alertcondition(shortCondition, title="Sell Alert", message="Sell Signal Triggered")
alertcondition(exitLongCondition, title="Long Exit Alert", message="Long Position Closed")
alertcondition(exitShortCondition, title="Short Exit Alert", message="Short Position Closed")
相关推荐