概述
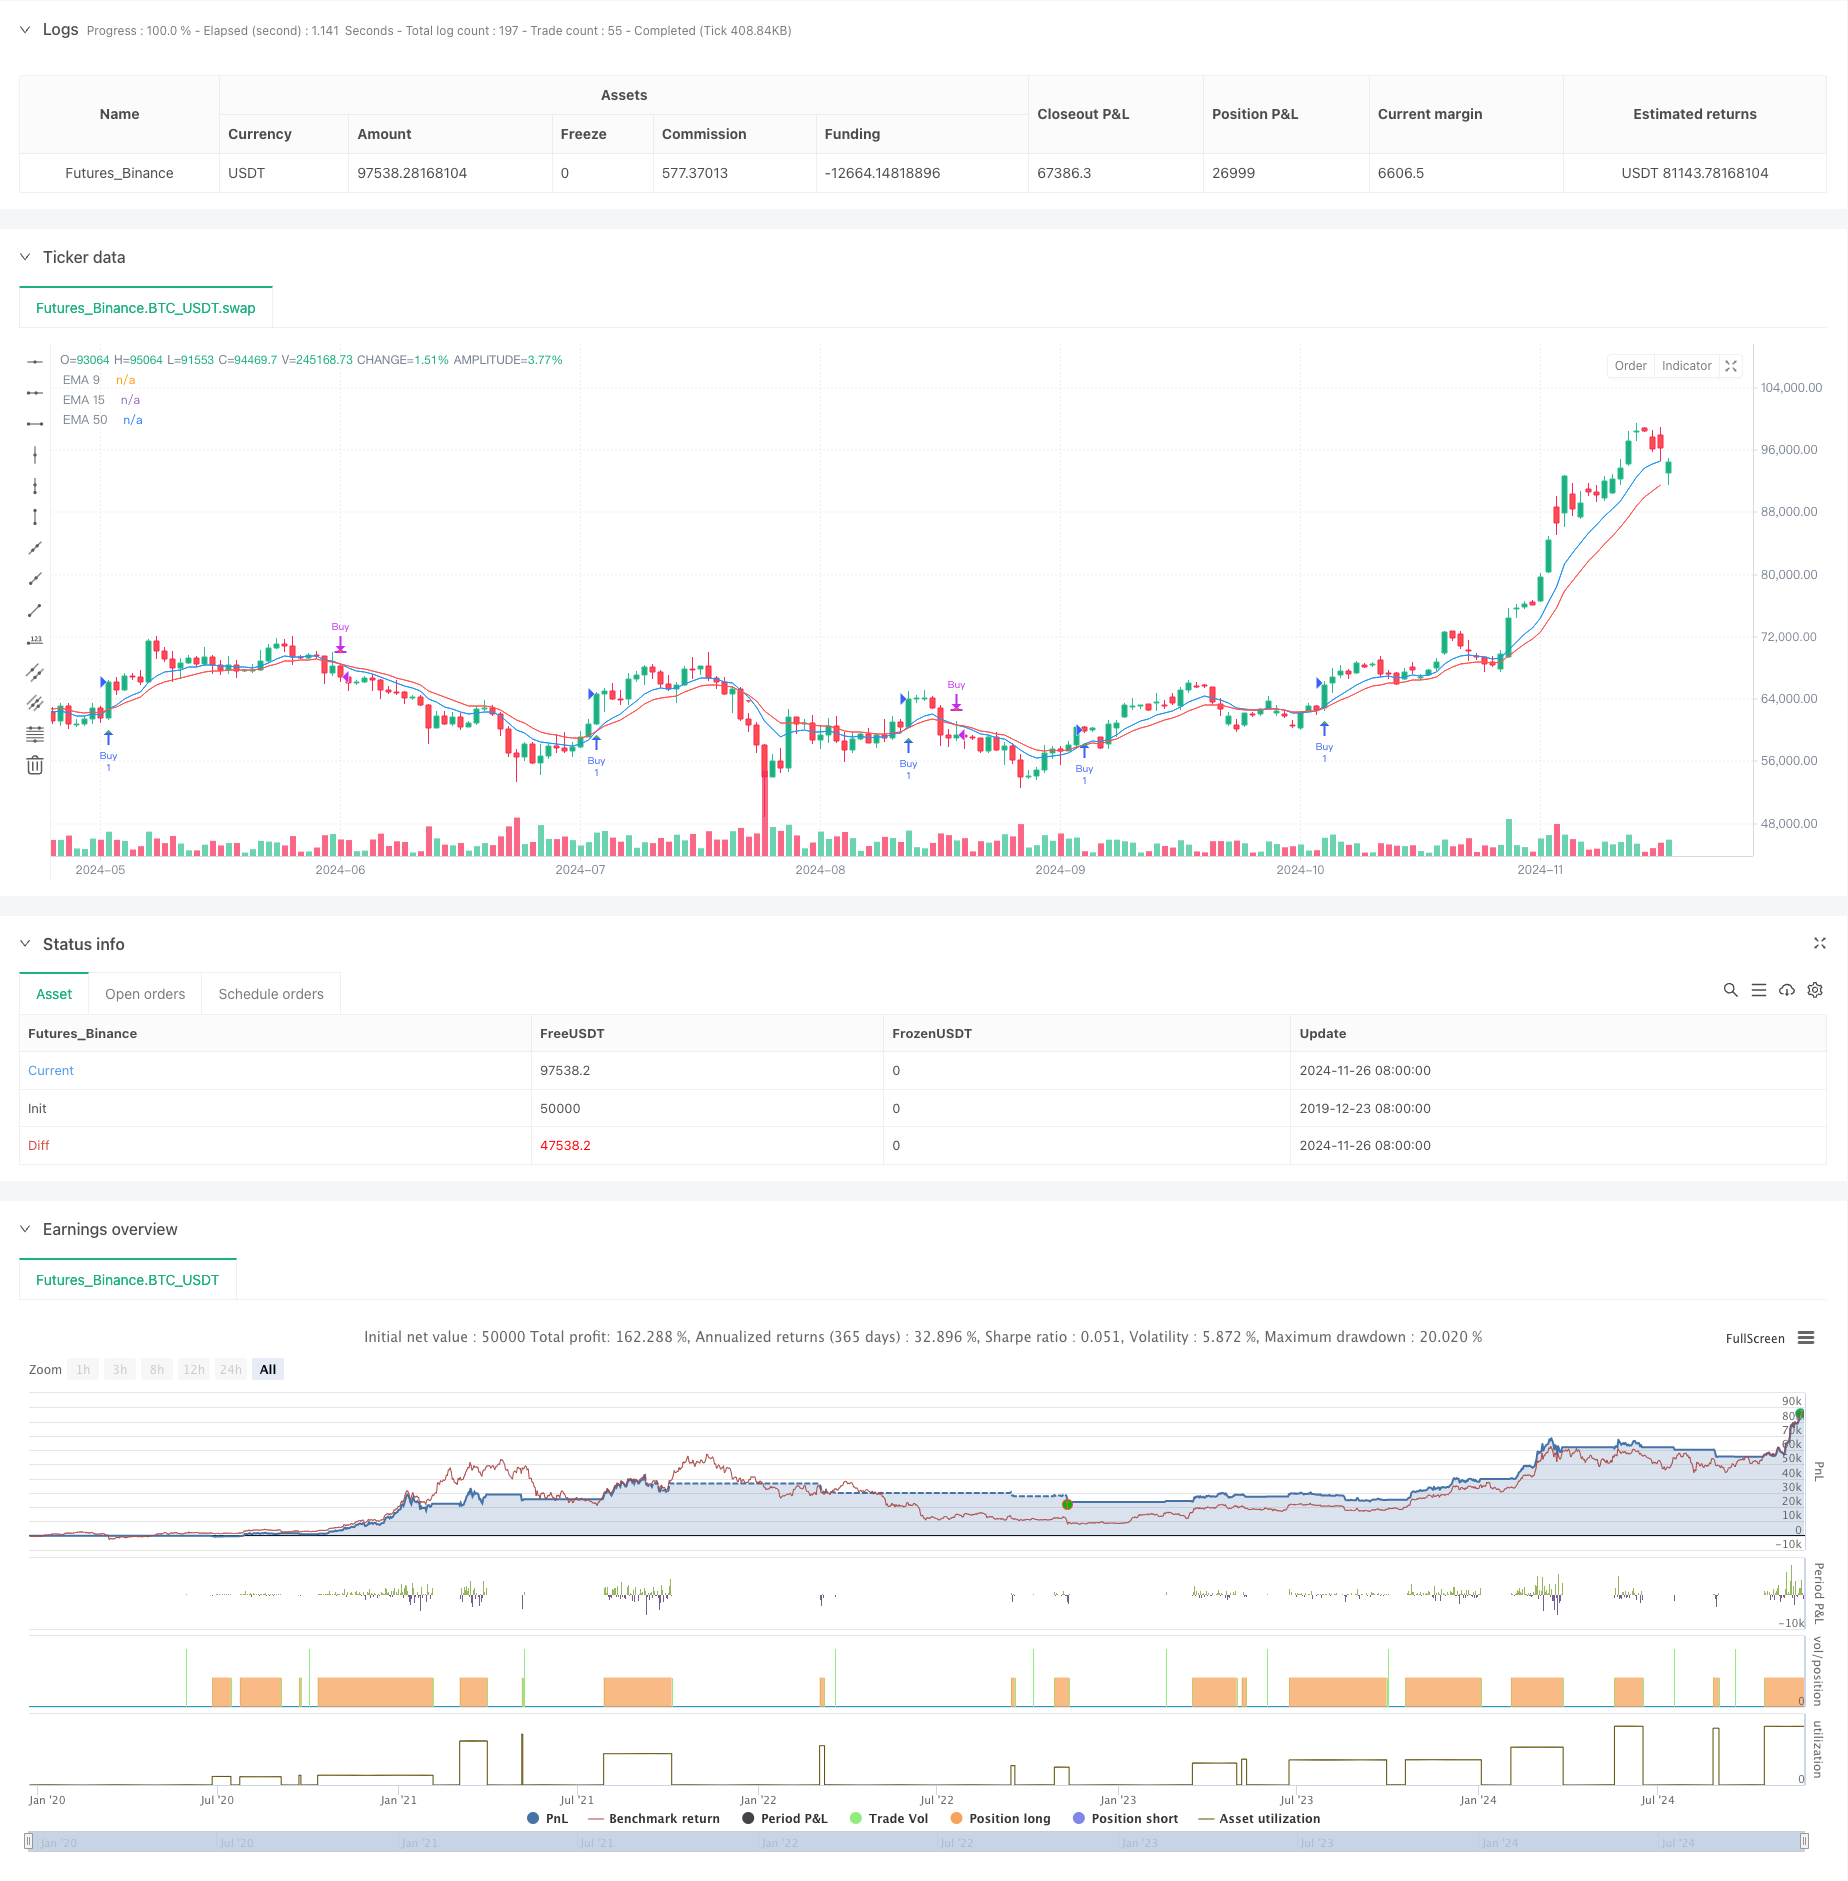
这是一个基于三重指数移动平均线(EMA)交叉信号的趋势跟踪策略。该策略综合运用了9周期、15周期和50周期的EMA指标,通过判断短期均线与中期均线的交叉信号,并结合长期均线作为趋势过滤器,同时配合动态止盈止损机制来管理交易风险。这种策略设计充分考虑了趋势跟踪和风险管理的需求,适合中长期交易。
策略原理
策略的核心逻辑是通过监测9周期EMA与15周期EMA的交叉信号来确定交易时机,并使用50周期EMA作为趋势确认指标。具体来说: 1. 当价格位于50周期EMA之上,且9周期EMA向上穿越15周期EMA时,系统产生做多信号 2. 当价格位于50周期EMA之下,且9周期EMA向下穿越15周期EMA时,系统产生平仓信号 3. 每笔交易都设置了固定的止损点位和获利目标,以保护资金安全并锁定利润 4. 系统通过alert功能在产生交易信号时发出提醒,方便交易者及时处理
策略优势
- 多重确认机制:通过三条均线的配合使用,有效降低了假突破的风险
- 趋势跟踪能力强:50周期EMA的过滤作用确保交易方向与主趋势保持一致
- 风险管理完善:内置止损和获利目标,可以有效控制每笔交易的风险
- 信号明确:交叉信号清晰,便于操作执行
- 自动化程度高:支持自动交易和提醒功能,减少人为干预
- 参数可调整:主要参数都可以根据不同市场特征进行优化
策略风险
- 震荡市场风险:在横盘整理阶段可能产生频繁的假信号
- 滞后性风险:移动平均线本身具有滞后性,可能错过最佳入场时机
- 固定止损风险:固定点位的止损可能不适应市场波动性的变化
- 过度依赖技术指标:未考虑基本面因素可能导致重要转折点的判断失误
- 资金管理风险:如果不合理设置止损和获利目标,可能影响整体收益率
策略优化方向
- 动态止损优化:可以引入ATR指标来动态调整止损位置,使其更符合市场波动特征
- 信号过滤增强:可以添加成交量、RSI等辅助指标来过滤假信号
- 参数自适应:可以根据市场波动率自动调整均线周期,提高策略适应性
- 分时段优化:针对不同时间段的市场特征,调整策略参数
- 仓位管理完善:引入动态仓位管理机制,根据市场风险度自动调整开仓数量
总结
这是一个设计合理、逻辑清晰的趋势跟踪策略。通过多重均线的配合使用,既保证了信号的可靠性,又实现了对趋势的有效跟踪。内置的风险管理机制为策略的稳定运行提供了保障。通过建议的优化方向,策略还有进一步提升的空间。适合追求稳健收益的交易者使用,但使用前需要充分测试和针对具体市场特征进行参数优化。
策略源码
/*backtest
start: 2019-12-23 08:00:00
end: 2024-11-27 00:00:00
period: 1d
basePeriod: 1d
exchanges: [{"eid":"Futures_Binance","currency":"BTC_USDT"}]
*/

//@version=5
strategy("EMA Crossover Strategy with 50 EMA Filter", overlay=true)

// Customizable Inputs
ema9Length = input(9, title="EMA 9 Length")
ema15Length = input(15, title="EMA 15 Length")
ema50Length = input(50, title="EMA 50 Length")
stopLossPoints = input(100, title="Stop Loss Points")
takeProfitPoints = input(200, title="Take Profit Points")

// Calculate EMAs
ema9 = ta.ema(close, ema9Length)
ema15 = ta.ema(close, ema15Length)
ema50 = ta.ema(close, ema50Length)

// Detect crossovers
crossover_above = ta.crossover(ema9, ema15)
crossover_below = ta.crossunder(ema9, ema15)

// Plot EMAs
plot(ema9, color=color.blue, title="EMA 9")
plot(ema15, color=color.red, title="EMA 15")
// Make the 50 EMA invisible
plot(ema50, color=color.new(color.white, 100), title="EMA 50", display=display.none)

// Plot buy and sell signals as shapes
plotshape(crossover_above and close > ema50, style=shape.triangleup, location=location.belowbar, color=color.green, size=size.small)
plotshape(crossover_below and close < ema50, style=shape.triangledown, location=location.abovebar, color=color.red, size=size.small)

// Execute trades
if (crossover_above and close > ema50)
    strategy.entry("Buy", strategy.long)

if (crossover_below and close < ema50)
    strategy.close("Buy")

// Apply stop loss and take profit
if (crossover_above and close > ema50)
    strategy.exit("Exit", from_entry="Buy", loss=stopLossPoints, profit=takeProfitPoints)

// Alerts for notifications
if (crossover_above and close > ema50)
    alert("EMA 9 crossed above EMA 15 with price above EMA 50 - Buy Signal", alert.freq_once_per_bar_close)

if (crossover_below and close < ema50)
    alert("EMA 9 crossed below EMA 15 with price below EMA 50 - Sell Signal", alert.freq_once_per_bar_close)
相关推荐