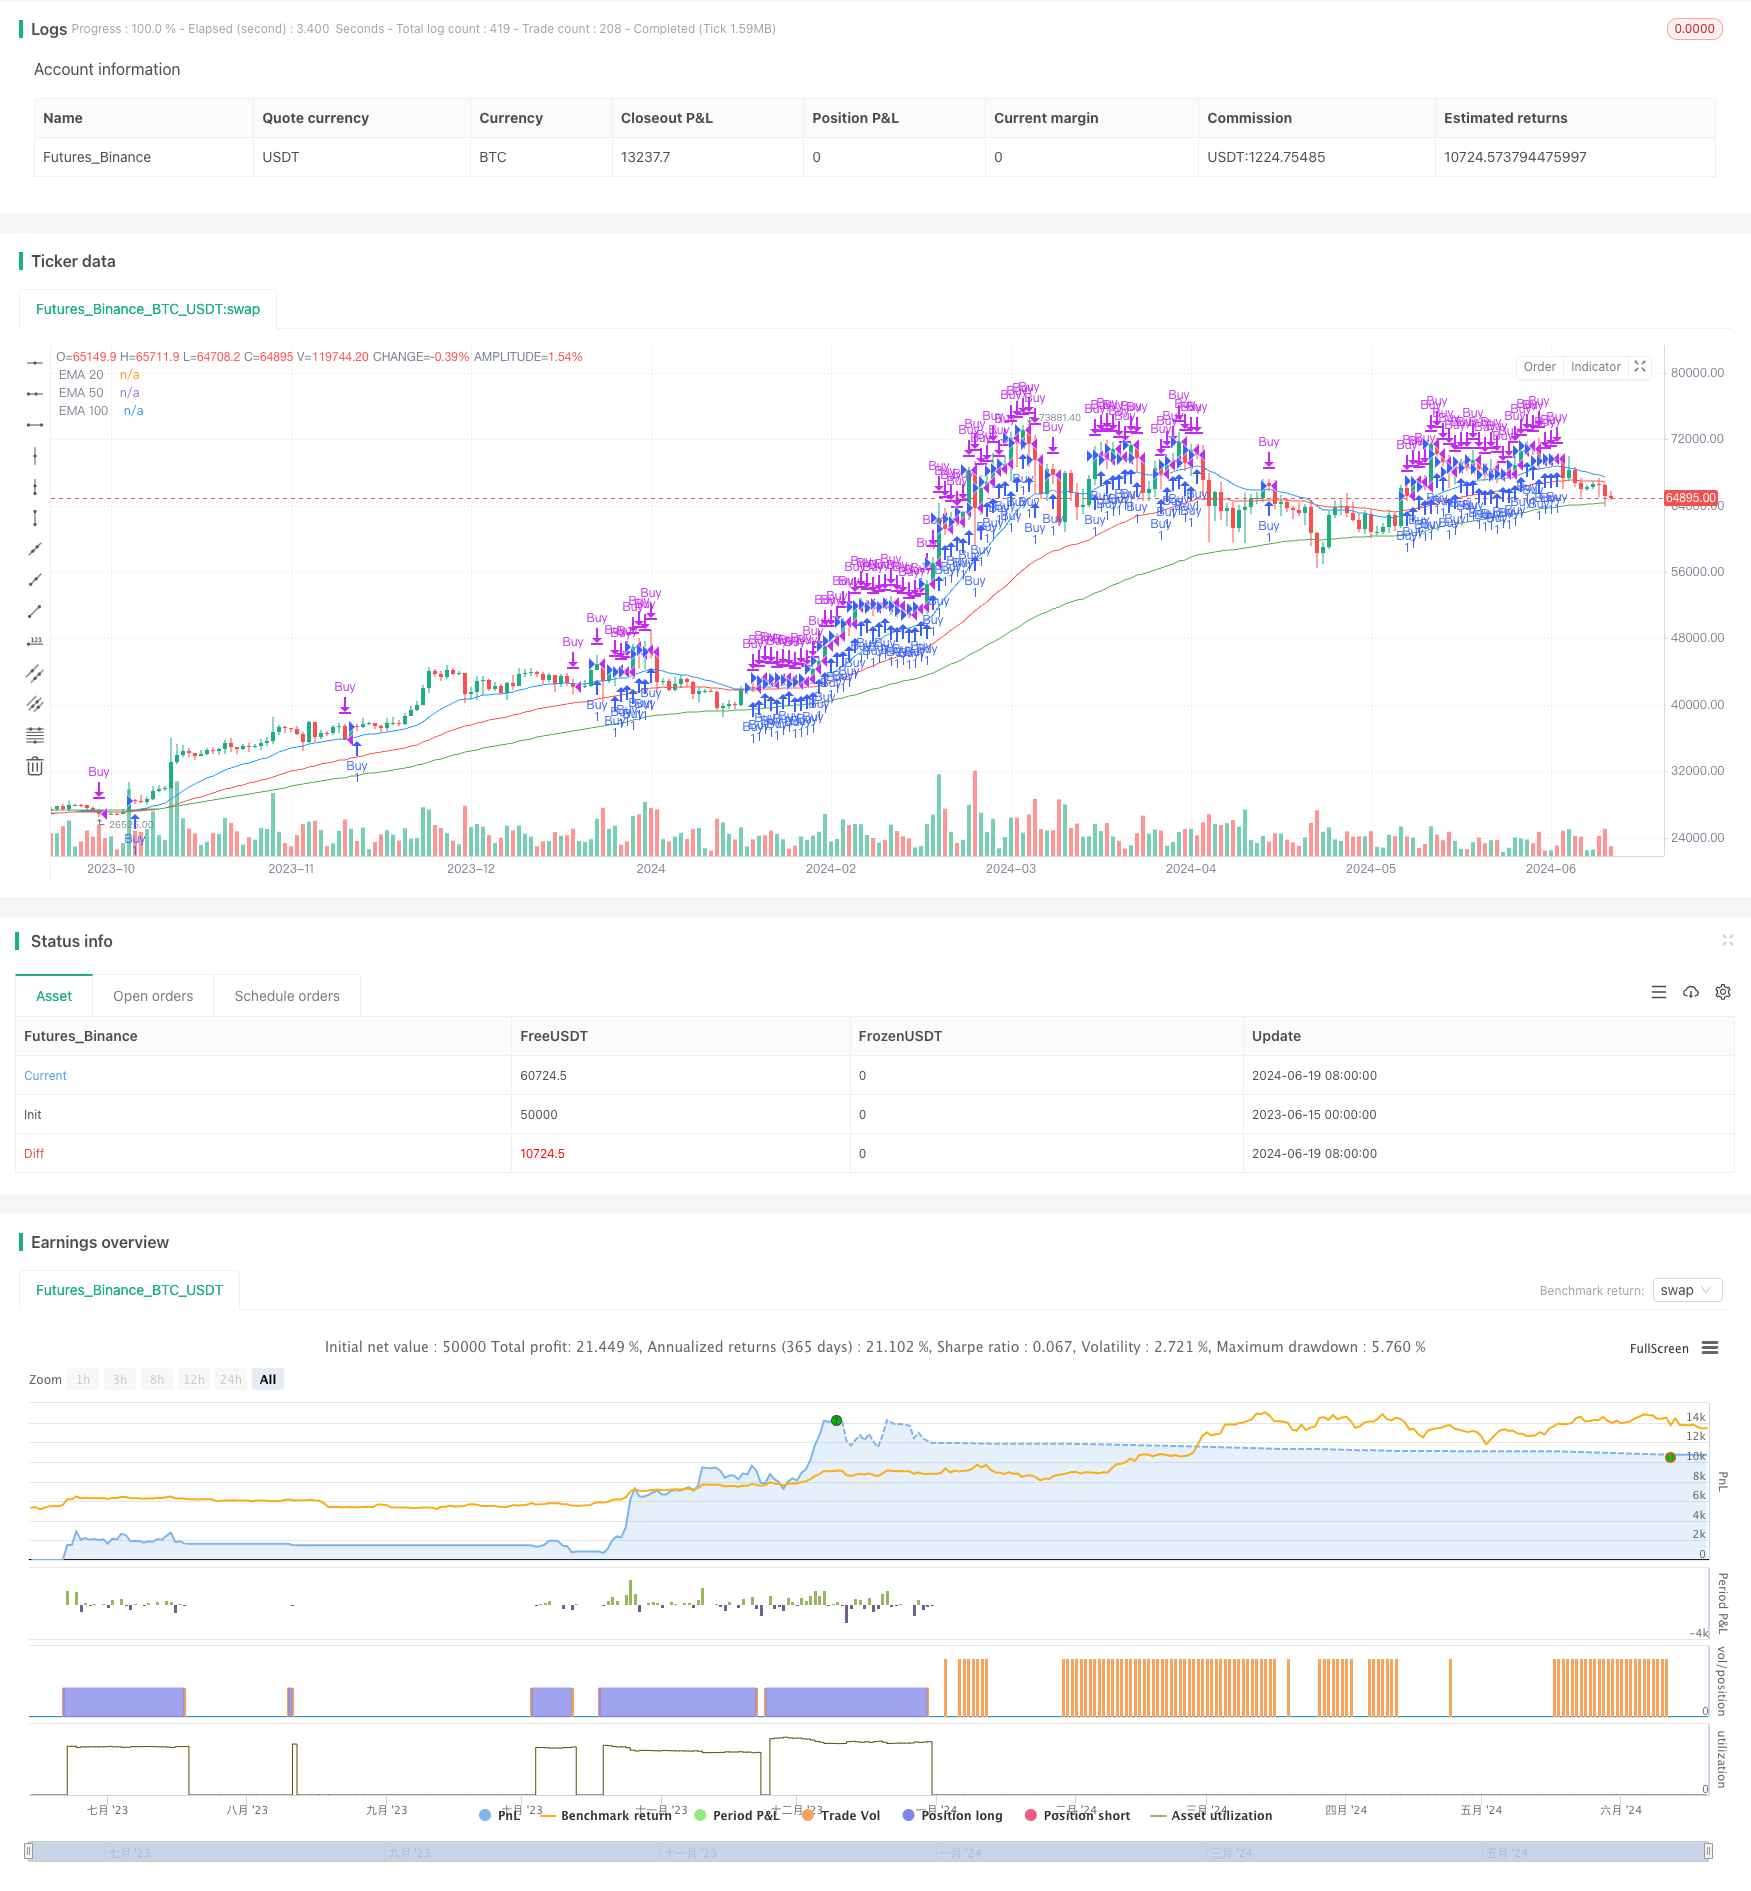
资源加载中... loading...

Multi-EMA Crossover Trend Following Strategy

Author: ChaoZhang, Date: 2024-06-21 15:42:47
Tags: EMAMA

img

Overview

This strategy is a trend-following approach based on multiple Exponential Moving Average (EMA) crossovers. It utilizes 20-day, 50-day, and 100-day EMAs to determine market trends and executes buy and sell operations when specific conditions are met. The strategy aims to capture medium to long-term trends while improving signal reliability through multi-timeframe crossovers.

Strategy Principles

  1. Buy Conditions:

    • Current closing price is above the 20-day, 50-day, and 100-day EMAs
    • This condition must be met for two consecutive days to trigger a buy signal
  2. Sell Conditions:

    • Closing price falls below any of the 20-day, 50-day, or 100-day EMAs
    • Or when the strategy’s net profit reaches 20%
  3. Strategy Logic:

    • Uses the ta.ema() function to calculate the three EMA lines
    • Tracks the consecutive fulfillment of buy conditions using variables
    • Executes strategy.entry() for buying when buy conditions are met
    • Executes strategy.close() for selling when sell conditions are met

Strategy Advantages

  1. Multi-timeframe Confirmation: Using three different period EMAs provides more reliable trend confirmation, reducing false breakouts.

  2. Consecutive Confirmation Mechanism: Requiring buy conditions to be met for two consecutive days can reduce false signals in choppy markets.

  3. Trend Following: By following the direction of price breakouts above EMAs, the strategy can capture medium to long-term trends.

  4. Risk Management: Setting a 20% profit target allows for timely profit-taking.

  5. Flexible Exit Mechanism: Exiting when the price falls below any EMA helps in timely stop-loss.

  6. Visualization: The strategy plots the three EMA lines on the chart, facilitating intuitive market analysis.

Strategy Risks

  1. Lag: EMAs inherently have some lag, which may lead to delayed entry and exit timing.

  2. Poor Performance in Ranging Markets: In sideways markets, the strategy may generate frequent false signals.

  3. Fixed Percentage Take Profit: The 20% fixed take-profit may lead to early exits in strong trends.

  4. Lack of Stop-Loss Mechanism: The strategy doesn’t have a clear stop-loss setting, potentially leading to significant losses in case of sharp reversals.

  5. Parameter Sensitivity: The choice of EMA periods can significantly impact strategy performance.

Strategy Optimization Directions

  1. Introduce Adaptive EMAs: Consider using adaptive EMAs to dynamically adjust moving average periods to suit different market environments.

  2. Incorporate Quantitative Indicators: Combining RSI, MACD, or other indicators can improve entry and exit accuracy.

  3. Optimize Take-Profit and Stop-Loss: Consider using trailing stops or ATR-based dynamic stops to optimize risk management.

  4. Market Environment Filtering: Add trend strength indicators like ADX to execute trades only in strong trend markets.

  5. Phased Position Building and Reduction: Consider establishing and closing positions in multiple phases to reduce single price point risk.

  6. Backtesting Optimization: Conduct backtests on different EMA period combinations to find optimal parameters.

  7. Add Volume Conditions: Consider adding volume confirmation to improve signal reliability.

Conclusion

The Multi-EMA Crossover Trend Following Strategy is a medium to long-term trend following system that combines multiple timeframes. By requiring price breakouts above multiple EMAs with consecutive confirmation, the strategy enhances signal reliability. However, it also has some inherent limitations, such as performance in ranging markets and potential lag. The strategy can be further improved by introducing more technical indicators, optimizing take-profit and stop-loss mechanisms, adding market environment filters, and other methods to enhance stability and profitability. In practical application, thorough backtesting and parameter optimization are necessary, and appropriate adjustments should be made based on specific trading instruments and market characteristics.


/*backtest
start: 2023-06-15 00:00:00
end: 2024-06-20 00:00:00
period: 1d
basePeriod: 1h
exchanges: [{"eid":"Futures_Binance","currency":"BTC_USDT"}]
*/

//@version=5
strategy("EMA Strategy", overlay=true)

// Define EMAs
ema20 = ta.ema(close, 20)
ema50 = ta.ema(close, 50)
ema100 = ta.ema(close, 100)

// Variables to track consecutive days condition
var bool buy_condition = false
var bool prev_buy_condition = false

// Buy condition logic
if (close > ema20 and close > ema50 and close > ema100)
    prev_buy_condition := buy_condition
    buy_condition := true
else
    buy_condition := false

// Buy only if condition is true for 2 consecutive days
buy_signal = buy_condition and prev_buy_condition

// Sell conditions
sell_condition = close < ema20 or close < ema50 or close < ema100 or strategy.netprofit / strategy.equity * 100 >= 20

// Plot EMAs
plot(ema20, color=color.blue, title="EMA 20")
plot(ema50, color=color.red, title="EMA 50")
plot(ema100, color=color.green, title="EMA 100")

// Execute strategy orders
if (buy_signal)
    strategy.entry("Buy", strategy.long)

if (sell_condition)
    strategy.close("Buy")


Related

More