概述
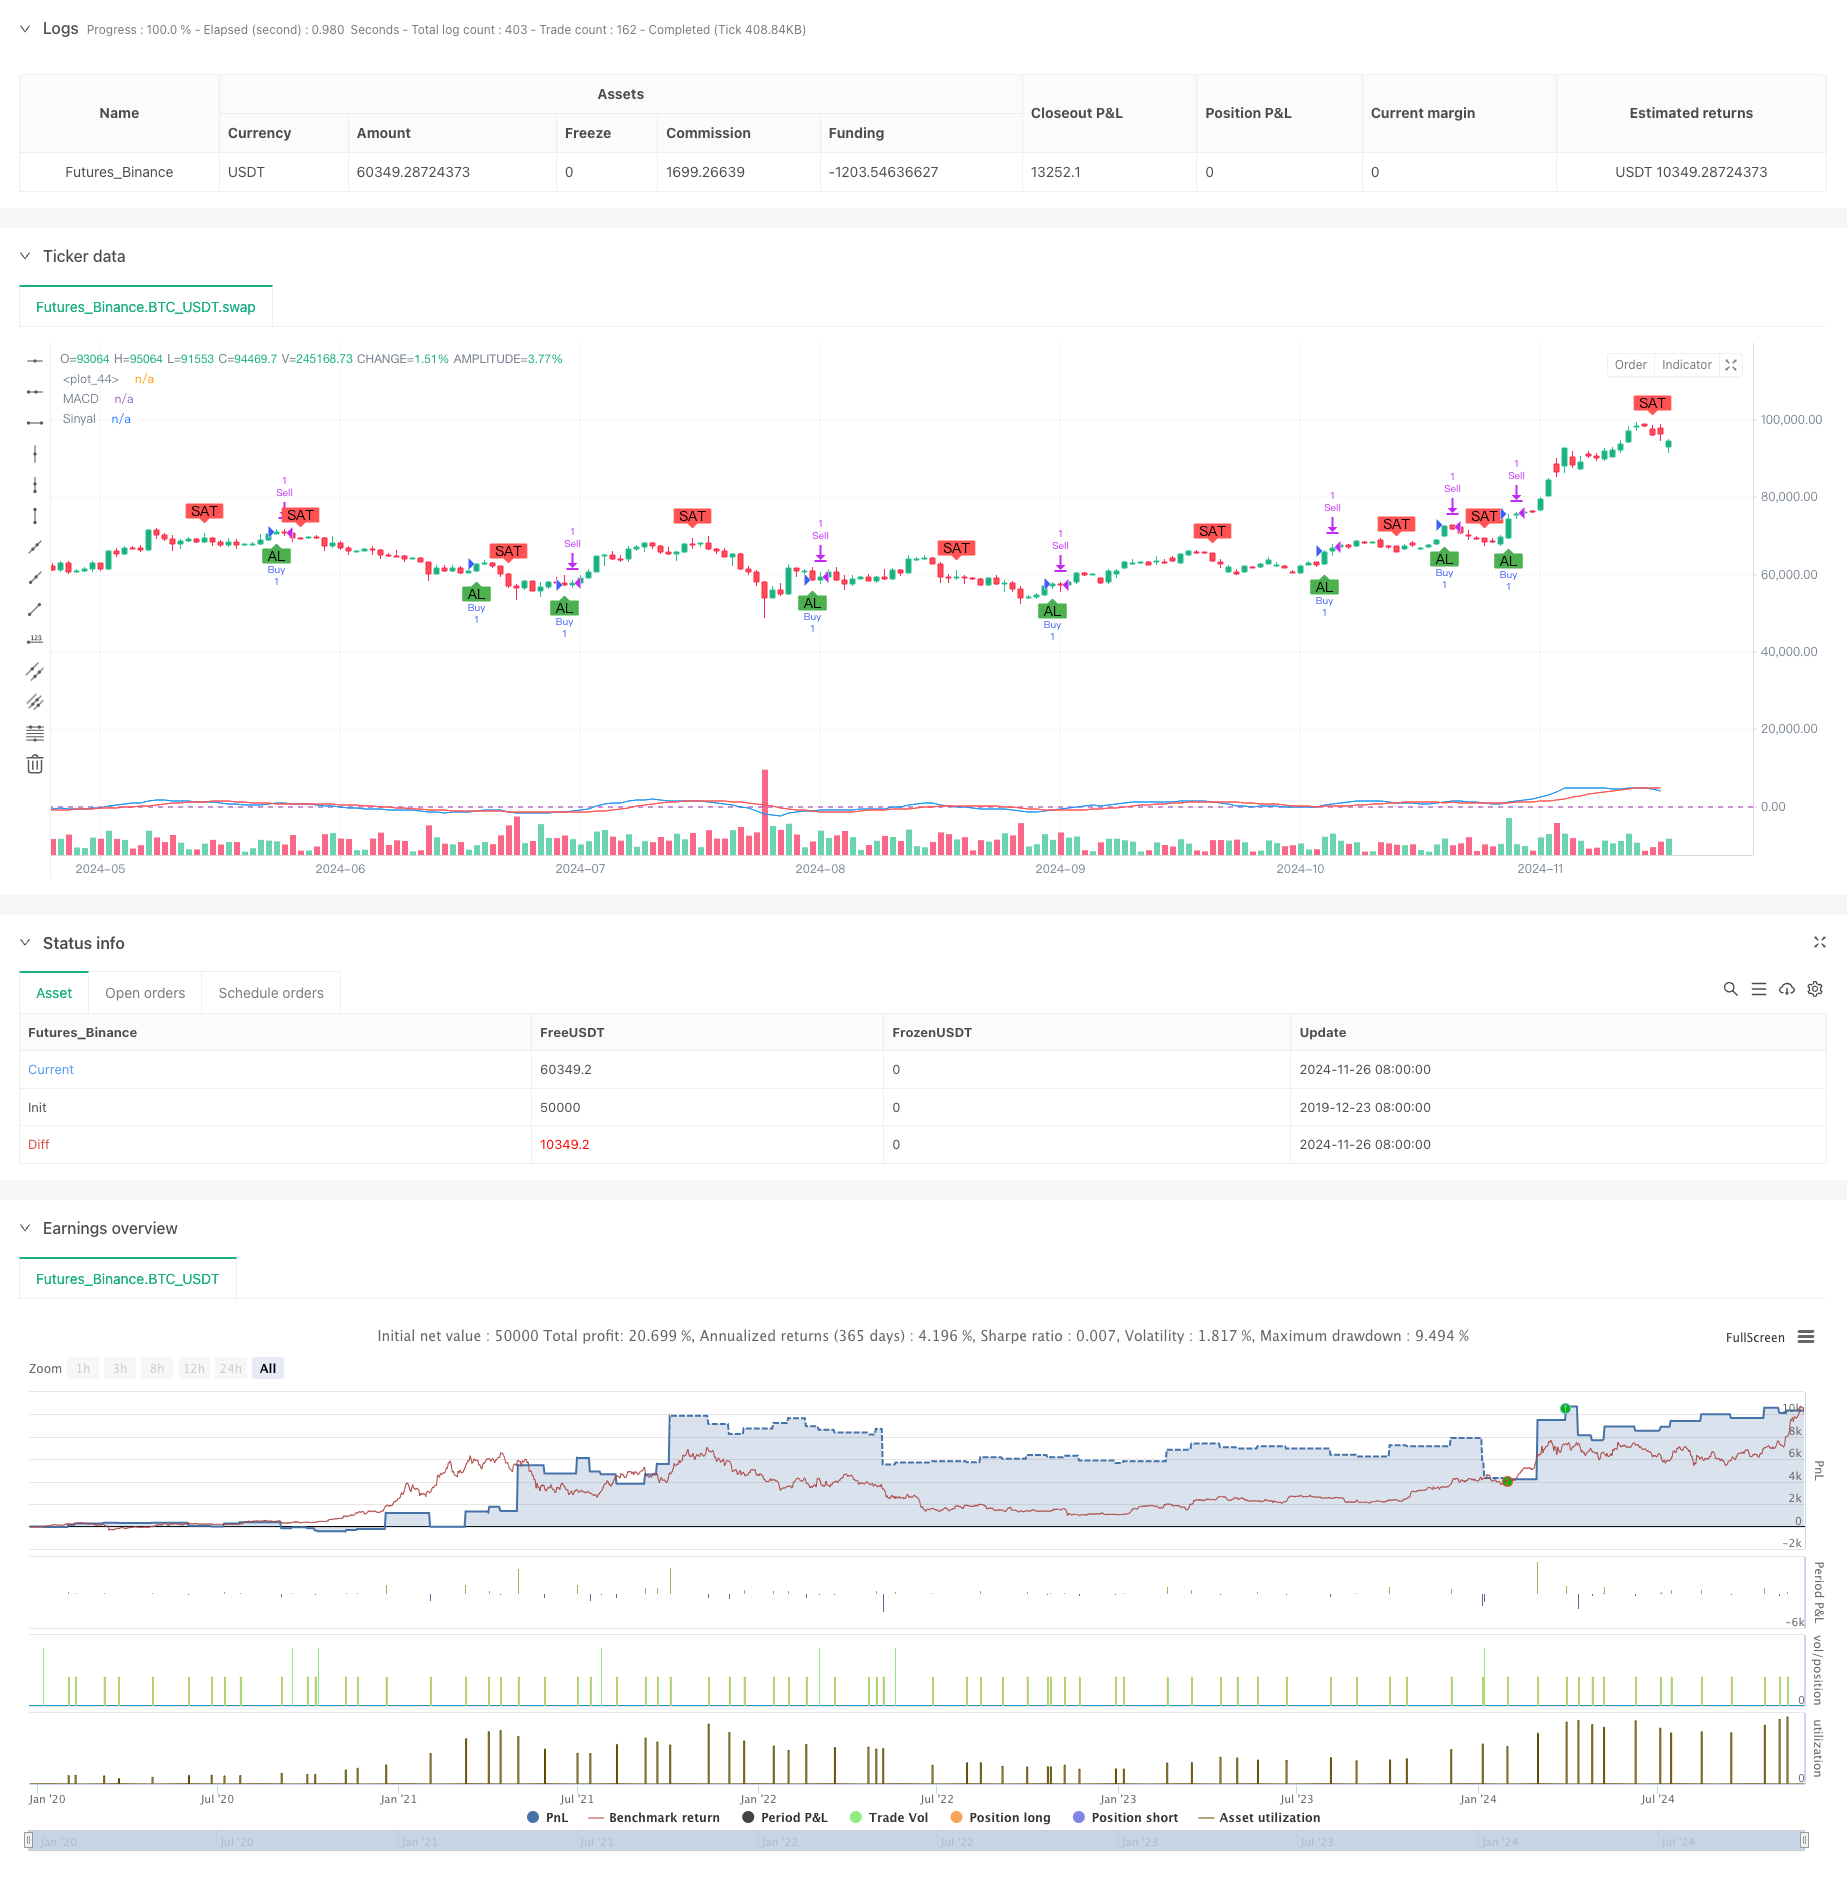
这是一个基于MACD指标的量化交易策略,通过设定特定的时间范围来执行交易。策略核心是利用快速和慢速移动平均线计算MACD值,并与信号线的交叉来确定买卖时机。策略还包含了止损和止盈机制,以控制风险和锁定利润。
策略原理
策略使用8周期和16周期的指数移动平均线(EMA)计算MACD值,并使用11周期的简单移动平均线(SMA)作为信号线。当MACD线上穿信号线时产生买入信号,下穿时产生卖出信号。同时,策略引入了1%的止损和2%的止盈设置,并且只在用户指定的时间范围内(默认2023全年)执行交易。
策略优势
- 时间灵活性强:通过时间范围参数,用户可以精确控制策略的运行周期,便于进行特定时期的回测和实盘交易。
- 风险管理完善:集成了止损和止盈机制,能够有效控制单笔交易的风险暴露。
- 参数可调节性高:主要指标参数均可调整,包括快慢均线周期、信号线周期以及止损止盈比例。
- 信号明确:基于MACD交叉产生的交易信号清晰,易于执行和监控。
策略风险
- 滞后性风险:由于使用均线系统,信号存在一定滞后性,可能错过最佳入场点。
- 振荡市场风险:在横盘震荡市场中可能产生频繁的假信号,导致过度交易。
- 固定止损风险:使用固定百分比止损可能不能很好适应不同市场环境。
- 时间依赖性:策略效果可能受特定时间段市场特征影响,难以保证在所有时期都有稳定表现。
策略优化方向
- 引入趋势过滤器:可添加长周期均线或ATR指标作为趋势确认,减少假信号。
- 动态止损机制:考虑使用ATR或波动率来设置动态止损位,提高止损的适应性。
- 优化信号确认:可以添加成交量、RSI等辅助指标来确认信号有效性。
- 时间周期优化:建议增加多时间周期分析,提高信号可靠性。
- 仓位管理改进:可引入基于波动率的动态仓位管理系统。
总结
这是一个结构完整、逻辑清晰的量化交易策略。通过MACD交叉产生交易信号,配合时间筛选和风险管理,形成了一个实用的交易系统。策略的可调节性强,适合进一步优化和个性化调整。建议交易者在实盘使用前进行充分的回测,并根据具体交易品种和市场环境调整参数。
策略源码
/*backtest
start: 2019-12-23 08:00:00
end: 2024-11-27 00:00:00
period: 1d
basePeriod: 1d
exchanges: [{"eid":"Futures_Binance","currency":"BTC_USDT"}]
*/

// This Pine Script™ code is subject to the terms of the Mozilla Public License 2.0 at https://mozilla.org/MPL/2.0/
// © sergengurgen83

//@version=5
strategy(title="MACD Crossover Strategy with Date Range", shorttitle="MACD Crossover strategys.g", overlay=true)

// Kullanıcı girişleri
fastLength = input.int(8, minval=1, title="Hızlı MA Süresi")
slowLength = input.int(16, minval=1, title="Yavaş MA Süresi")
signalLength = input.int(11, minval=1, title="Sinyal MA Süresi")
stopLossPercent = input.float(1.0, title="Stop-Loss Yüzdesi") / 100
takeProfitPercent = input.float(2.0, title="Kar Al Yüzdesi") / 100

// Tarih aralığı girişleri
startDate = input(timestamp("2023-01-01 00:00"), title="Başlangıç Tarihi")
endDate = input(timestamp("2023-12-31 23:59"), title="Bitiş Tarihi")

// Tarih aralığı kontrolü
inDateRange = true

// Hareketli Ortalamalar ve MACD Hesaplamaları
fastMA = ta.ema(close, fastLength)
slowMA = ta.ema(close, slowLength)
macd = fastMA - slowMA
signal = ta.sma(macd, signalLength)

// Alım ve Satım sinyalleri
buySignal = ta.crossover(macd, signal) and inDateRange
sellSignal = ta.crossunder(macd, signal) and inDateRange

// Strateji kuralları
if (buySignal)
    strategy.entry("Buy", strategy.long)

if (sellSignal)
    strategy.close("Buy")

// Stop-Loss ve Kar Al seviyeleri
strategy.exit("Sell", from_entry="Buy", loss=stopLossPercent * close, profit=takeProfitPercent * close)

// Sinyallerin grafikte gösterilmesi
plot(macd, color=color.blue, title="MACD")
plot(signal, color=color.red, title="Sinyal")
hline(0, color=color.purple, linestyle=hline.style_dashed)

plotshape(series=buySignal, location=location.belowbar, color=color.green, style=shape.labelup, title="Al", text="AL")
plotshape(series=sellSignal, location=location.abovebar, color=color.red, style=shape.labeldown, title="Sat", text="SAT")
相关推荐