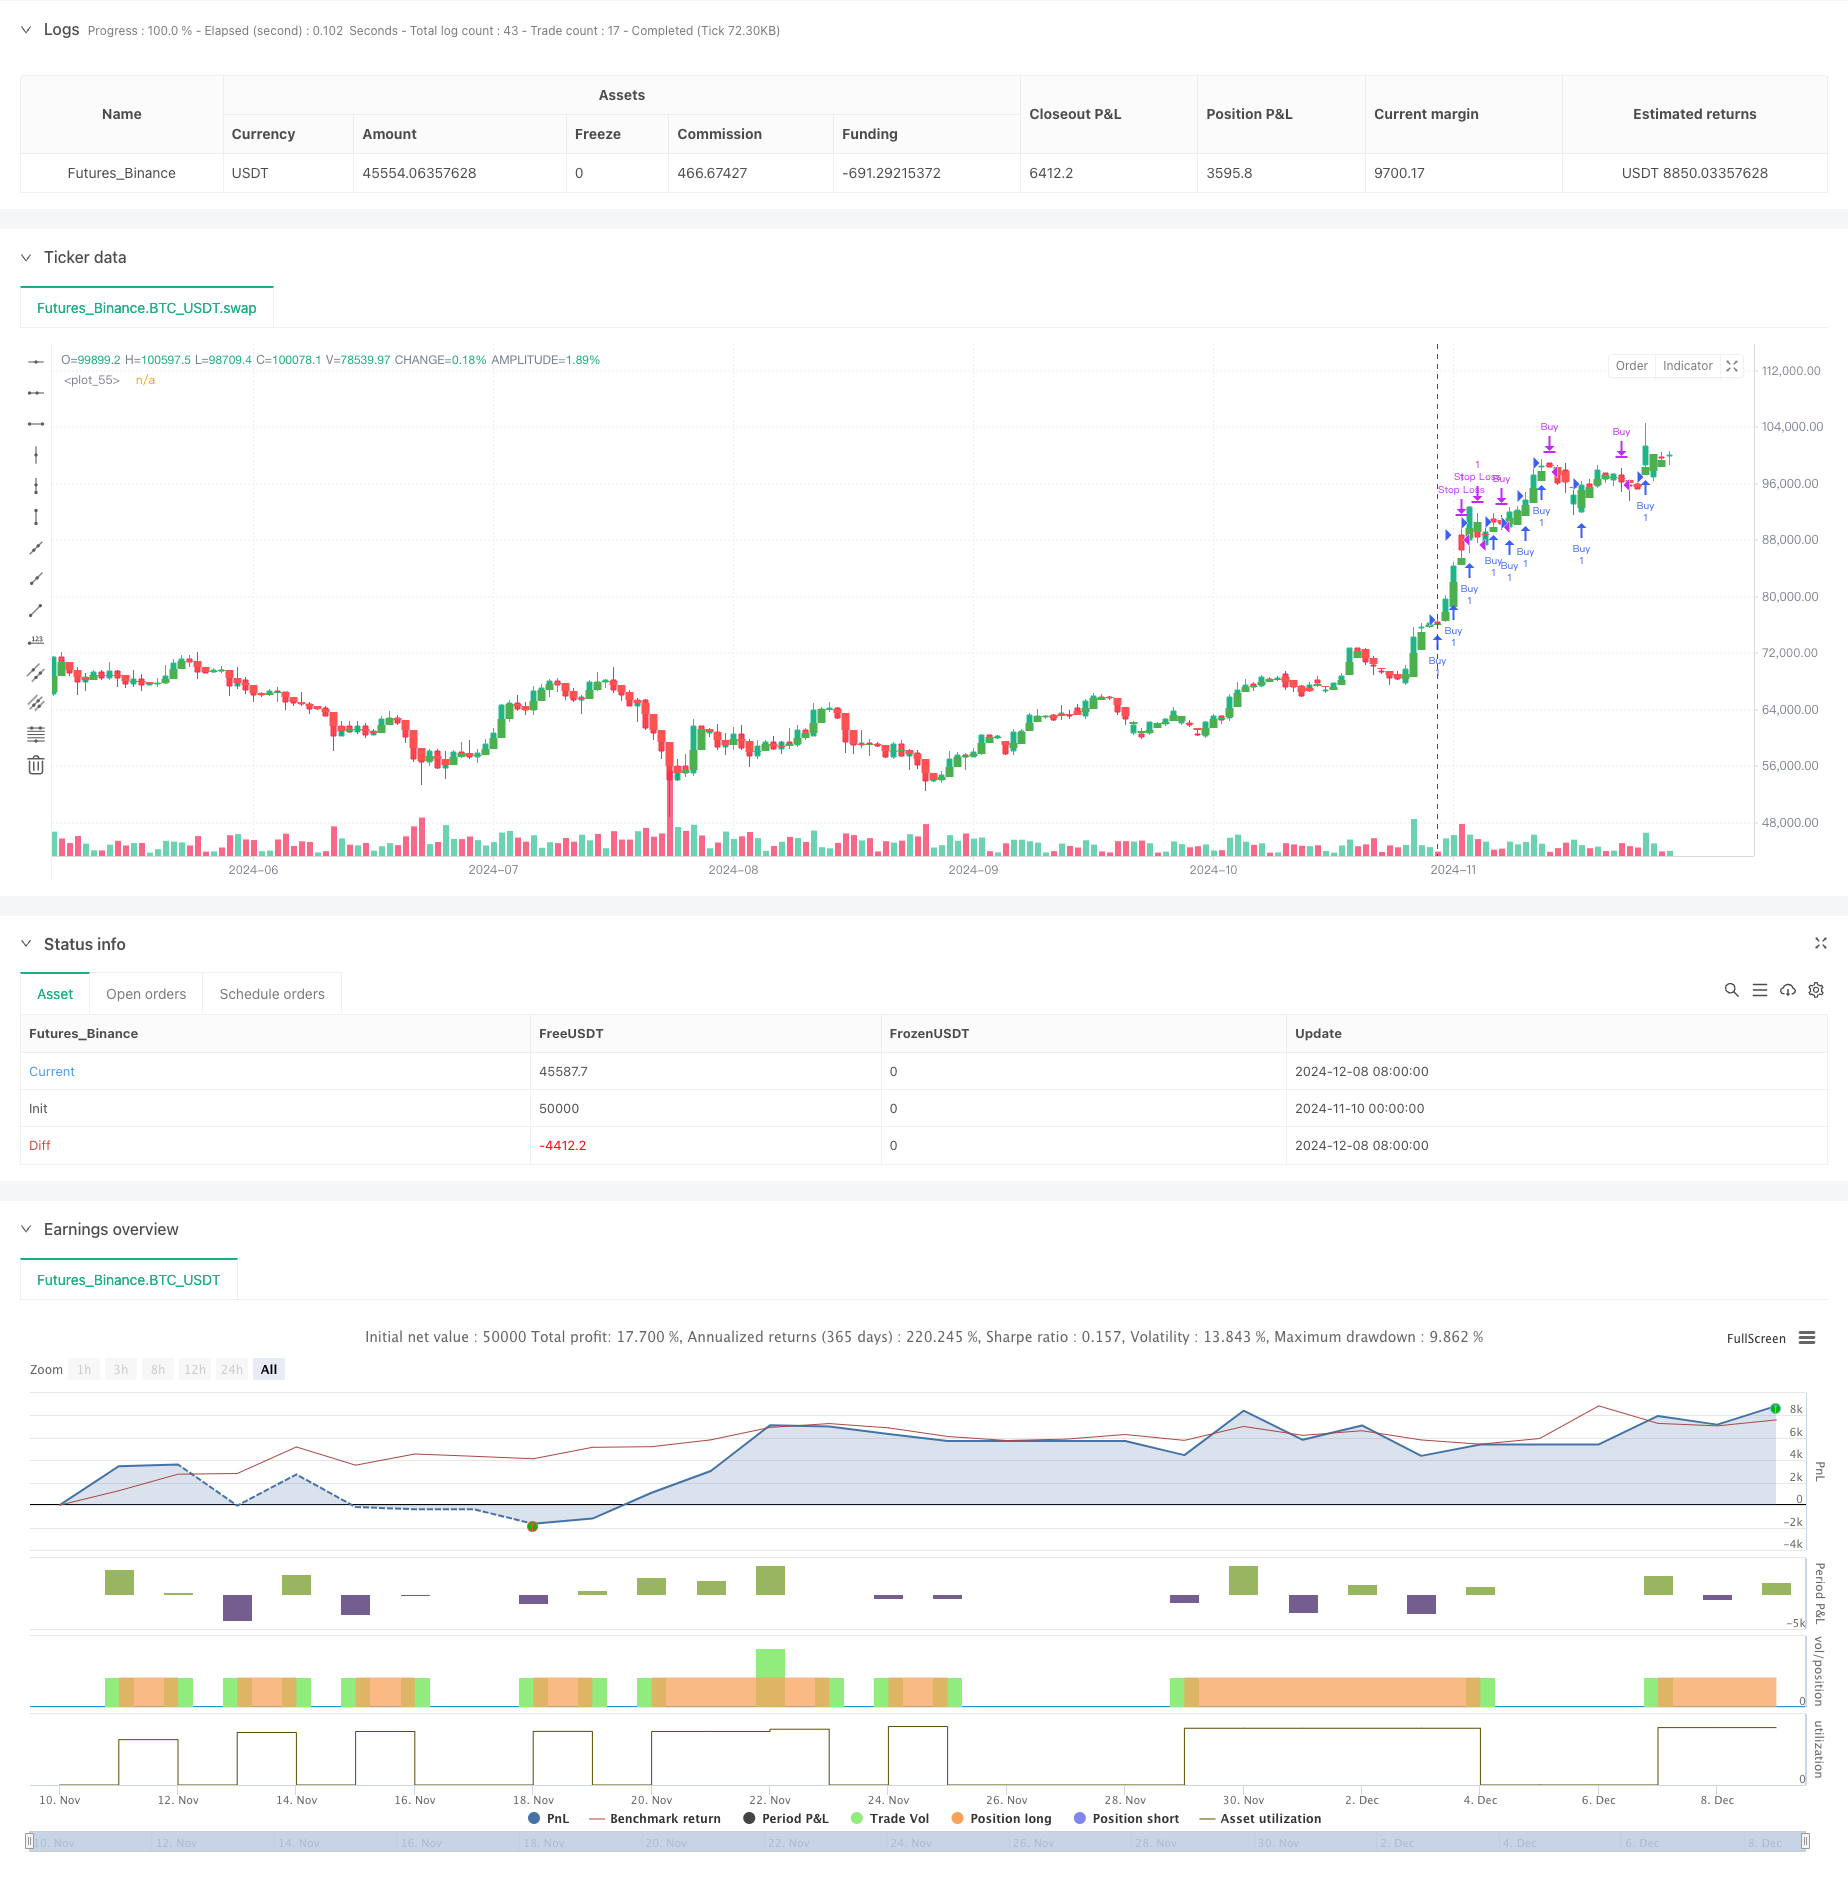
概述
本策略是一个基于平滑Heikin Ashi蜡烛图的趋势跟踪系统。通过在较高时间周期计算Heikin Ashi蜡烛图,并将其应用于较低时间周期的交易决策中,有效降低了市场噪音的影响。策略提供了灵活的交易方向选择,可以只做多、只做空或双向交易,并集成了止损止盈功能,实现了全自动化的交易过程。
策略原理
策略的核心逻辑是利用Heikin Ashi蜡烛图在高时间周期的平滑特性来识别趋势。Heikin Ashi蜡烛图通过对开盘价和收盘价进行移动平均计算,能够有效过滤市场噪音,突出显示主要趋势。当出现绿色蜡烛时代表上升趋势,系统会在做多模式下开仓;当出现红色蜡烛时代表下降趋势,系统会在做空模式下开仓。策略还包含了基于百分比的止损和止盈机制,帮助控制风险和锁定利润。
策略优势
- 多周期结合降低假信号:通过在较高时间周期计算Heikin Ashi指标,有效减少了短期波动带来的干扰。
- 风险管理完善:集成了止损止盈功能,可以根据市场波动率灵活调整参数。
- 方向选择灵活:可以根据市场特点选择只做多、只做空或双向交易。
- 全自动化运作:策略逻辑清晰,参数可调,适合自动化交易。
- 适应性强:可应用于不同市场和时间周期,具有良好的普适性。
策略风险
- 趋势反转风险:在趋势转向时可能出现较大回撤,需要合理设置止损。
- 震荡市场风险:在横盘震荡市场中可能频繁交易导致损失。
- 参数优化风险:过度优化可能导致策略在实盘中表现不佳。
- 滑点成本风险:频繁交易可能带来较高的交易成本。
策略优化方向
- 增加趋势确认指标:可以引入其他技术指标如RSI或MACD作为辅助确认。
- 优化止损机制:可以实现跟踪止损或基于波动率的动态止损。
- 引入交易量分析:结合成交量指标提高入场信号的可靠性。
- 开发自适应参数:根据市场波动率自动调整止损止盈比例。
- 增加时间过滤:避免在非交易活跃时段频繁交易。
总结
该策略通过多周期Heikin Ashi指标的平滑特性,有效捕捉市场趋势,并通过完善的风险管理机制控制回撤。策略的灵活性和可扩展性使其具有良好的实用价值,通过持续优化和改进,能够适应不同市场环境。虽然存在一定的风险,但通过合理的参数设置和风险管理,可以实现稳定的交易表现。
策略源码
/*backtest
start: 2024-11-10 00:00:00
end: 2024-12-09 08:00:00
period: 1d
basePeriod: 1d
exchanges: [{"eid":"Futures_Binance","currency":"BTC_USDT"}]
*/

//@version=5
strategy("Optimized Heikin Ashi Strategy with Buy/Sell Options", overlay=true)

// User inputs for customizing backtest settings
startDate = input(timestamp("2023-01-01 00:00"), title="Backtest Start Date", tooltip="Start date for the backtest")
endDate = input(timestamp("2024-01-01 00:00"), title="Backtest End Date", tooltip="End date for the backtest")

// Input for Heikin Ashi timeframe optimization
ha_timeframe = input.timeframe("D", title="Heikin Ashi Timeframe", tooltip="Choose the timeframe for Heikin Ashi candles")

// Inputs for optimizing stop loss and take profit
use_stop_loss = input.bool(true, title="Use Stop Loss")
stop_loss_percent = input.float(2.0, title="Stop Loss (%)", minval=0.0, tooltip="Set stop loss percentage")
use_take_profit = input.bool(true, title="Use Take Profit")
take_profit_percent = input.float(4.0, title="Take Profit (%)", minval=0.0, tooltip="Set take profit percentage")

// Input to choose Buy or Sell
trade_type = input.string("Buy Only", options=["Buy Only", "Sell Only"], title="Trade Type", tooltip="Choose whether to only Buy or only Sell")

// Heikin Ashi calculation on a user-defined timeframe
ha_open = request.security(syminfo.tickerid, ha_timeframe, ta.sma(open, 2), barmerge.gaps_off, barmerge.lookahead_on)
ha_close = request.security(syminfo.tickerid, ha_timeframe, ta.sma(close, 2), barmerge.gaps_off, barmerge.lookahead_on)
ha_high = request.security(syminfo.tickerid, ha_timeframe, math.max(high, close), barmerge.gaps_off, barmerge.lookahead_on)
ha_low = request.security(syminfo.tickerid, ha_timeframe, math.min(low, open), barmerge.gaps_off, barmerge.lookahead_on)

// Heikin Ashi candle colors
ha_bullish = ha_close > ha_open // Green candle
ha_bearish = ha_close < ha_open // Red candle

// Backtest period filter
inDateRange = true

// Trading logic depending on user input
if (inDateRange)  // Ensures trades happen only in the selected period
    if (trade_type == "Buy Only")  // Buy when green, Sell when red
        if (ha_bullish and strategy.position_size <= 0)  // Buy on green candle only if no position is open
            strategy.entry("Buy", strategy.long)
        if (ha_bearish and strategy.position_size > 0)  // Sell on red candle (close the long position)
            strategy.close("Buy")

    if (trade_type == "Sell Only")  // Sell when red, Exit sell when green
        if (ha_bearish and strategy.position_size >= 0)  // Sell on red candle only if no position is open
            strategy.entry("Sell", strategy.short)
        if (ha_bullish and strategy.position_size < 0)  // Exit the sell position on green candle
            strategy.close("Sell")

// Add Stop Loss and Take Profit conditions if enabled
if (use_stop_loss)
    strategy.exit("Stop Loss", from_entry="Buy", stop=strategy.position_avg_price * (1 - stop_loss_percent / 100))

if (use_take_profit)
    strategy.exit("Take Profit", from_entry="Buy", limit=strategy.position_avg_price * (1 + take_profit_percent / 100))

// Plot Heikin Ashi candles on the chart
plotcandle(ha_open, ha_high, ha_low, ha_close, color=ha_bullish ? color.green : color.red)
相关推荐