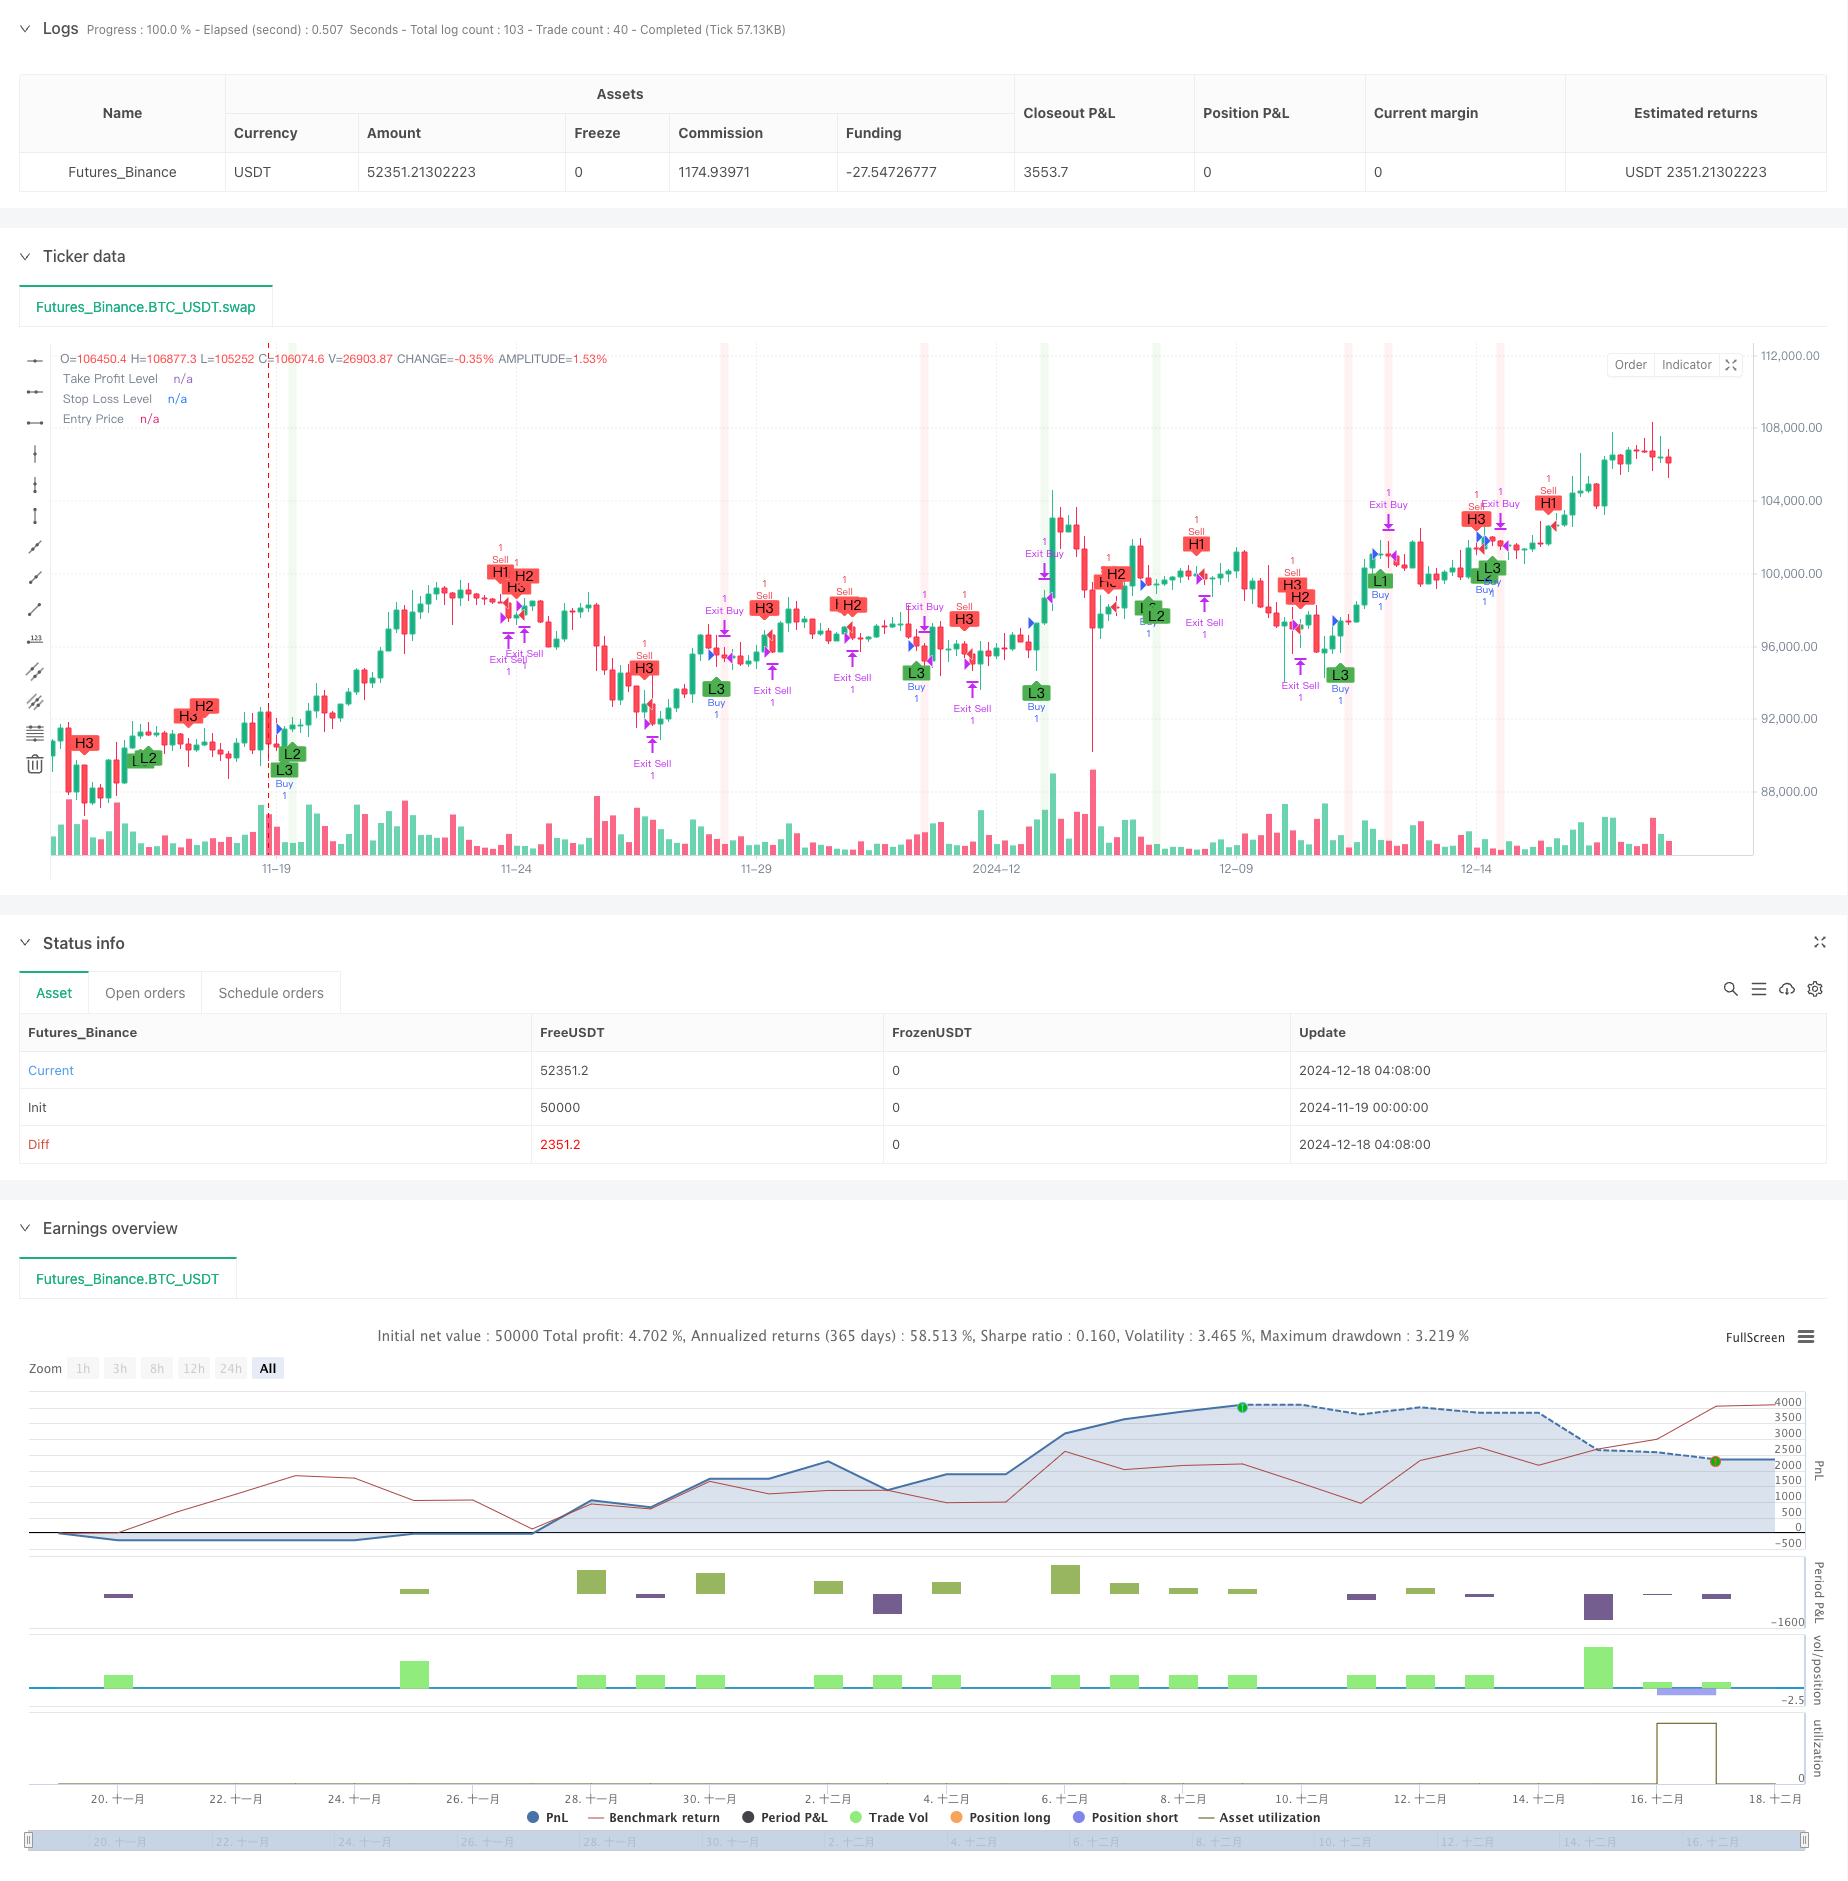
多时间周期流动性枢纽热力图量化策略
Author: ChaoZhang, Date: 2024-12-20 14:20:11Tags: MTF

概述
该策略是一个基于多时间周期流动性枢纽点检测的量化交易系统。它通过分析三个不同时间周期(15分钟、1小时和4小时)的价格行为,识别关键的支撑和阻力水平,并在此基础上进行交易决策。系统集成了资金管理功能,包括固定金额的止盈止损设置,同时提供直观的视觉反馈,帮助交易者更好地理解市场结构。
策略原理
策略的核心是通过ta.pivothigh和ta.pivotlow函数在多个时间周期上检测价格枢纽点。对于每个时间周期,系统使用左右参考K线数(默认为7)来确定显著的高点和低点。当任一时间周期出现新的枢纽低点时,系统生成做多信号;出现新的枢纽高点时,系统生成做空信号。交易执行采用固定金额的止盈止损管理,通过moneyToSLPoints函数将美元金额转换为相应的点数。
策略优势
- 多时间周期分析提供了更全面的市场视角,有助于捕捉不同级别的交易机会
- 基于枢纽点的交易逻辑具有solid的技术分析基础,便于理解和执行
- 集成的资金管理功能可以有效控制每笔交易的风险
- 可视化界面直观显示交易状态,包括位置、止盈止损水平以及盈亏区域
- 策略参数可调,适应性强,能够根据不同市场条件进行优化
策略风险
- 多时间周期信号可能产生冲突,需要建立合理的信号优先级机制
- 固定金额的止盈止损可能不适合所有市场条件,建议根据波动性动态调整
- 枢纽点检测的滞后性可能导致入场时机偏后
- 在剧烈波动期间,可能出现虚假突破信号
- 需要注意不同时间周期的流动性差异
策略优化方向
- 引入波动率指标,动态调整止盈止损水平
- 添加交易量确认机制,提高枢纽点的可靠性
- 开发时间周期优先级系统,解决信号冲突问题
- 整合趋势过滤器,避免在横盘市场过度交易
- 考虑添加价格结构分析,提高入场时机的准确性
总结
多时间周期流动性枢纽热力图量化策略是一个结构完整、逻辑清晰的交易系统。它通过多维度的市场分析和严格的风险管理,为交易者提供了一个可靠的交易框架。虽然存在一些固有的风险和限制,但通过持续优化和改进,该策略有望在各种市场环境下保持稳定的表现。
/*backtest
start: 2024-11-19 00:00:00
end: 2024-12-18 08:00:00
period: 4h
basePeriod: 4h
exchanges: [{"eid":"Futures_Binance","currency":"BTC_USDT"}]
*/

// This Pine Script™ code is subject to the terms of the Mozilla Public License 2.0 at https://mozilla.org/MPL/2.0/
// © pmotta41
//@version=5
strategy("GPT Session Liquidity Heatmap Strategy", overlay=true)

// Inputs
timeframe1 = input.timeframe("15", title="Intraday Timeframe 1")
timeframe2 = input.timeframe("60", title="Intraday Timeframe 2")
timeframe3 = input.timeframe("240", title="Higher Timeframe")
leftBars = input.int(7, title="Left Bars for Pivot", minval=2, maxval=20)
rightBars = input.int(7, title="Right Bars for Pivot", minval=2, maxval=20)
takeProfitDollar = input(200, title="Take Profit $$")
stopLossDollar = input(100, title="Stop Loss $$")

// Pivot Detection Function
detectPivot(highs, lows, left, right) =>
    pivotHigh = ta.pivothigh(highs, left, right)
    pivotLow = ta.pivotlow(lows, left, right)
    [pivotHigh, pivotLow]

// Get Pivots from Different Timeframes
[pivotHigh1, pivotLow1] = request.security(syminfo.tickerid, timeframe1, detectPivot(high, low, leftBars, rightBars))
[pivotHigh2, pivotLow2] = request.security(syminfo.tickerid, timeframe2, detectPivot(high, low, leftBars, rightBars))
[pivotHigh3, pivotLow3] = request.security(syminfo.tickerid, timeframe3, detectPivot(high, low, leftBars, rightBars))

// Plot Pivots
plotshape(series=pivotHigh1, title="Pivot High 1", location=location.abovebar, color=color.red, style=shape.labeldown, text="H1")
plotshape(series=pivotLow1, title="Pivot Low 1", location=location.belowbar, color=color.green, style=shape.labelup, text="L1")
plotshape(series=pivotHigh2, title="Pivot High 2", location=location.abovebar, color=color.red, style=shape.labeldown, text="H2")
plotshape(series=pivotLow2, title="Pivot Low 2", location=location.belowbar, color=color.green, style=shape.labelup, text="L2")
plotshape(series=pivotHigh3, title="Pivot High 3", location=location.abovebar, color=color.red, style=shape.labeldown, text="H3")
plotshape(series=pivotLow3, title="Pivot Low 3", location=location.belowbar, color=color.green, style=shape.labelup, text="L3")

// Strategy Logic
buyCondition = pivotLow1 or pivotLow2 or pivotLow3
sellCondition = pivotHigh1 or pivotHigh2 or pivotHigh3

if (buyCondition)
    strategy.entry("Buy", strategy.long)

if (sellCondition)
    strategy.entry("Sell", strategy.short)

// Function to Convert $$ to Points for Stop Loss and Take Profit
moneyToSLPoints(money) =>
    strategy.position_size != 0 ? (money / syminfo.pointvalue / math.abs(strategy.position_size)) / syminfo.mintick : na

p = moneyToSLPoints(takeProfitDollar)
l = moneyToSLPoints(stopLossDollar)

// Exit Conditions
strategy.exit("Exit Buy", from_entry="Buy", profit=p, loss=l)
strategy.exit("Exit Sell", from_entry="Sell", profit=p, loss=l)

// Visualization for Stop Loss and Take Profit Levels
pointsToPrice(pp) =>
    na(pp) ? na : strategy.position_avg_price + pp * math.sign(strategy.position_size) * syminfo.mintick

tp = plot(pointsToPrice(p), style=plot.style_linebr, color=color.green, title="Take Profit Level")
sl = plot(pointsToPrice(-l), style=plot.style_linebr, color=color.red, title="Stop Loss Level")
avg = plot(strategy.position_avg_price, style=plot.style_linebr, color=color.blue, title="Entry Price")
fill(tp, avg, color=color.new(color.green, 90), title="Take Profit Area")
fill(avg, sl, color=color.new(color.red, 90), title="Stop Loss Area")

// Background for Gain/Loss
gainBackground = strategy.position_size > 0 and close > strategy.position_avg_price
lossBackground = strategy.position_size > 0 and close < strategy.position_avg_price
bgcolor(gainBackground ? color.new(color.green, 90) : na, title="Gain Background")
bgcolor(lossBackground ? color.new(color.red, 90) : na, title="Loss Background")
相关内容
- 多时间周期Supertrend趋势交易策略的动态组合算法
- 多时间周期动态止损EMA-Squeeze交易策略
- 多周期平滑Heikin Ashi趋势跟踪量化交易系统
- 多时段Bollinger动量突破策略结合Hull均线策略
- 基于布林带和蜡烛图形态的动态波动率交易策略
- 多周期趋势跟踪与ATR波动率管理策略
- 多重时间框架趋势跟踪交易系统(MTF-ATR-MACD)
- 多周期确认的移动平均线与RSI趋势交易策略
- Order Block Finder
更多内容
- 动态趋势动量优化策略结合G通道指标
- 多层级跌幅ATH动态追踪三段买入策略
- 自适应VWAP波段基于Garman-Klass波动率动态跟踪策略
- 多指标趋势跟踪期权交易EMA交叉策略
- 多重指标波动率交易RSI-EMA-ATR策略
- 基于G通道和指数移动平均的量化多空转换策略
- 双均线趋势跟踪与风险控制策略
- 三重超趋势与布林带融合的多指标趋势跟踪策略
- 多重趋势线突破交叉量化策略
- 基于RSI动量和ADX趋势强度的资金管理系统
- 多重时框趋势追踪与ATR止盈止损策略
- 高级趋势追踪与自适应跟踪止损策略
- 多重技术指标趋势跟踪与动量RSI过滤交易策略
- 动态风险管理的指数均线交叉策略
- 双指数移动平均线与相对强弱指数交叉策略
- 双重动量振荡器智能择时交易策略
- 高级量化趋势捕捉策略结合动态范围过滤器
- TradingView信号执行策略(内建Http服务版本)
- 基于RSI和MACD的五日内交叉灵活入场策略优化版本研究
- 基于双RSI指标的自适应波段交易系统