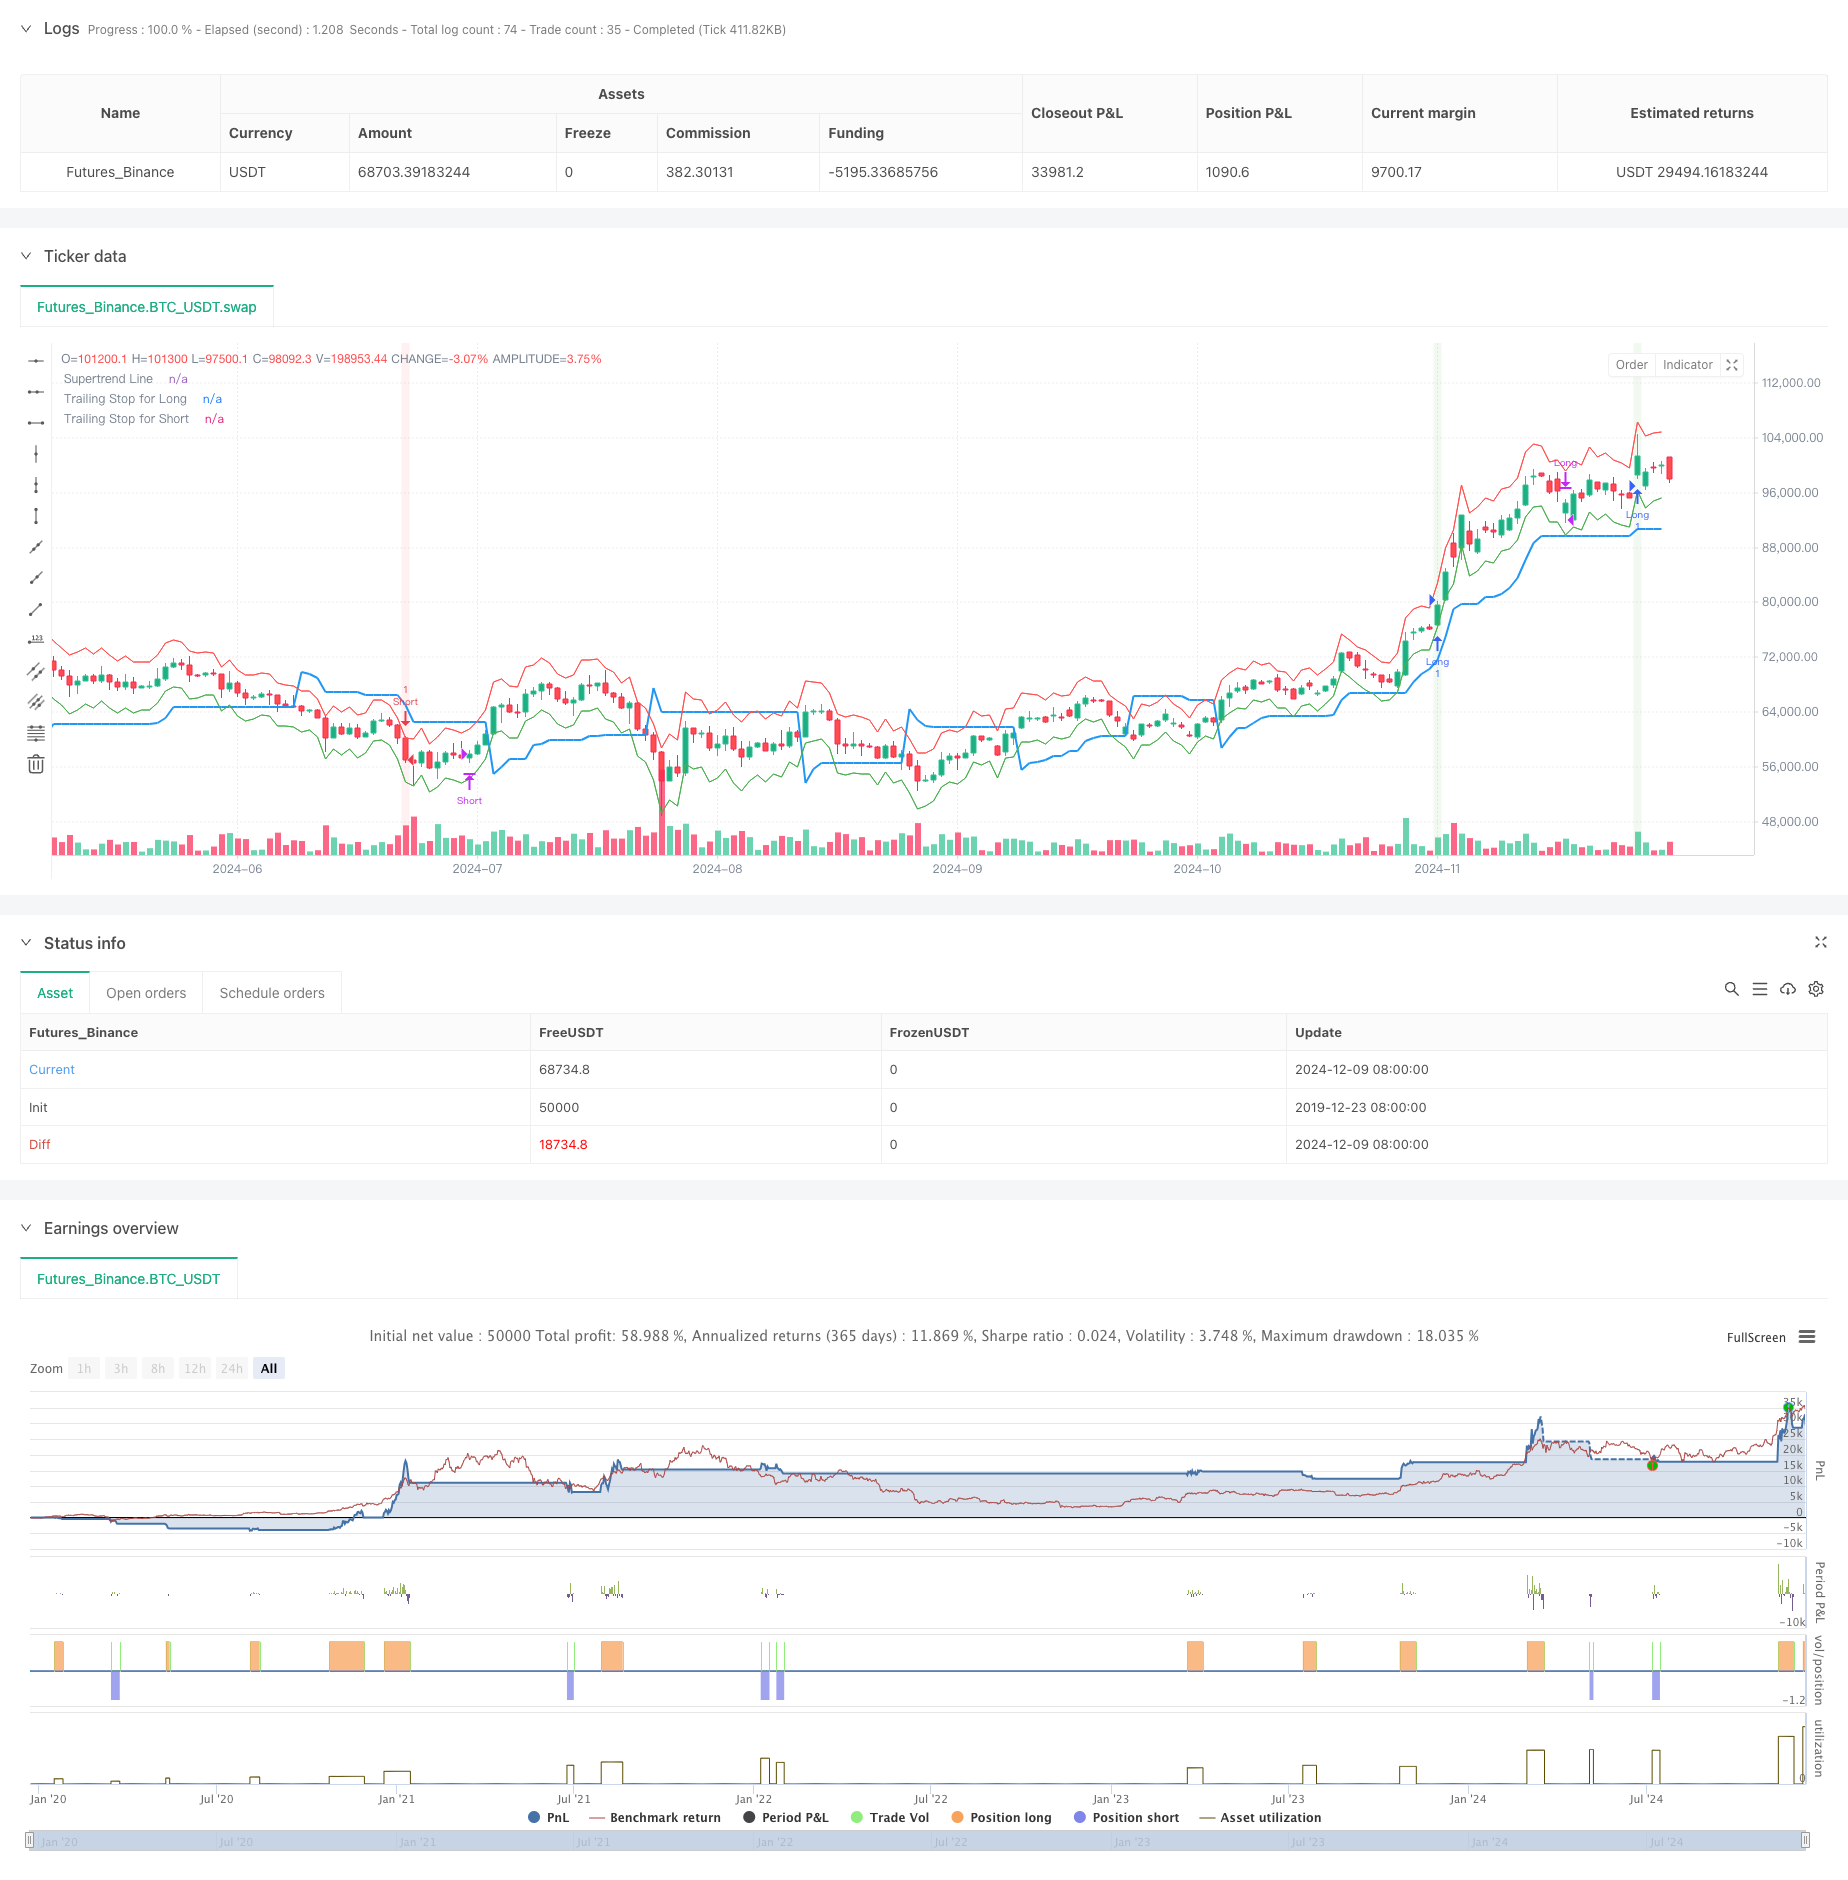
概述
该策略是一个基于多技术指标的趋势追踪交易系统,结合了布林带、趋势指标、动量指标和波动率指标,通过量价配合来进行交易决策。策略采用布林带突破作为主要入场信号,同时结合 ADX 趋势强度确认和成交量突破验证,使用 MACD 和 ATR trailing stop 作为出场机制。
策略原理
策略的核心逻辑基于以下几个方面: 1. 使用布林带(Bollinger Bands)作为价格波动区间的参考,当价格突破上轨时寻找做多机会,突破下轨时寻找做空机会 2. 通过 ADX 指标判断趋势强度,只有在趋势足够强(ADX>25)时才开仓 3. 要求成交量出现放量(高于20日均量1.5倍)确认价格突破的有效性 4. 使用 SuperTrend 指标作为趋势方向过滤,只在价格在趋势线正确一侧时开仓 5. 采用 MACD 死叉、ATR 移动止损或 ADX 转弱作为离场条件
策略优势
- 多重信号配合提高了交易的准确性,有效降低了虚假突破带来的风险
- 通过 ADX 和成交量确认,提高了趋势交易的胜率
- 动态止损机制(ATR trailing stop)能够在保护利润的同时给趋势以足够发展空间
- 结合了趋势跟踪和反转策略的优点,既能捕捉大趋势,又不会错过重要反转机会
- 具有完善的风险控制机制,包括趋势强度确认、量价配合和动态止损
策略风险
- 在震荡市场中可能产生频繁的虚假信号,导致连续止损
- 多重条件叠加可能导致错过一些重要的交易机会
- ATR 止损在波动率突然放大时可能会过早止损
- 依赖趋势的持续性,在趋势突然反转时可能会有较大回撤
- 需要较大的样本量来验证策略的有效性
策略优化方向
- 考虑加入市场环境判断机制,在不同市场条件下使用不同的参数组合
- 可以引入时间过滤,避开一些已知的高波动时段
- 对止损参数进行优化,在不同波动率环境下动态调整 ATR 乘数
- 增加对成交量的分析深度,考虑成交量的质量而不仅仅是数量
- 可以考虑加入更多的市场情绪指标来提高信号的可靠性
总结
这是一个设计完善的多指标趋势追踪策略,通过布林带、ADX、SuperTrend、MACD 等指标的有机结合,构建了一个兼具趋势跟踪和风险控制的交易系统。策略的优势在于多重信号确认和完善的风险控制机制,但同时也面临着过度优化和参数敏感性的挑战。通过持续优化和市场环境的动态适应,该策略有望在不同市场环境下都能保持稳定的表现。
策略源码
/*backtest
start: 2019-12-23 08:00:00
end: 2024-12-10 08:00:00
period: 1d
basePeriod: 1d
exchanges: [{"eid":"Futures_Binance","currency":"BTC_USDT"}]
*/

//@version=5
strategy("Nifty Options Trendy Markets with TSL", overlay=true)
// Input Parameters
lengthBB = input(20, title="Bollinger Bands Length")
multBB = input(2.0, title="Bollinger Bands Multiplier")
adxLength = input(14, title="ADX Length")
adxThreshold = input(25, title="ADX Entry Threshold")
adxExitThreshold = input(20, title="ADX Exit Threshold")
superTrendLength = input(10, title="Supertrend Length")
superTrendMultiplier = input(3.0, title="Supertrend Multiplier")
macdFast = input(12, title="MACD Fast Length")
macdSlow = input(26, title="MACD Slow Length")
macdSignal = input(9, title="MACD Signal Length")
atrLength = input(14, title="ATR Length")
atrMultiplier = input(1.5, title="Trailing Stop ATR Multiplier")
volumeSpikeMultiplier = input(1.5, title="Volume Spike Multiplier")

// Calculations
[macdLine, signalLine,_ ] = ta.macd(close, macdFast, macdSlow, macdSignal)
macdCrossover = ta.crossover(macdLine, signalLine)
macdCrossunder = ta.crossunder(macdLine, signalLine)
[middleBB,upperBB,lowerBB] = ta.bb(close, lengthBB, multBB)
[supertrend, direction]  = ta.supertrend(superTrendMultiplier,superTrendLength)
len = input.int(17, minval=1, title="DI Length")
lensig = input.int(14, title="ADX Smoothing", minval=1, maxval=50)
[diplus, diminus, adx] = ta.dmi(len, lensig)
atr = ta.atr(atrLength)
trailingStopLong = close - atr * atrMultiplier // For long trades
trailingStopShort = close + atr * atrMultiplier // For short trades
volumeSpike = volume > ta.sma(volume, 20) * volumeSpikeMultiplier

// Entry Conditions
longEntry = ta.crossover(close, upperBB) and adx > adxThreshold and volumeSpike and close > supertrend
shortEntry = ta.crossunder(close, lowerBB) and adx > adxThreshold and volumeSpike and close < supertrend

// Exit Conditions
longExit = ta.crossunder(macdLine, signalLine) or close < trailingStopLong or adx < adxExitThreshold
shortExit = ta.crossover(macdLine, signalLine) or close > trailingStopShort or adx < adxExitThreshold

// Strategy Entries and Exits
if (longEntry)
    strategy.entry("Long", strategy.long)
if (shortEntry)
    strategy.entry("Short", strategy.short)
if (longExit)
    strategy.close("Long")
if (shortExit)
    strategy.close("Short")

// Plotting
plot(supertrend, color=color.blue, style=plot.style_line, linewidth=2, title="Supertrend Line")
plot(trailingStopLong, title="Trailing Stop for Long", color=color.green, style=plot.style_line)
plot(trailingStopShort, title="Trailing Stop for Short", color=color.red, style=plot.style_line)
bgcolor(longEntry ? color.new(color.green, 90) : shortEntry ? color.new(color.red, 90) : na, title="Background for Entry")

// Alerts
alertcondition(longEntry, title="Long Entry", message="Buy Call: Long entry conditions met")
alertcondition(shortEntry, title="Short Entry", message="Buy Put: Short entry conditions met")
alertcondition(longExit, title="Long Exit", message="Exit Call: Long exit conditions met")
alertcondition(shortExit, title="Short Exit", message="Exit Put: Short exit conditions met")
相关推荐