概述
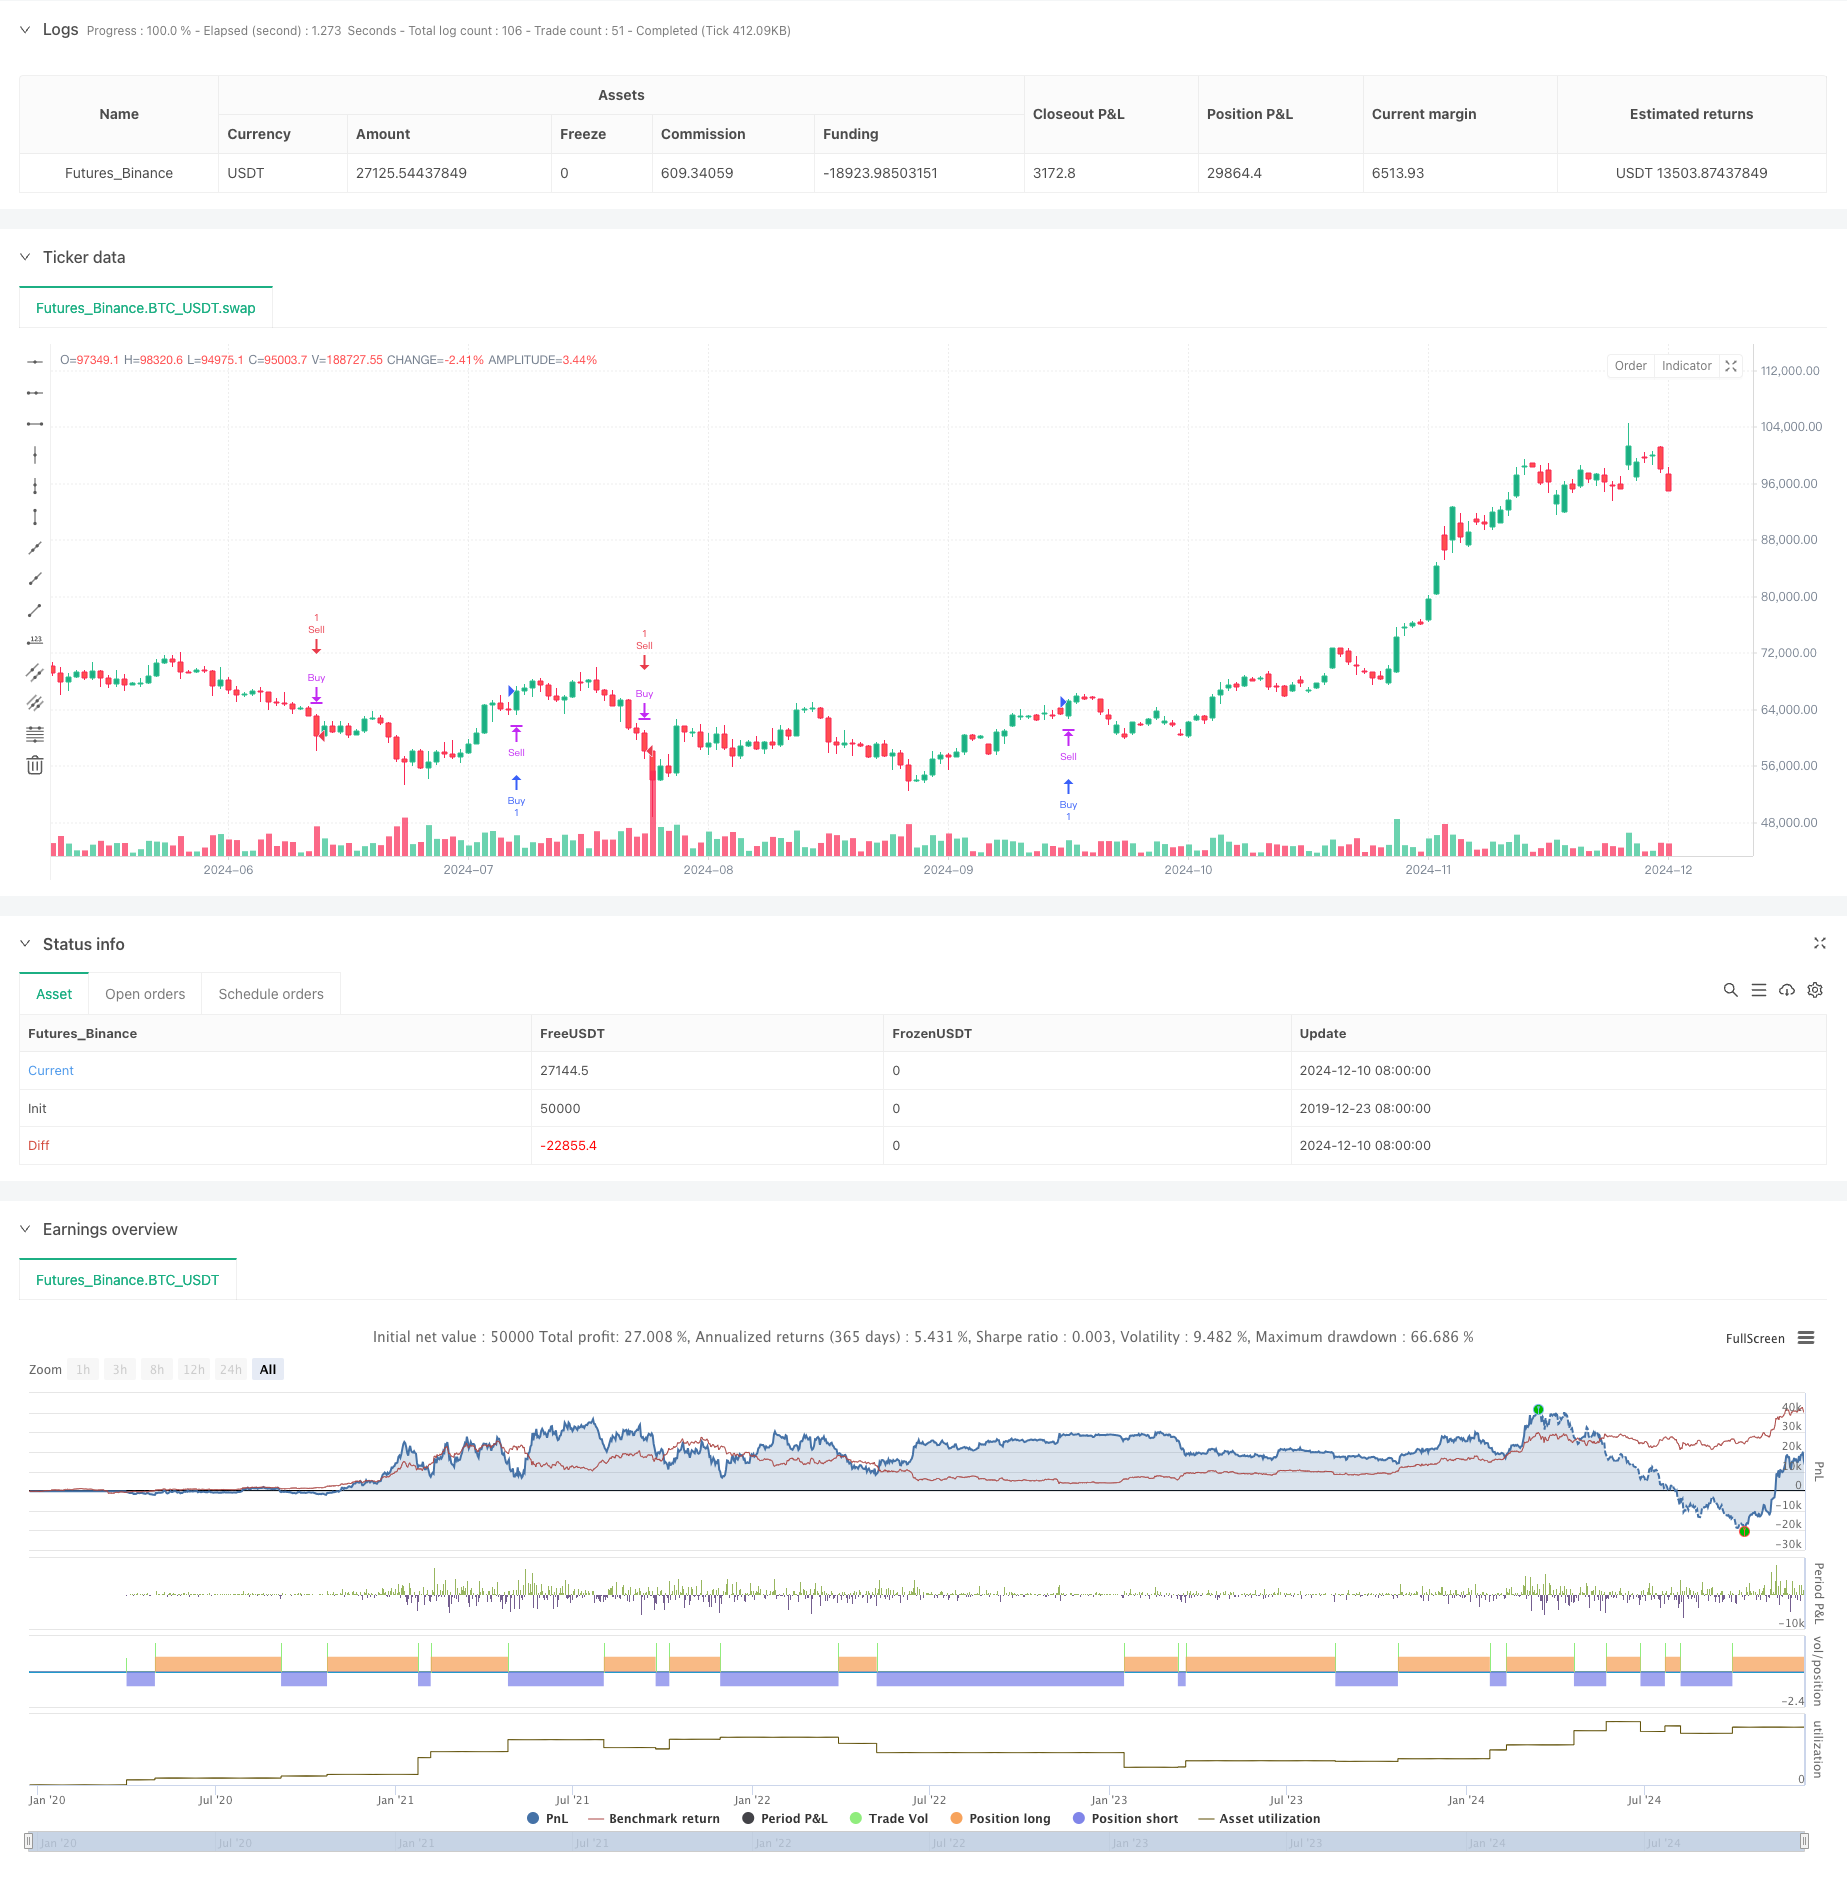
本策略是一个基于动态波动率指标(VIDYA)的趋势跟踪交易系统,结合了ATR波动带来增强趋势识别和风险管理能力。该策略通过动态调整对市场波动的响应速度,在保持趋势跟踪能力的同时,能够及时捕捉市场反转信号。系统采用VIDYA作为核心指标,配合ATR波动带来设置动态的止损位置,实现了对市场波动的智能适应。
策略原理
策略的核心在于利用VIDYA指标的动态特性来识别趋势。VIDYA通过计算动量变化来动态调整移动平均的权重,从而在不同市场环境下具有不同的灵敏度。具体来说: 1. 使用Chande动量振荡器(CMO)来计算价格动量 2. 基于动量计算自适应因子alpha 3. 结合ATR构建动态波动带 4. 价格突破上轨产生做多信号,突破下轨产生做空信号 5. 采用仓位反转逻辑,即新信号同时平掉旧仓位并开立新仓位
策略优势
- 动态适应性强: VIDYA指标能根据市场波动自动调整参数,避免传统移动平均线滞后的问题
- 风险控制完善: 通过ATR动态波动带来设置止损,能够适应不同市场环境
- 信号明确: 采用趋势反转逻辑,交易信号清晰,便于执行
- 可视化效果好: 通过颜色区分上升和下降趋势,直观展示市场状态
- 参数可调性强: 关键参数都可以根据不同市场特点进行优化
策略风险
- 震荡市场风险: 在横盘震荡市场容易产生虚假信号,导致频繁交易
- 滑点影响: 由于采用反转策略,每次信号都涉及双向交易,容易受到滑点影响
- 资金管理风险: 固定比例仓位管理在剧烈波动时可能带来较大损失
- 参数敏感性: VIDYA和ATR的参数设置对策略表现影响较大
- 市场环境依赖: 在趋势明显的市场表现较好,但在其他市场环境可能表现欠佳
策略优化方向
- 增加趋势过滤器: 可以添加长周期趋势判断来过滤震荡市场的信号
- 优化仓位管理: 考虑引入动态仓位管理,根据市场波动调整持仓比例
- 改进入场逻辑: 可以增加其他技术指标的确认来提高信号可靠性
- 完善止损机制: 考虑添加移动止损或基于波动率的动态止损
- 增加时间过滤: 可以根据不同时间段的市场特点调整策略参数
总结
该策略通过结合VIDYA和ATR实现了对市场趋势的动态跟踪和风险控制。其核心优势在于能够自适应市场波动,在保持趋势跟踪能力的同时也能及时捕捉反转机会。虽然在某些市场环境下可能面临风险,但通过合理的参数优化和风险管理措施,该策略仍然具有较好的实用价值。建议投资者在实盘使用时注意做好风险控制,合理设置参数,并根据市场情况及时调整策略设置。
策略源码
/*backtest
start: 2019-12-23 08:00:00
end: 2024-12-11 08:00:00
period: 1d
basePeriod: 1d
exchanges: [{"eid":"Futures_Binance","currency":"BTC_USDT"}]
*/

// This Pine Script™ code is subject to the terms of the Mozilla Public License 2.0 at https://mozilla.org/MPL/2.0/
// © PakunFX

//@version=5
strategy("VIDYA Auto-Trading(Reversal Logic)", overlay=true)

// INPUTS ――――――――――――――――――――――――――――――――――――――――――――――――――――――――――――――――――――――――――――――――――――――――――
int   vidya_length   = input.int(10, "VIDYA Length")
int   vidya_momentum = input.int(20, "VIDYA Momentum")
float band_distance  = input.float(2, "Distance factor for upper/lower bands", step = 0.1)
float source         = input.source(close, "Source")
color up_trend_color   = input(#17dfad, "+")
color down_trend_color = input(#dd326b, "-")
bool  shadow           = input.bool(true, "Shadow")

// Define VIDYA (Variable Index Dynamic Average) function
vidya_calc(src, vidya_length, vidya_momentum) =>
    float momentum         = ta.change(src)
    float sum_pos_momentum = math.sum((momentum >= 0) ? momentum : 0.0, vidya_momentum)
    float sum_neg_momentum = math.sum((momentum >= 0) ? 0.0 : -momentum, vidya_momentum)
    float abs_cmo          = math.abs(100 * (sum_pos_momentum - sum_neg_momentum) / (sum_pos_momentum + sum_neg_momentum))
    float alpha            = 2 / (vidya_length + 1)
    var float vidya_value  = 0.0
    vidya_value           := alpha * abs_cmo / 100 * src + (1 - alpha * abs_cmo / 100) * nz(vidya_value[1])

    ta.sma(vidya_value, 15)

// Calculate VIDYA
float vidya_value = vidya_calc(source, vidya_length, vidya_momentum)

// Calculate upper and lower bands
float atr_value = ta.atr(200)
float upper_band = vidya_value + atr_value * band_distance
float lower_band = vidya_value - atr_value * band_distance

// Detect trend direction
bool is_trend_up = na
if ta.crossover(source, upper_band)
    is_trend_up := true
if ta.crossunder(source, lower_band)
    is_trend_up := false

// Smooth the trend line
float smoothed_value = na
if is_trend_up
    smoothed_value := lower_band
if not is_trend_up
    smoothed_value := upper_band

// Detect trend change
bool trend_cross_up = ta.crossover(source, upper_band)
bool trend_cross_down = ta.crossunder(source, lower_band)

// ENTRY & EXIT ―――――――――――――――――――――――――――――――――――――――――――――――――――――――――――――――――――――――――――――――――――――
// Long logic: Enter long when down arrow appears and exit when up arrow appears
if trend_cross_up
    strategy.close("Sell")  // Close short position if any
    strategy.entry("Buy", strategy.long)

if trend_cross_down
    strategy.close("Buy")  // Close long position if any
    strategy.entry("Sell", strategy.short)
相关推荐