概述
该策略是一个结合了多重技术指标的量化交易系统,主要通过EMA均线判断市场趋势,同时结合MACD动量指标捕捉趋势反转时机,并利用RSI指标进行超买超卖判断。这种多重指标的配合使用,能够有效地过滤虚假信号,提高交易成功率。
策略原理
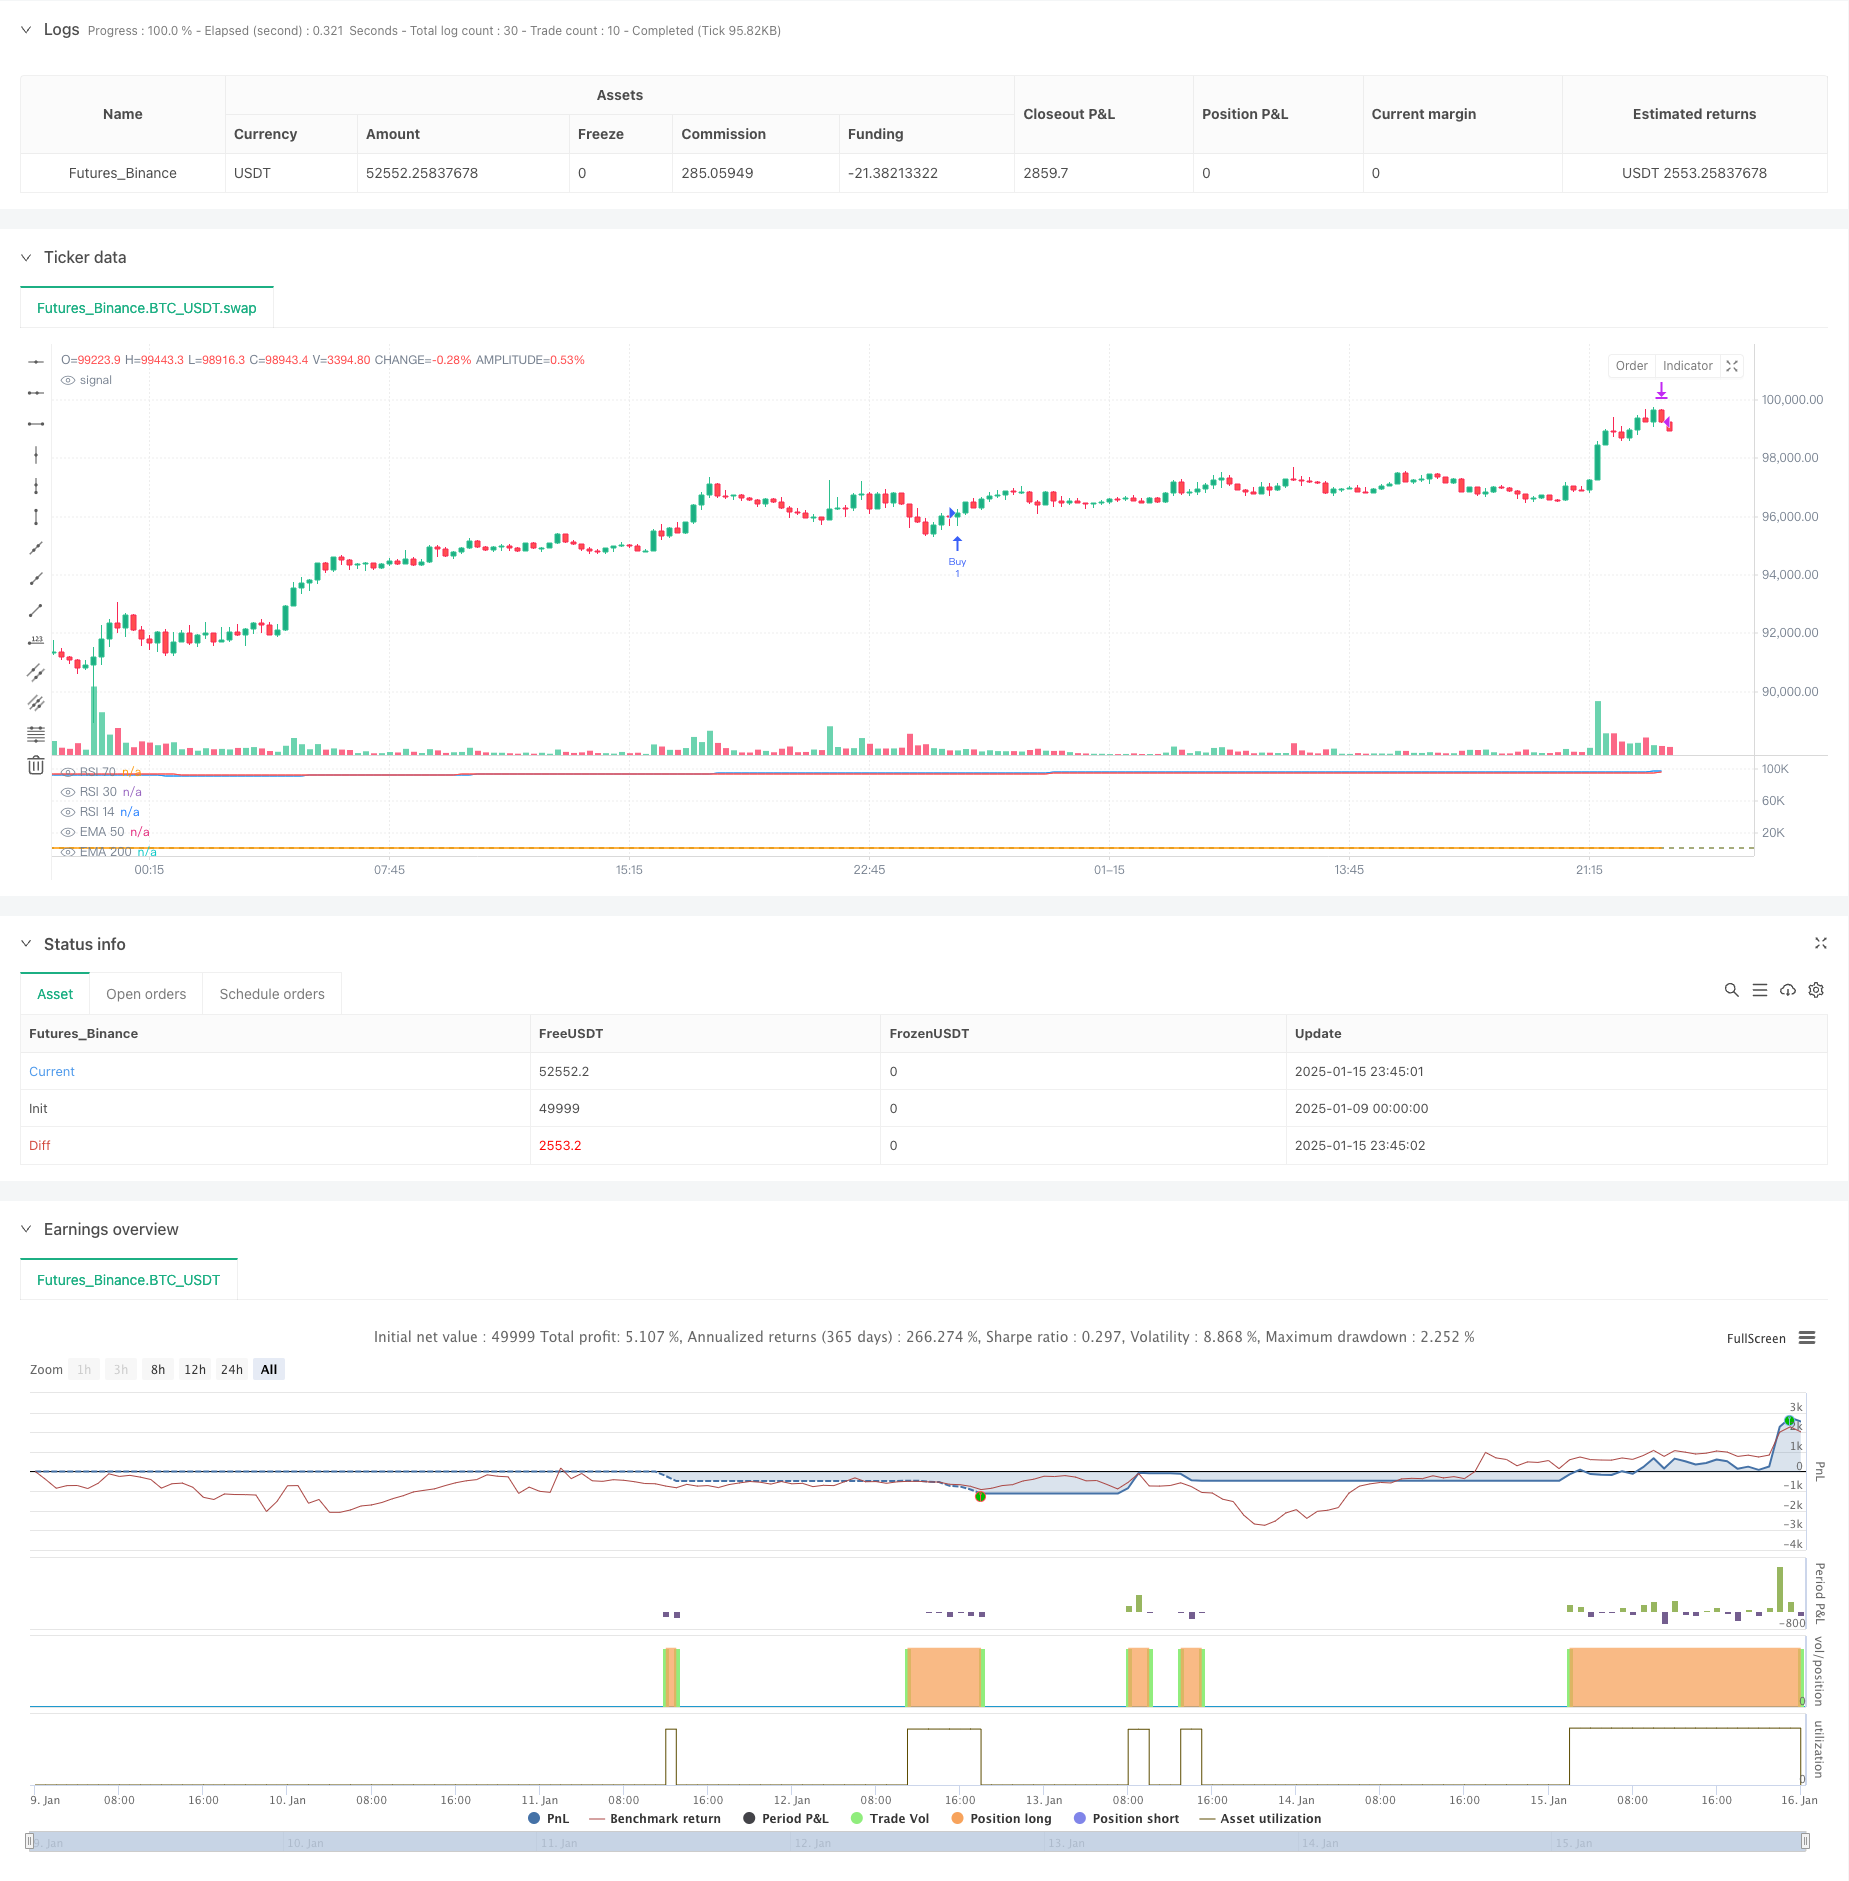
策略的核心逻辑包含以下几个关键部分: 1. 趋势判断:使用50周期和200周期的EMA均线,当短期EMA在长期EMA上方时确认上升趋势 2. 入场信号:在确认上升趋势的基础上,要求MACD指标位于零轴以下且出现拐头向上的形态,表明可能出现反转机会 3. 出场信号:通过RSI指标超买区域(70)的向下突破作为获利了结的时机 4. 止损设置:当短期EMA跌破长期EMA时触发止损,及时控制风险
策略优势
- 多重指标互补:结合趋势指标(EMA)、动量指标(MACD)和摆动指标(RSI),能够从多个维度确认交易信号
- 风险控制完善:设置了明确的止损条件,可以有效控制下行风险
- 趋势跟踪特性:策略设计倾向于捕捉强势上涨趋势,有利于获取较大的趋势性收益
- 信号可靠性高:入场需满足多重条件,可以有效降低虚假信号
策略风险
- 滞后性风险:均线系统具有一定滞后性,可能导致入场或出场时机略有延迟
- 震荡市风险:在横盘震荡市场中,可能产生频繁的虚假信号
- 参数敏感性:策略效果对参数设置较为敏感,不同市场环境可能需要调整参数
- 趋势依赖性:策略在非趋势市场的表现可能不够理想
策略优化方向
- 参数自适应:可以考虑根据市场波动率自动调整EMA和RSI的周期参数
- 信号确认机制:可以添加成交量等辅助指标来进一步确认信号的可靠性
- 仓位管理:引入动态仓位管理机制,根据信号强度和市场波动调整持仓比例
- 市场环境识别:增加市场环境判断模块,在不同市场条件下采用不同的参数设置
总结
该策略通过多重技术指标的协同配合,构建了一个较为完善的交易系统。策略的优势在于信号可靠性高、风险控制完善,但也存在一定的滞后性和参数敏感性问题。通过建议的优化方向,特别是引入自适应参数和动态仓位管理,可以进一步提高策略的稳定性和收益能力。策略适合在趋势明确的市场环境中使用,投资者需要根据具体市场特点调整参数设置。
策略源码
/*backtest
start: 2025-01-09 00:00:00
end: 2025-01-16 00:00:00
period: 15m
basePeriod: 15m
exchanges: [{"eid":"Futures_Binance","currency":"BTC_USDT","balance":49999}]
*/

//@version=5
strategy("RSI ve EMA Tabanlı Alım-Satım Stratejisi", overlay=false)

// EMA Hesaplamaları
ema_short = ta.ema(close, 50)  // EMA 50
ema_long = ta.ema(close, 200) // EMA 200

// MACD Hesaplamaları
[macd, signal, _] = ta.macd(close, 12, 26, 9)

// RSI Hesaplamaları
rsi = ta.rsi(close, 14)

// Alım Sinyali Koşulları
macd_condition = (macd < 0) and (macd > nz(macd[1])) and (nz(macd[1]) < nz(macd[2]))
buy_signal = (ema_short > ema_long) and macd_condition

// Satım Sinyali Koşulları
sell_signal = (rsi[1] > 70) and (rsi <= 70)  // RSI 70'i yukarıdan aşağıya kırdı

// Stop Loss Koşulu
stop_loss = ema_short < ema_long

// İşlem ve Etiketler
if buy_signal
    strategy.entry("Buy", strategy.long)
    label.new(bar_index, high, "AL", style=label.style_label_up, color=color.green, textcolor=color.white)

if sell_signal
    strategy.close("Buy", comment="SAT")
    label.new(bar_index, high, "SAT", style=label.style_label_down, color=color.red, textcolor=color.white)

if stop_loss
    strategy.close("Buy", comment="STOP LOSS")
    label.new(bar_index, low, "STOP LOSS", style=label.style_label_down, color=color.orange, textcolor=color.white)

// Grafik Üzerine Çizgiler ve Göstergeler
plot(ema_short, color=color.blue, title="EMA 50")
plot(ema_long, color=color.red, title="EMA 200")
plot(rsi, color=color.orange, title="RSI 14")
hline(70, "RSI 70", color=color.red)
hline(30, "RSI 30", color=color.green)
相关推荐