概述
多重动量指数趋势追踪量化交易策略是一种结合指数移动平均线(EMA)、相对强弱指数(RSI)和移动平均收敛发散指标(MACD)的复合型量化交易方法。该策略通过整合多个技术指标,旨在提高交易信号的准确性和可靠性,特别适用于高波动性市场的短线和中线交易。
策略原理
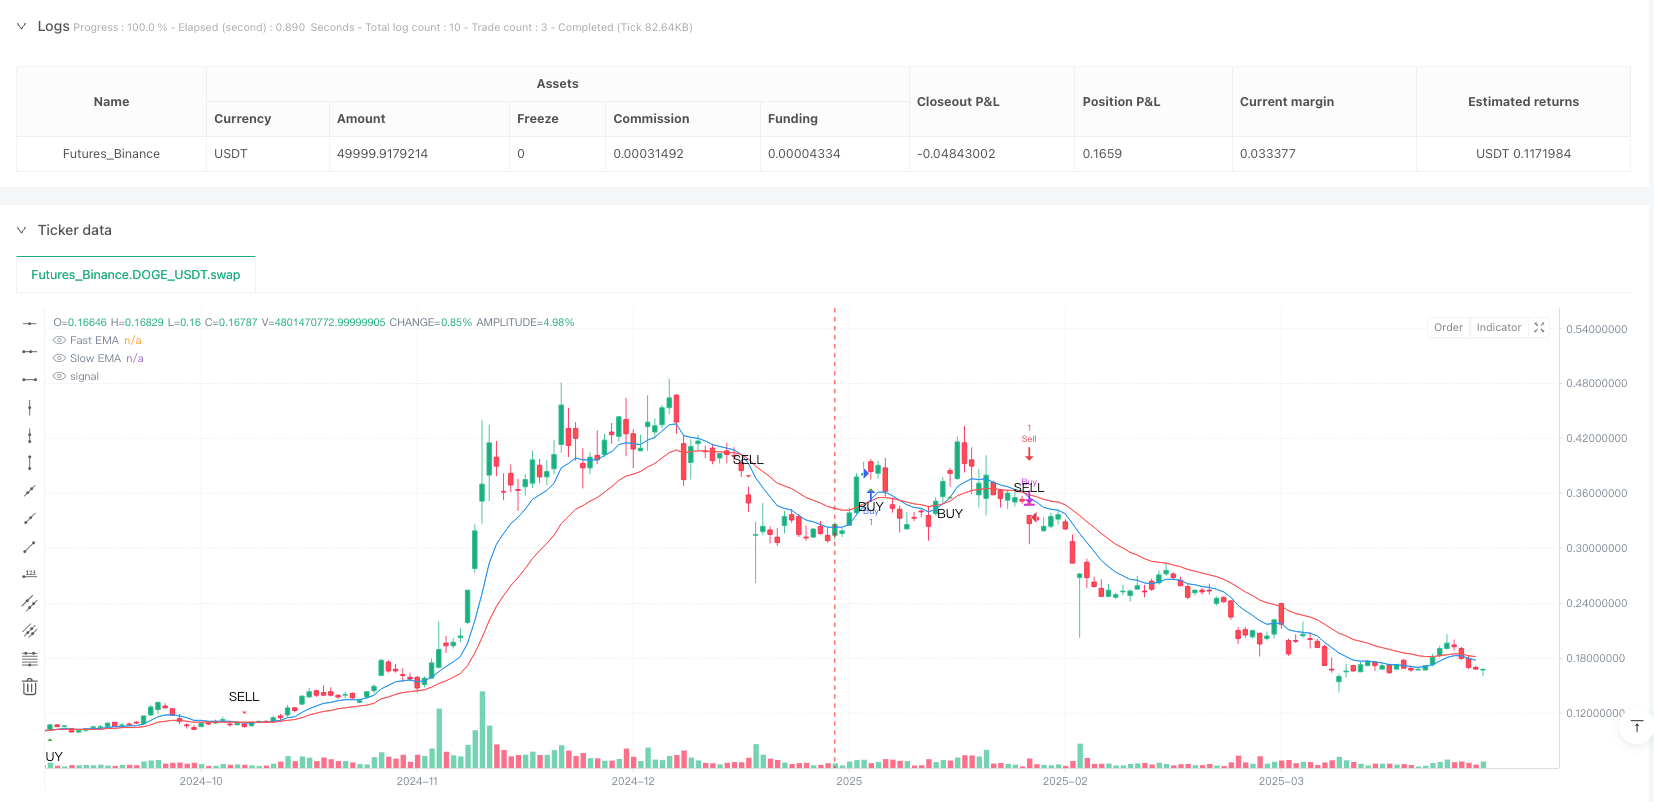
该策略的核心原理是多重指标联合验证: 1. 使用快速EMA(9周期)和慢速EMA(21周期)判断趋势方向和动量变化 2. 通过RSI(14周期)确认市场动量和超买超卖状态 3. 利用MACD指标验证趋势的动量和方向
具体交易信号生成规则: - 当快速EMA上穿慢速EMA,且RSI > 50,MACD线高于信号线时,产生买入信号 - 当快速EMA下穿慢速EMA,且RSI < 50,MACD线低于信号线时,产生卖出信号
策略优势
- 多重指标联合验证,显著降低假信号风险
- 动态捕捉市场趋势变化,适应性强
- 参数可调节,灵活应对不同市场环境
- 信号生成逻辑清晰,易于理解和实施
- 适用于高波动性市场的短线和中线交易
策略风险
- 在横盘市场中可能产生频繁无效交易
- 指标参数选择不当可能导致交易效率降低
- 未考虑交易成本和滑点影响
- 单一市场环境下策略稳定性存在局限性
策略优化方向
- 引入附加过滤条件,如成交量确认
- 增加止损和止盈机制
- 动态调整EMA、RSI和MACD参数
- 开发基于机器学习的参数自适应算法
- 引入更多市场环境的判断指标
总结
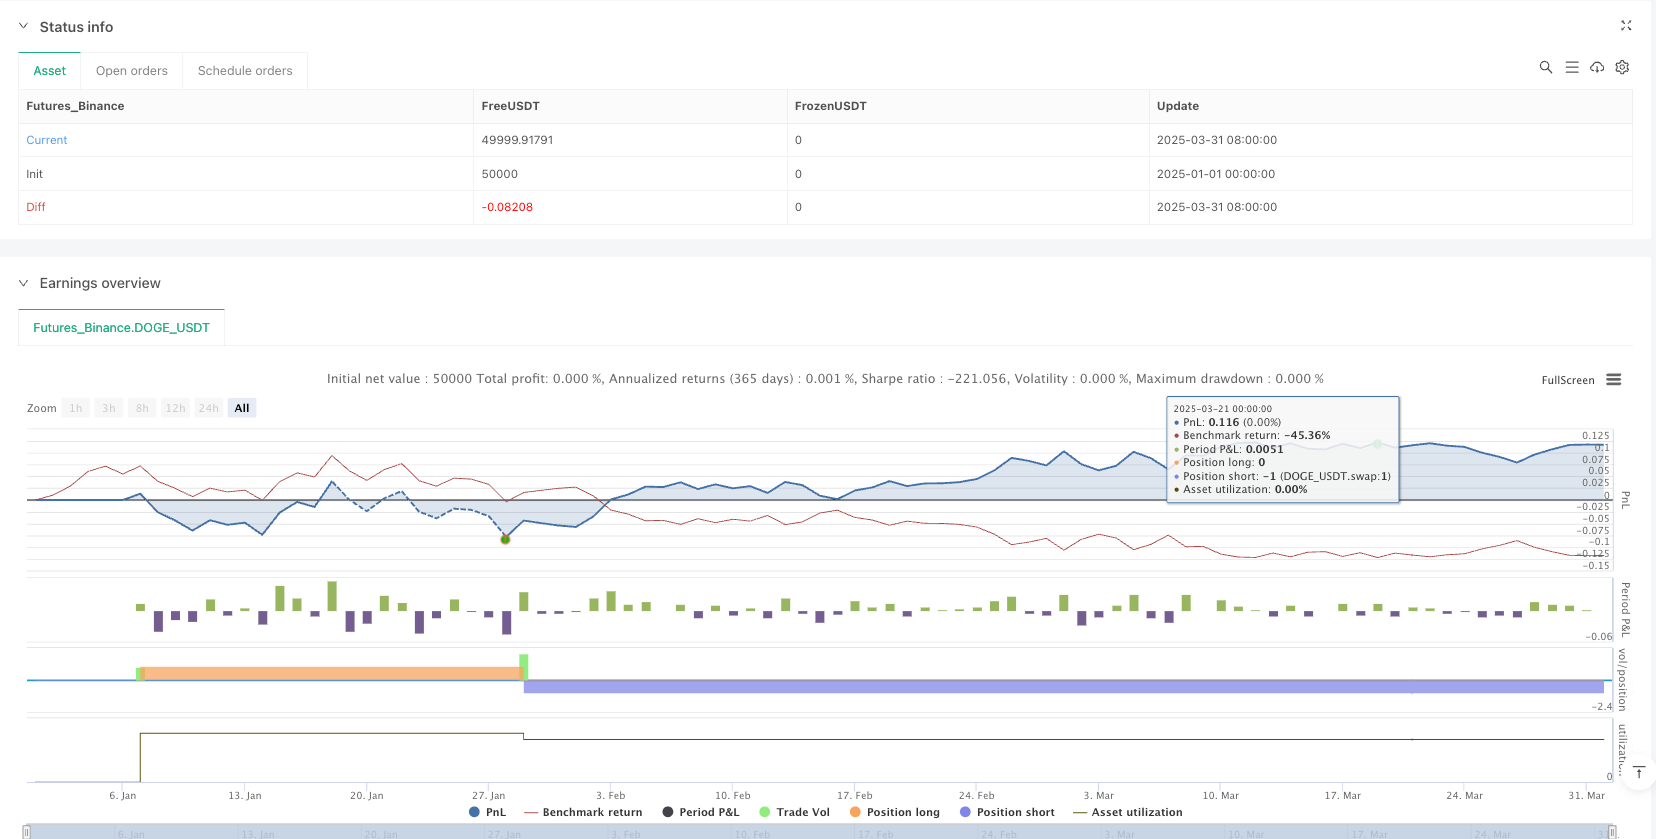
多重动量指标趋势追踪量化交易策略通过整合EMA、RSI和MACD三种关键技术指标,构建了一个相对robust的交易信号生成系统。该策略既保持了足够的灵活性,又具备较强的风险控制能力,为量化交易者提供了一个值得深入研究的交易方案。
策略源码
/*backtest
start: 2025-01-01 00:00:00
end: 2025-04-01 00:00:00
period: 1d
basePeriod: 1d
exchanges: [{"eid":"Futures_Binance","currency":"DOGE_USDT"}]
*/

//@version=6
strategy("EMA + RSI + MACD Strategy", overlay=true)

// Input for EMA Lengths
emaFastLength = input(9, title="Fast EMA Length")
emaSlowLength = input(21, title="Slow EMA Length")

// RSI Settings
rsiLength = input(14, title="RSI Length")
rsiOverbought = input(70, title="RSI Overbought Level")
rsiOversold = input(30, title="RSI Oversold Level")

// MACD Settings
[macdLine, signalLine, _] = ta.macd(close, 12, 26, 9)

// Calculate EMAs
emaFast = ta.ema(close, emaFastLength)
emaSlow = ta.ema(close, emaSlowLength)

// Calculate RSI
rsi = ta.rsi(close, rsiLength)

// Plot EMAs
plot(emaFast, title="Fast EMA", color=color.blue, linewidth=1)
plot(emaSlow, title="Slow EMA", color=color.red, linewidth=1)

// Buy and Sell Conditions
bullishCrossover = ta.crossover(emaFast, emaSlow) and rsi > 50 and macdLine > signalLine
bearishCrossover = ta.crossunder(emaFast, emaSlow) and rsi < 50 and macdLine < signalLine

// Plot Buy and Sell Signals
plotshape(series=bullishCrossover, title="BuySignal", location=location.belowbar, color=color.green, style=shape.triangleup, size=size.small, text="BUY")
plotshape(series=bearishCrossover, title="SellSignal", location=location.abovebar, color=color.red, style=shape.triangledown, size=size.small, text="SELL")

// Strategy Execution
if bullishCrossover
    strategy.entry("Buy", strategy.long)

if bearishCrossover
    strategy.close("Buy")
    strategy.entry("Sell", strategy.short)
相关推荐