概述
该交易策略结合了指数移动平均线(EMA)、相对强弱指数(RSI)和移动平均线收敛发散(MACD)三个技术指标,通过分析它们的交叉和数值关系,在价格满足一定条件时产生买卖信号。同时,该策略还设置了动态止盈和止损,以管理交易风险。
策略原理
- 计算高低收盘价平均值(HLCC4)作为策略的基础数据。
- 基于HLCC4计算三条不同周期的EMA和RSI指标。
- 计算MACD柱状图的值。
- 判断EMA1和EMA2的交叉情况:
- 当EMA1上穿EMA2时,产生看涨信号。
- 当EMA1下穿EMA2时,产生看跌信号。
- 综合考虑EMA、RSI和MACD指标的数值,判断是否满足买入或卖出条件:
- 买入条件:EMA1上穿EMA2,HLCC4高于EMA3,RSI高于阈值,收盘价高于开盘价,MACD柱状图为正。
- 卖出条件:EMA1下穿EMA2,HLCC4低于EMA3,RSI低于阈值,收盘价低于开盘价,MACD柱状图为负。
- 若在持仓时出现相反信号,先平掉原有仓位,再开新仓。
- 买入或卖出时,根据设定的点数(pips)设置止盈和止损价格。
策略优势
- 结合多个技术指标进行综合判断,提高了信号的可靠性。
- 引入动态止盈止损机制,可以有效控制风险。
- 在出现相反信号时会先平掉原有仓位,避免了重复持仓的问题。
- 参数可调,适应性强,可以根据不同的市场环境进行优化。
策略风险
- 在震荡行情中,频繁的交叉可能导致过多的交易,增加手续费成本。
- 固定点数的止盈止损可能无法适应市场的波动,导致止损过早或止盈过晚。
- 策略依赖于历史数据,对于突发事件或异常行情可能反应不及时。
策略优化方向
- 可以考虑引入更多的技术指标或市场情绪指标,如布林带、ATR等,以提高信号的准确性。
- 针对止盈止损,可以采用更加动态的方式,如跟踪止损或者根据波动率调整止盈止损距离。
- 可以结合基本面分析,如重大新闻事件、经济数据发布等,对交易信号进行过滤,避免在特殊时期交易。
- 对于参数的设置,可以采用机器学习或优化算法,寻找最优参数组合。
总结
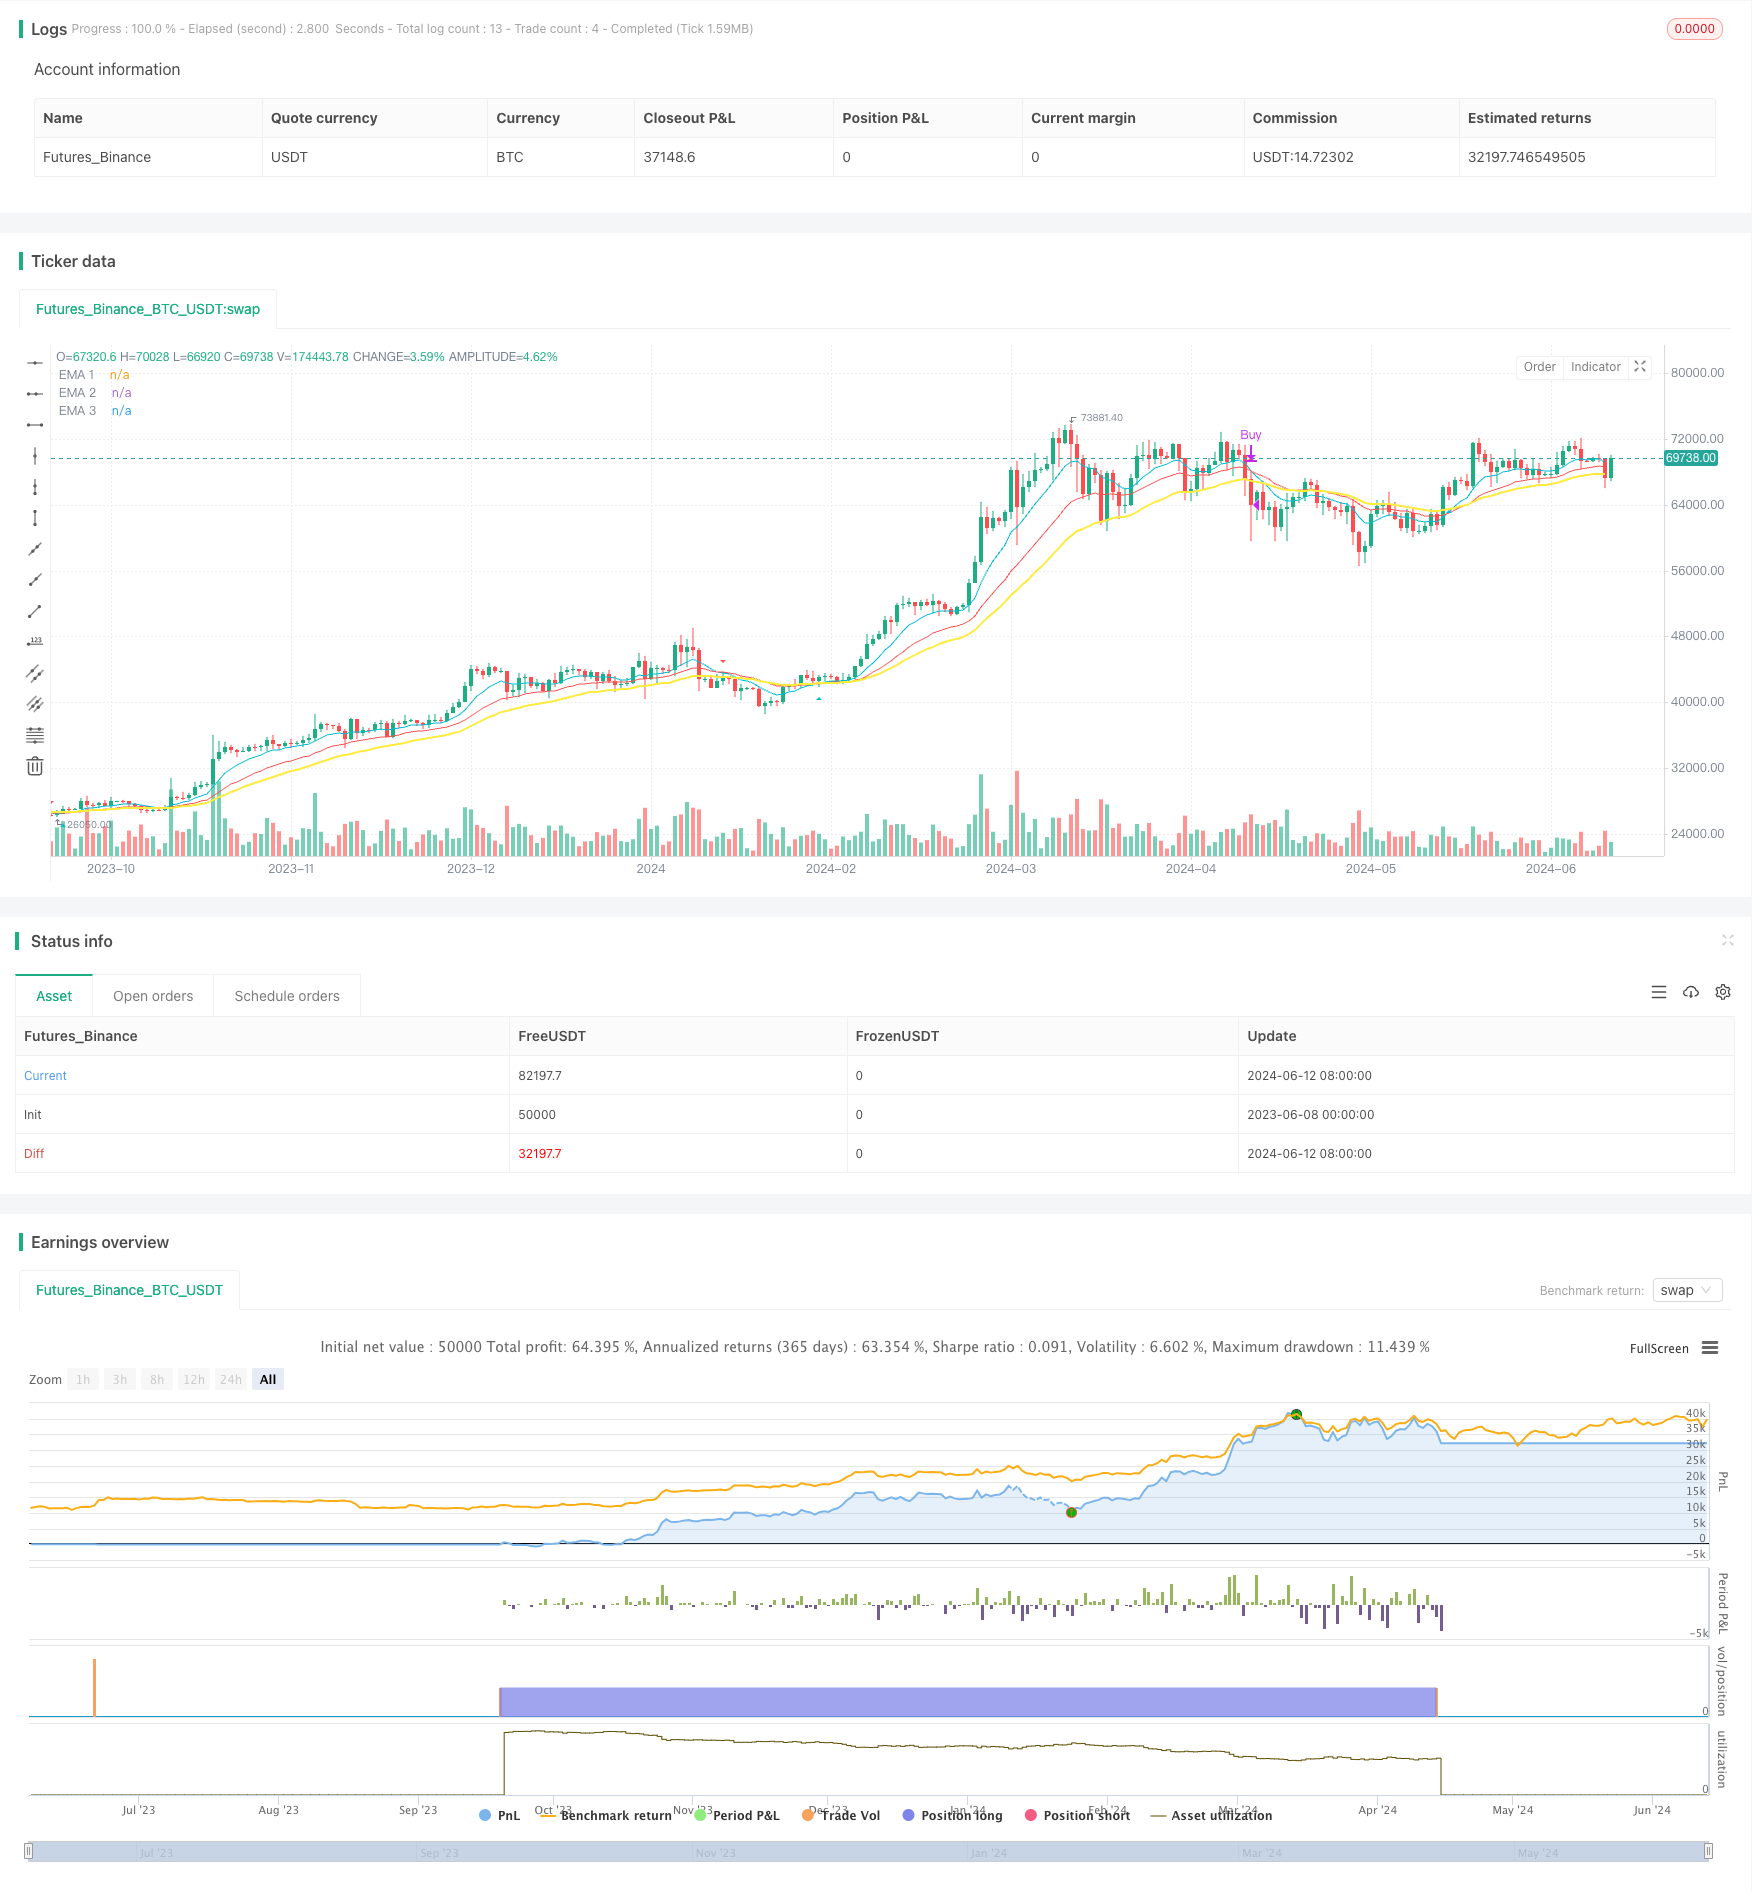
该策略通过结合EMA、RSI和MACD等多个技术指标,形成了一套完整的交易系统。在趋势行情中,策略可以有效捕捉趋势,并通过动态止盈止损控制风险。但在震荡行情中,频繁交易可能会影响收益。未来可以从信号优化、风控优化、参数优化等方面对策略进行完善,以提高其稳定性和盈利能力。
策略源码
/*backtest
start: 2023-06-08 00:00:00
end: 2024-06-13 00:00:00
period: 1d
basePeriod: 1h
exchanges: [{"eid":"Futures_Binance","currency":"BTC_USDT"}]
*/

//@version=5
strategy("[BUY/SELL]EMA RSI MACD with TP and SL", overlay=true)

// Input parameters
ema1Length = input.int(9, title="EMA 1 Length")
ema2Length = input.int(21, title="EMA 2 Length")
ema3Length = input.int(34, title="EMA 3 Length")
rsiLength = input.int(14, title="RSI Length")
rsiThreshold = input.int(50, title="RSI Threshold")
macdFastLength = input.int(12, title="MACD Fast Length")
macdSlowLength = input.int(26, title="MACD Slow Length")
macdSignalSmoothing = input.int(9, title="MACD Signal Smoothing")
tpPips = input.int(10, title="Take Profit (pips)")
slPips = input.int(10, title="Stop Loss (pips)")

// HLCC4 calculation
hlcc4_custom = (high + low + close + close) / 4

// Calculate EMA and RSI based on HLCC4
ema1 = ta.ema(hlcc4_custom, ema1Length)
ema2 = ta.ema(hlcc4_custom, ema2Length)
ema3 = ta.ema(hlcc4_custom, ema3Length)
rsi = ta.rsi(hlcc4_custom, rsiLength)

// Calculate MACD Histogram
[a, b, histogram] = ta.macd(hlcc4_custom, macdFastLength, macdSlowLength, macdSignalSmoothing)

// EMA1 and EMA2 crossover conditions
emaCrossUp = ta.crossover(ema1, ema2)
emaCrossDown = ta.crossunder(ema1, ema2)

// BUY signal conditions
buySignal = emaCrossUp and hlcc4_custom > ema3 and rsi > rsiThreshold and close > open and histogram > 0

// SELL signal conditions
sellSignal = emaCrossDown and hlcc4_custom < ema3 and rsi < rsiThreshold and close < open and histogram < 0

var float entryPrice = na
var float tpPrice = na
var float slPrice = na

// Check if there is an open position and a contrary signal appears, then close all old orders first
if strategy.opentrades > 0
    if sellSignal and strategy.position_size > 0
        strategy.close("Buy", comment="Close Buy Order")
    if buySignal and strategy.position_size < 0
        strategy.close("Sell", comment="Close Sell Order")

// Place a BUY order when there is a BUY signal and set TP and SL based on pips
if buySignal and strategy.position_size == 0
    entryPrice := close
    tpPrice := entryPrice + tpPips * syminfo.mintick
    slPrice := entryPrice - slPips * syminfo.mintick
    strategy.entry("Buy", strategy.long)
    strategy.exit("Take Profit/Stop Loss", "Buy", limit=tpPrice, stop=slPrice)

// Place a SELL order when there is a SELL signal and set TP and SL based on pips
if sellSignal and strategy.position_size == 0
    entryPrice := close
    tpPrice := entryPrice - tpPips * syminfo.mintick
    slPrice := entryPrice + slPips * syminfo.mintick
    strategy.entry("Sell", strategy.short)
    strategy.exit("Take Profit/Stop Loss", "Sell", limit=tpPrice, stop=slPrice)

// Plot the crossover points of EMA1 and EMA2
plotshape(series=emaCrossUp, location=location.belowbar, color=color.aqua, style=shape.triangleup, title="EMA Cross Up", size=size.small)
plotshape(series=emaCrossDown, location=location.abovebar, color=color.red, style=shape.triangledown, title="EMA Cross Down", size=size.small)

// Plot the EMA lines on the chart
plot(ema1, title="EMA 1", color=color.aqua)
plot(ema2, title="EMA 2", color=color.red)
plot(ema3, title="EMA 3", color=color.yellow, linewidth=2)
相关推荐