ব্রাহ্মস্ত্রা
লেখক:চাওঝাং, তারিখ: ২০২২-০৫-১৩ ১৪ঃ৩৯ট্যাগঃডব্লিউএমএ
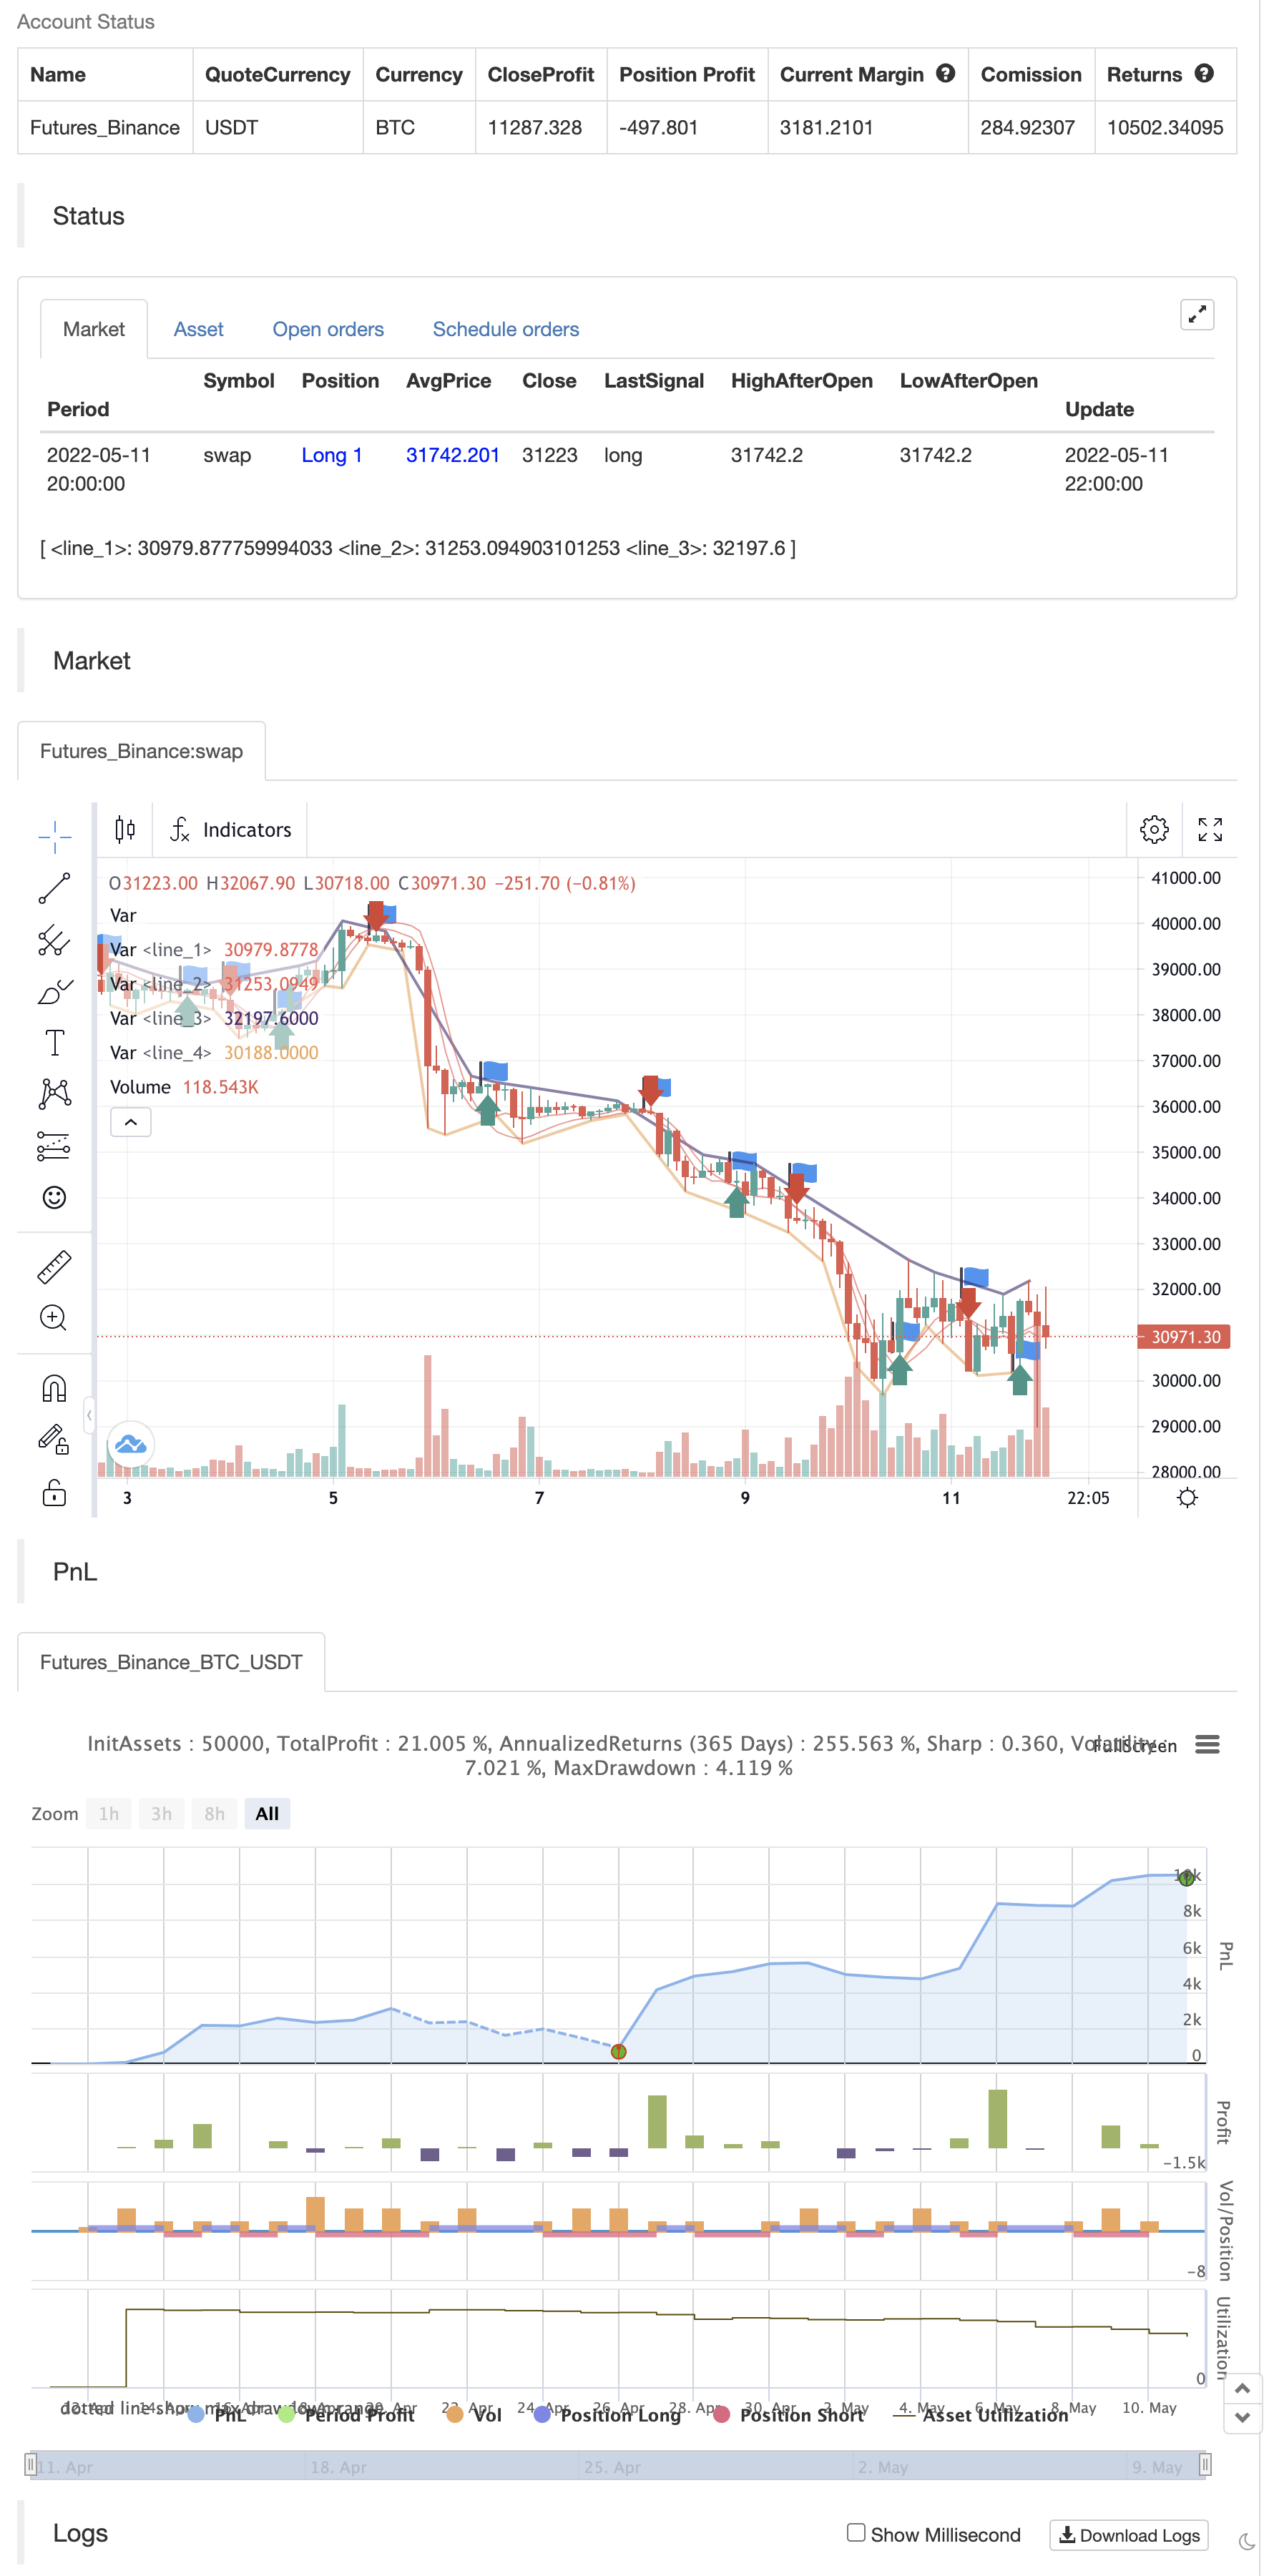
যেকোনো সময়, আপনি এই স্ক্রিপ্টে ৪ টি ট্রেন্ড লাইন দেখতে পাবেন।
▶ ট্রেন্ড লাইন আপট্রেন্ডিং অবস্থায় পিভট হাইস যোগদান ▶ ট্রেন্ড লাইন আপট্রেন্ডিং অবস্থায় পিভট নিচে যোগদান ▶ নিম্নমুখী অবস্থার সময় ট্রেন্ডলাইন পিভট হাইসে যোগদান করে ▶ নিম্নমুখী অবস্থার সময় ট্রেন্ড লাইন পিভট নিচে যোগদান করে
পুরানো লাইনটি একই ধরণের নতুনটি না আসা পর্যন্ত থাকবে। অতএব, আপনি এখনও ডাউনট্রেন্ডিং সরঞ্জামগুলির জন্য আপট্রেন্ডিং উচ্চ এবং নিম্ন প্রবণতা লাইনগুলি দেখতে সক্ষম হবেন যা অনেক পিছনে তৈরি করা হয়েছে! এছাড়াও, নতুন প্রবণতা লাইনগুলি কেবলমাত্র পুরানোগুলিকে প্রতিস্থাপন করে যদি তারা আরও শক্তিশালী হয় (কম ওভারফ্লো সহ আরও পিভটগুলির সাথে সংযুক্ত হয়)
ব্যাকটেস্ট

/*backtest
start: 2022-04-12 00:00:00
end: 2022-05-11 23:59:00
period: 2h
basePeriod: 15m
exchanges: [{"eid":"Futures_Binance","currency":"BTC_USDT"}]
*/

//@version=4
study("BRAHMASTRA", precision=2, overlay=true)
// compilation: capissimo

// This script utilizes two modules, Trendlines Module (by Joris Duyck) and HMA-Kahlman Trend Module.
// Trendlines module produces crossovers predictive of the next local trend.

//*** HMA-Kahlman Trend Module
price  = input(hl2,  "Price Data (hl2)")
hkmod  = input(true, "===HMA-Kahlman Trend Module===")
length = input(22,   "Lookback Window", minval=2)
k      = input(true, "Use Kahlman")
gain   = input(.7,   "Gain", minval=.0001, step=.01)
labels = input(true, "Show Labels?")
o      = input(true, "Use Offset")

hma(x, p) => wma((2 * wma(x, p / 2)) - wma(x, p), round(sqrt(p)))

hma3() => p = length/2, wma(wma(close, p/3)*3 - wma(close, p/2) - wma(close, p), p)

kahlman(x, g) =>
    kf = 0.0
    dk = x - nz(kf[1], x)
    smooth = nz(kf[1],x)+dk*sqrt(g*2)
    velo = 0.0
    velo := nz(velo[1],0) + (g*dk)
    kf := smooth+velo

a = k ? kahlman(hma(price, length), gain) : hma(price, length)
b = k ? kahlman(hma3(), gain) : hma3()
c = b > a ? color.lime : color.red
crossdn = a > b and a[1] < b[1]
crossup = b > a and b[1] < a[1]
ofs = o ? -1 : 0

fill(plot(a,color=c,linewidth=1,transp=75), plot(b,color=c,linewidth=1,transp=75), color=c, transp=55)
plotshape(labels and crossdn ? a : na, location=location.abovebar, style=shape.labeldown, color=color.red, size=size.tiny, text="S", textcolor=color.white, transp=0, offset=ofs)
plotshape(labels and crossup ? a : na, location=location.belowbar, style=shape.labelup, color=color.green, size=size.tiny, text="B", textcolor=color.white, transp=0, offset=ofs)

//*** Trendlines Module, see https://www.tradingview.com/script/mpeEgn5J-Trendlines-JD/
tlmod = input(true, "===Trendlines Module===")
l1    = input(2,    "Pivots Lookback Window", minval=1)

trendline(input_function, delay, only_up) => // Calculate line coordinates (Ax,Ay) - (Bx,By)
    var int Ax = 0, var int Bx = 0, var float By = 0.0, var float slope = 0.0
    Ay = fixnan(input_function)
    if change(Ay)!=0
        Ax := time[delay], By:= Ay[1], Bx := Ax[1]
        slope := ((Ay-By)/(Ax-Bx))
    else
        Ax := Ax[1], Bx := Bx[1], By := By[1]

    var line trendline=na, var int Axbis=0, var float Aybis=0.0, var bool xtend=true
    extension_time = 0
    Axbis := Ax + extension_time
    Aybis := (Ay + extension_time*slope)
    if tlmod and change(Ay)!=0
        line_color = slope*time<0?(only_up?na:color.red):(only_up?color.lime:na)
        if not na(line_color)
            trendline = line.new(Bx,By,Axbis, Aybis, xloc.bar_time, extend=xtend?extend.right:extend.none, color=line_color, style=line.style_dotted, width=1)
            line.delete(trendline[1])
    slope

pivot(len) =>
    high_point = pivothigh(high, len,len/2)
    low_point  = pivotlow(low, len,len/2)
    slope_high = trendline(high_point, len/2,false)
    slope_low  = trendline(low_point, len/2,true)
    [high_point, low_point, slope_high, slope_low]

[high_point1, low_point1, slope_high1, slope_low1] = pivot(l1)

color_high1 = slope_high1 * time<0 ? color.red : na
color_low1  = slope_low1  * time>0 ? color.lime : na
plot(tlmod ? high_point1 : na, color=color_high1, offset=-l1/2, linewidth=2)
plot(tlmod ? low_point1  : na, color=color_low1, offset=-l1/2, linewidth=2)


if crossup
    strategy.entry("Enter Long", strategy.long)
else if crossdn
    strategy.entry("Enter Short", strategy.short)
- একাধিক প্রযুক্তিগত সূচক ক্রস গতিশীলতা প্রবণতা ট্র্যাকিং কৌশল
- মাল্টি-ইউনিট্রি ক্রস-সাহায্যকারী আরএসআই ডায়নামিক প্যারামিটার পরিমাণগত ট্রেডিং কৌশল
- গতিশীল প্রবণতা RSI ক্রস কৌশল নির্ধারণ করে
- মাল্টি স্লাইড মিডলাইন ডায়নামিক ক্রস ট্রেন্ড ট্র্যাকিং এবং মাল্টি কনফার্মেশন কোয়ালিফাইড ট্রেডিং কৌশল
- মাল্টি ইন্ডিকেটর সমন্বয় প্রবণতা বিপরীত পরিমাণগত ট্রেডিং কৌশল
- কেনির প্যানেল কৌশলকে সমর্থন করে একাধিক প্যানেলের গতিশীলতা
- প্রতীক প্রবাহের দৈর্ঘ্যের উপর ভিত্তি করে পরিমাণগত প্রবণতা ক্যাপচার কৌশল
- ব্রিনব্যান্ডের ট্রেডিং ট্র্যাকিং কৌশল
- মাল্টি-ইন্ডিকেটর ফিউজিং ডায়নামিক মুভিং এভারেজ ক্রস কোয়ালিফাইং কৌশল
- মাল্টি-ইন্ডিকেটর প্যাকেজ ডায়নামিক ট্রেডিং অপ্টিমাইজেশান কৌশল
- বোলিংয়ের ড্রাইভিংয়ের উপর ভিত্তি করে ট্রেডিং কৌশলগুলি ট্র্যাক করার জন্য অভিযোজিত প্রবণতা
- ভূত প্রবণতা ট্র্যাকিং কৌশল ডাটাবেস
- ভূত প্রবণতা কৌশলগত ট্রেসিং ব্যবসা পুস্তিকা
- ভূত ট্রেন্ড ট্র্যাকিং কৌশল
- রেইনবো ওসিলেটর
- ইকুইটি কার্ভ পজিশন সাইজিংয়ের উদাহরণ
- KLineChart-এর একটি ডেমো
- ভিলা ডায়নামিক পিভট সুপারট্রেন্ড কৌশল
- ক্রডলের সুপার ট্রেন্ড
- zdmre দ্বারা RSI
- FTL - পরিসীমা ফিল্টার X2 + EMA + UO
- মোবো ব্যান্ড
- SAR + 3SMMA SL & TP সহ
- এসএসএস
- চাঁদ উৎক্ষেপণ সতর্কতা টেমপ্লেট [সূচক]
- HALFTREND + HEMA + SMA (মিথ্যা সংকেতের কৌশল)
- আরএসআই পিভট, বিবি, এসএমএ, ইএমএ, এসএমএমএ, ডব্লিউএমএ, ভিডব্লিউএমএ এর সাথে বিপরীত
- আরএসআই এবং বিবি এবং একই সাথে ওভারসোল্ড
- রোলিং হেকিন আশি মোমবাতি
- কম্বো 2/20 ইএমএ এবং ব্যান্ডপাস ফিল্টার
- ইএসএসএমএ