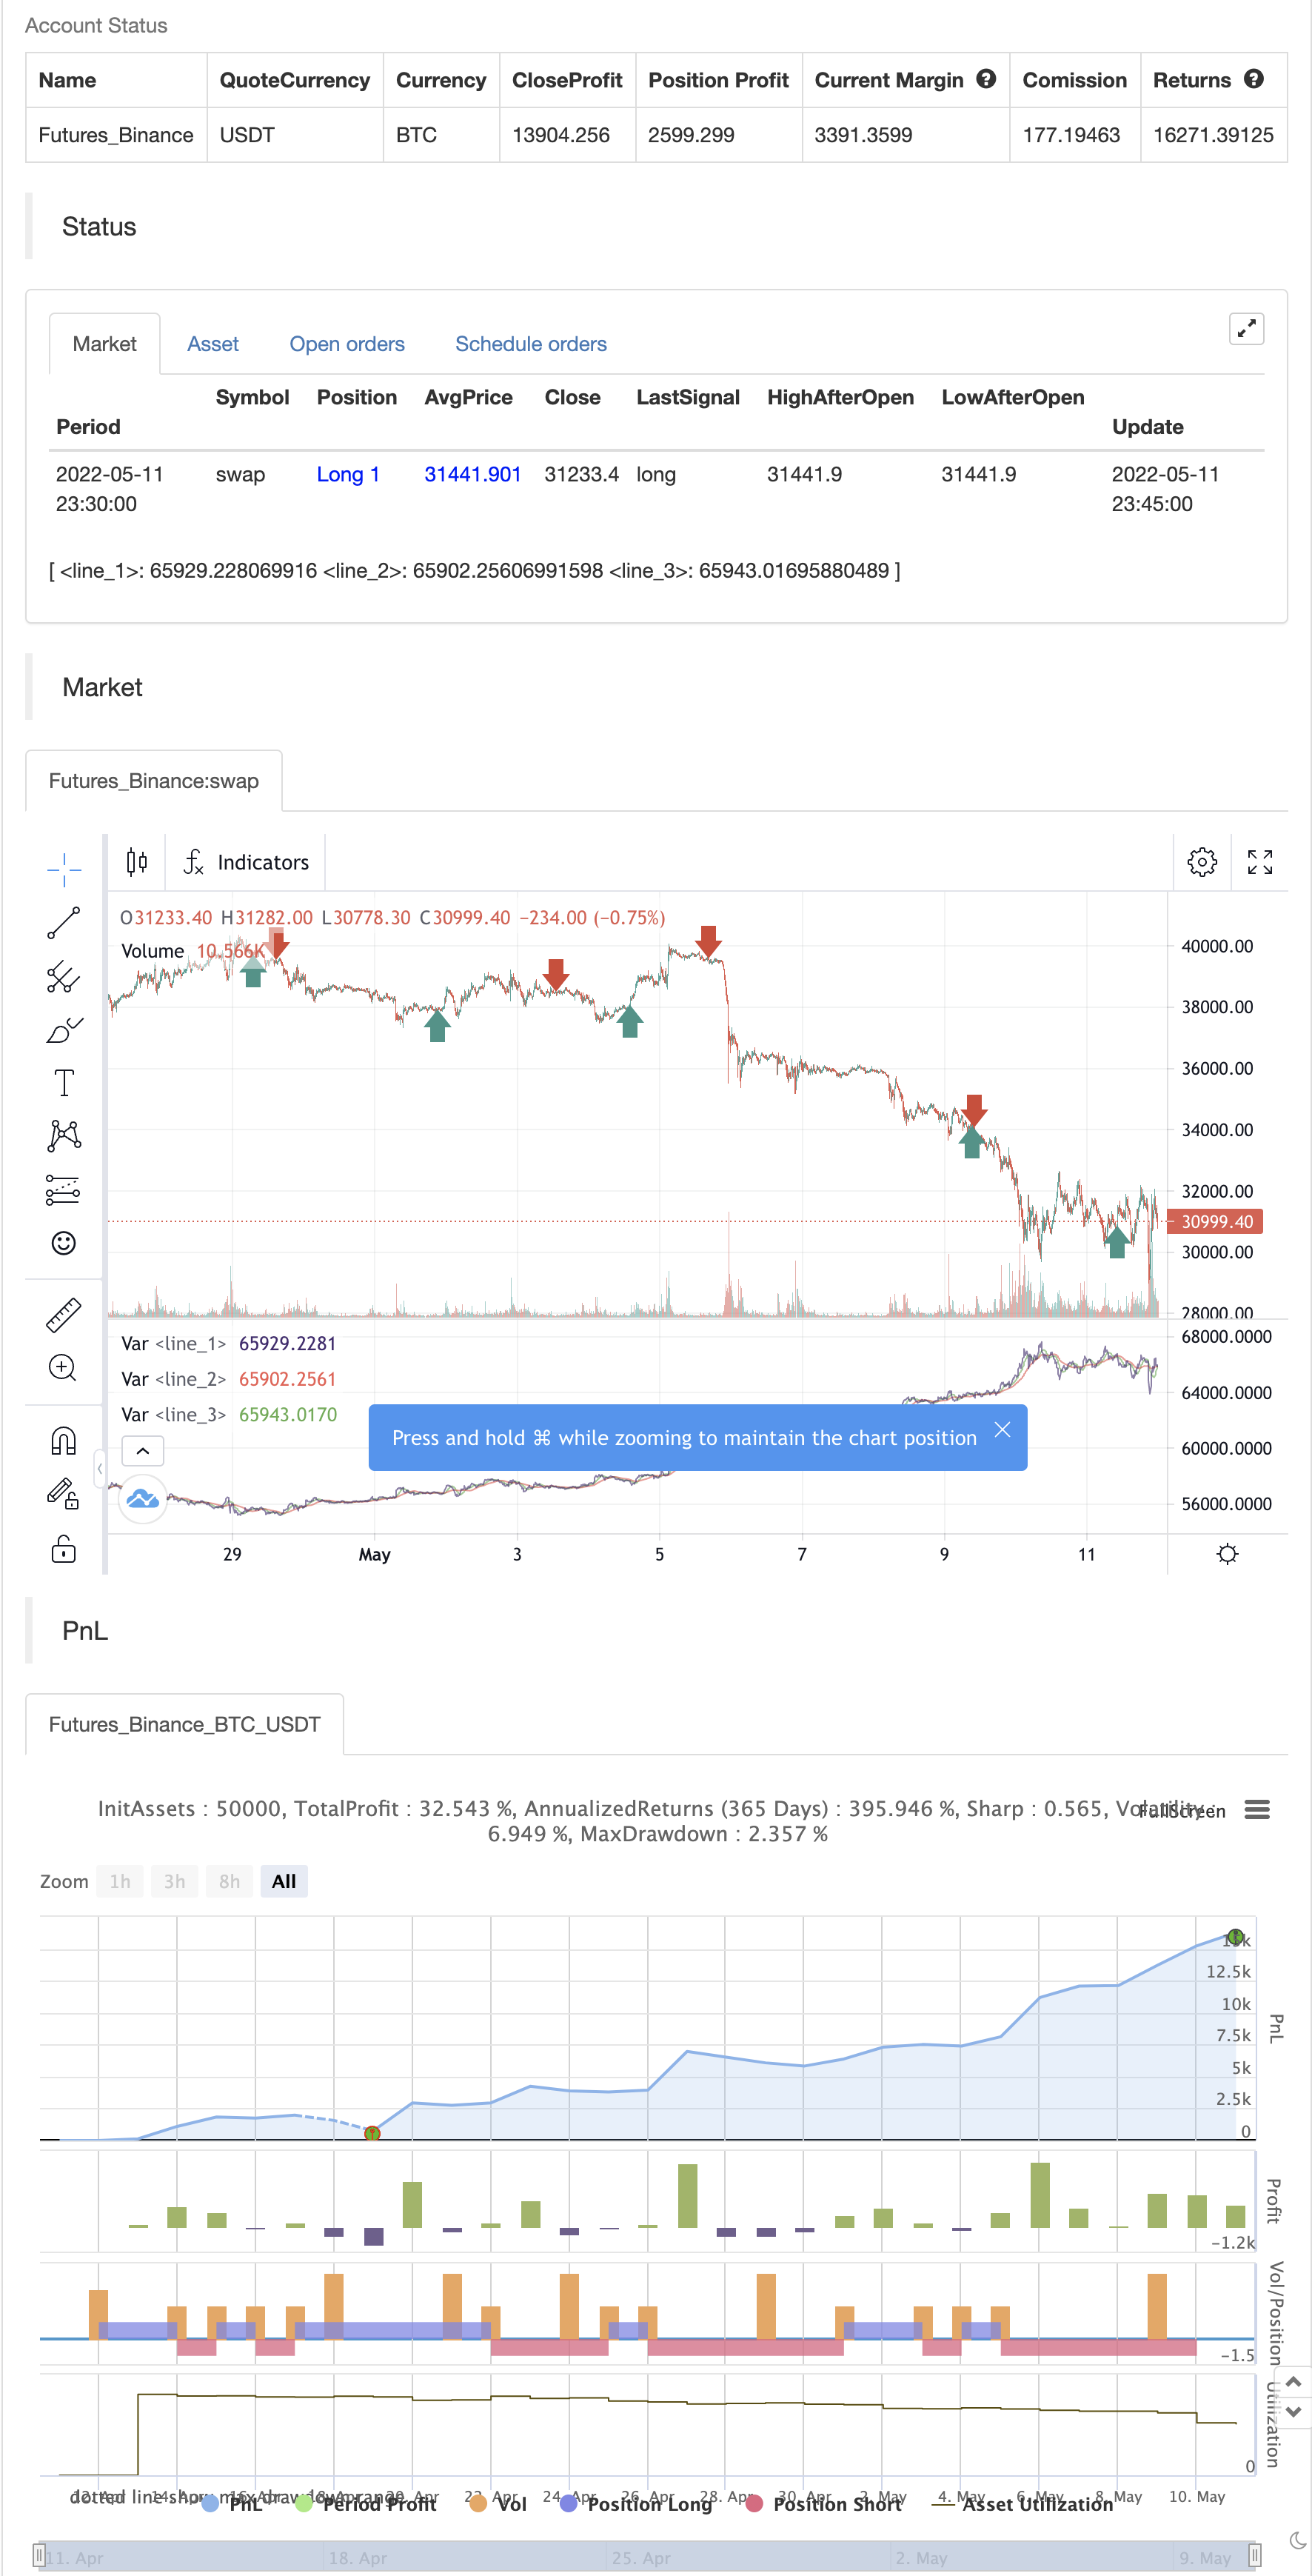
ইকুইটি কার্ভ পজিশন সাইজিংয়ের উদাহরণ
লেখক:চাওঝাং, তারিখ: ২০২২-০৫-১৩ ২২ঃ২৫ঃ৪৪ট্যাগঃসিওএমএসএমএ
ইক্যুইটি কার্ভ পরিচালনার উদ্দেশ্য হ'ল যখন ইক্যুইটি কার্ভ একটি ডাউনট্রেন্ডে থাকে তখন ট্রেডিংয়ে ঝুঁকি হ্রাস করা। এই কৌশলটিতে ইক্যুইটি কার্ভের ডাউনট্রেন্ড নির্ধারণের দুটি মোড রয়েছেঃ পোর্টফোলিও
যখন ট্রেডিং উইথ ইকুইটি কার্ভ
ব্যাকটেস্ট

/*backtest
start: 2022-04-12 00:00:00
end: 2022-05-11 23:59:00
period: 15m
basePeriod: 5m
exchanges: [{"eid":"Futures_Binance","currency":"BTC_USDT"}]
*/

// This source code is subject to the terms of the Mozilla Public License 2.0 at https://mozilla.org/MPL/2.0/
// © shardison
//@version=5

//EXPLANATION
//"Trading the equity curve" as a risk management method is the
//process of acting on trade signals depending on whether a system’s performance
//is indicating the strategy is in a profitable or losing phase.
//The point of managing equity curve is to minimize risk in trading when the equity curve is  in a downtrend.
//This strategy has two modes to determine the equity curve downtrend:
//By creating two simple moving averages of a portfolio's equity curve - a short-term
//and a longer-term one - and acting on their crossings. If the fast SMA is below
//the slow SMA, equity downtrend is detected (smafastequity < smaslowequity).
//The second method is by using the crossings of equity itself with the longer-period SMA (equity < smasloweequity).
//When "Reduce size by %" is active, the position size will be reduced by a specified percentage
//if the equity is "under water" according to a selected rule. If you're a risk seeker, select "Increase size by %"
//- for some robust systems, it could help overcome their small drawdowns quicker.

//strategy("Use Trading the Equity Curve Postion Sizing", shorttitle="TEC", default_qty_type = strategy.percent_of_equity, default_qty_value = 10, initial_capital = 100000)

//TRADING THE EQUITY CURVE INPUTS
useTEC           = input.bool(true, title="Use Trading the Equity Curve Position Sizing")
defulttraderule  = useTEC ? false: true
initialsize      = input.float(defval=10.0, title="Initial % Equity")
slowequitylength = input.int(25, title="Slow SMA Period")
fastequitylength = input.int(9, title="Fast SMA Period")
seedequity = 100000 * .10
if strategy.equity == 0
    seedequity
else
    strategy.equity
slowequityseed   = strategy.equity > seedequity ? strategy.equity : seedequity
fastequityseed   = strategy.equity > seedequity ? strategy.equity : seedequity
smaslowequity    = ta.sma(slowequityseed, slowequitylength)
smafastequity    = ta.sma(fastequityseed, fastequitylength)
equitycalc       = input.bool(true, title="Use Fast/Slow Avg", tooltip="Fast Equity Avg is below Slow---otherwise if unchecked uses Slow Equity Avg below Equity")
sizeadjstring    = input.string("Reduce size by (%)", title="Position Size Adjustment", options=["Reduce size by (%)","Increase size by (%)"])
sizeadjint       = input.int(50, title="Increase/Decrease % Equity by:")
equitydowntrendavgs = smafastequity < smaslowequity
slowequitylessequity = strategy.equity < smaslowequity

equitymethod = equitycalc ? equitydowntrendavgs : slowequitylessequity

if sizeadjstring == ("Reduce size by (%)")
    sizeadjdown = initialsize * (1 - (sizeadjint/100))
else
    sizeadjup = initialsize * (1 + (sizeadjint/100))
c = close
qty = 100000 * (initialsize / 100) / c
if useTEC and equitymethod
    if sizeadjstring == "Reduce size by (%)"
        qty := (strategy.equity * (initialsize / 100) * (1 - (sizeadjint/100))) / c
    else
        qty := (strategy.equity * (initialsize / 100) * (1 + (sizeadjint/100))) / c

//EXAMPLE TRADING STRATEGY INPUTS
CMO_Length = input.int(defval=9, minval=1, title='Chande Momentum Length')
CMO_Signal = input.int(defval=10, minval=1, title='Chande Momentum Signal')

chandeMO = ta.cmo(close, CMO_Length)
cmosignal = ta.sma(chandeMO, CMO_Signal)

SuperTrend_atrPeriod = input.int(10, "SuperTrend ATR Length")
SuperTrend_Factor = input.float(3.0, "SuperTrend Factor", step = 0.01)
Momentum_Length = input.int(12, "Momentum Length")
price = close

mom0 = ta.mom(price, Momentum_Length)
mom1 = ta.mom( mom0, 1)
[supertrend, direction] = ta.supertrend(SuperTrend_Factor, SuperTrend_atrPeriod)
stupind = (direction < 0 ? supertrend : na)
stdownind = (direction < 0? na : supertrend)

//TRADING CONDITIONS
longConditiondefault = ta.crossover(chandeMO, cmosignal) and (mom0 > 0 and mom1 > 0 and close > stupind) and defulttraderule
if (longConditiondefault)
    strategy.entry("DefLong", strategy.long)

shortConditiondefault = ta.crossunder(chandeMO, cmosignal) and (mom0 < 0 and mom1 < 0 and close < stdownind) and defulttraderule
if (shortConditiondefault)
    strategy.entry("DefShort", strategy.short)

longCondition = ta.crossover(chandeMO, cmosignal) and (mom0 > 0 and mom1 > 0 and close > stupind) and useTEC
if (longCondition)
    strategy.entry("AdjLong", strategy.long)

shortCondition = ta.crossunder(chandeMO, cmosignal) and (mom0 < 0 and mom1 < 0 and close < stdownind) and useTEC
if (shortCondition)
    strategy.entry("AdjShort", strategy.short)
plot(strategy.equity)
plot(smaslowequity, color=color.new(color.red, 0))
plot(smafastequity, color=color.new(color.green, 0))
- ডায়নামিক ওভালটাইটি ইনডিকেটর (VIDYA) এটিআর ট্রেন্ড ট্র্যাকিং বিপরীত কৌশলগুলির সাথে মিলিত
- চ্যান্ডে গতিশীলতা oscillator উপর ভিত্তি করে স্বনির্ধারিত গড় ফিরে ট্রেডিং কৌশল
- লিনিয়ার রিগ্রেশন সিল্যান্সের উপর ভিত্তি করে গতিশীল বাজার অবস্থা সনাক্তকরণ কৌশল
- এমএএইচএল ব্যান্ড
- সিগন্যাল দিয়ে Z স্কোর
- মাল্টি-এসএমএ ব্যাসার্ধের বিচ্ছিন্নতা এবং গতিশীল মুনাফা লক পরিমাণগত ট্রেডিং কৌশল
- ডায়নামিক ডংচিয়ান চ্যানেলের সাথে সহজ চলমান গড়ের সাথে মিশ্রিত একটি পরিমাণগত কৌশল
- ডাবল টাইমস্কেল গতি কৌশল
- এসএমএ ট্রেন্ড
- এসএমএ ক্রস এবং ট্রেডিং পরিস্রাবণ দ্বারা স্বয়ংক্রিয় গতিশীল স্টপ-হোল্ডিং স্টপ-হোল্ডিং কৌশল
- সিসিআই এমটিএফ ওব+ও
- আরও স্মার্ট ম্যাকডি
- ওসিসি কৌশল R5.1
- বিয়ার মার্কেটে স্বাগতম [30 মিনিট]
- সিডবস
- পিভট পয়েন্ট উচ্চ নিম্ন মাল্টি টাইম ফ্রেম
- ভূত প্রবণতা ট্র্যাকিং কৌশল ডাটাবেস
- ভূত প্রবণতা কৌশলগত ট্রেসিং ব্যবসা পুস্তিকা
- ভূত ট্রেন্ড ট্র্যাকিং কৌশল
- রেইনবো ওসিলেটর
- KLineChart-এর একটি ডেমো
- ভিলা ডায়নামিক পিভট সুপারট্রেন্ড কৌশল
- ক্রডলের সুপার ট্রেন্ড
- zdmre দ্বারা RSI
- FTL - পরিসীমা ফিল্টার X2 + EMA + UO
- ব্রাহ্মস্ত্রা
- মোবো ব্যান্ড
- SAR + 3SMMA SL & TP সহ
- এসএসএস
- চাঁদ উৎক্ষেপণ সতর্কতা টেমপ্লেট [সূচক]