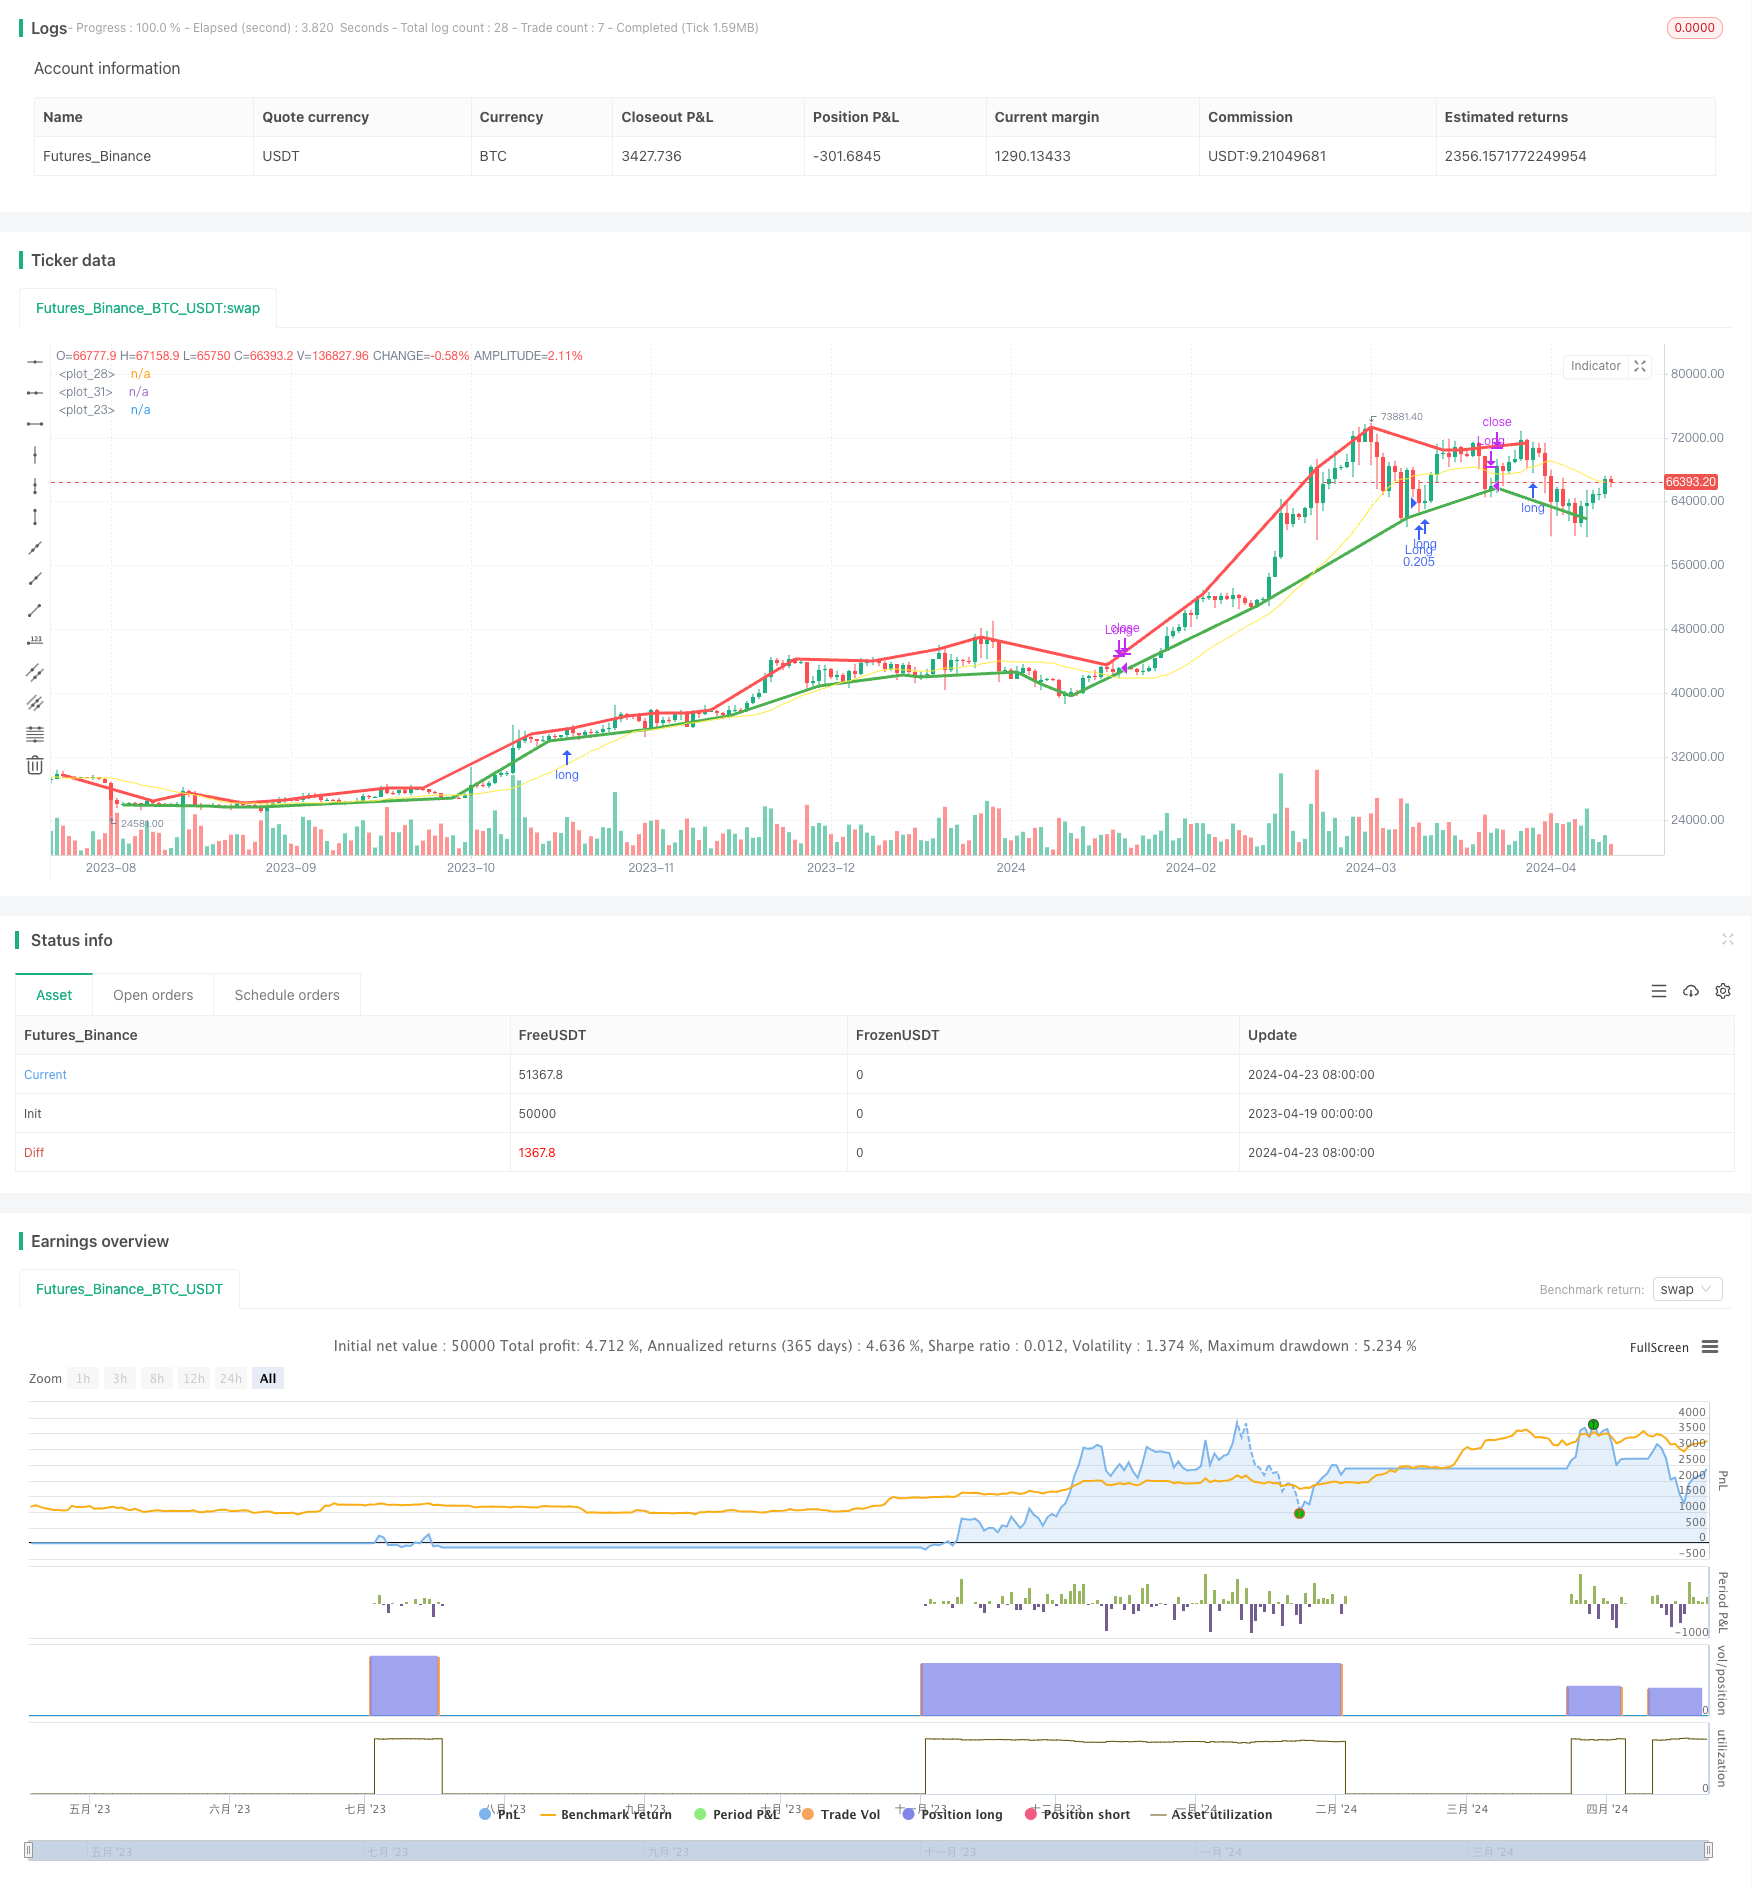
概述
该策略是一个双时间尺度动量策略。它通过在高级别时间周期上使用简单移动平均线(SMA)来判断趋势方向,在低级别时间周期上使用枢轴点(PivotLow和PivotHigh)来识别反转点。当高级别时间周期呈现上升趋势且低级别时间周期出现看涨枢轴点时开多,当高级别时间周期呈现下降趋势且低级别时间周期出现看跌枢轴点时开空。
策略原理
该策略的主要原理是高级别时间周期的趋势方向会影响低级别时间周期的走势。当高级别时间周期呈现上升趋势时,低级别时间周期的回调更可能是买入机会;当高级别时间周期呈现下降趋势时,低级别时间周期的反弹更可能是做空机会。该策略利用简单移动平均线(SMA)来判断高级别时间周期的趋势方向,利用枢轴点(PivotLow和PivotHigh)来识别低级别时间周期的反转点。
策略优势
- 双时间尺度分析,利用了高级别时间周期对低级别时间周期的影响,增加了交易的成功概率。
- 使用SMA判断趋势方向比较可靠,使用枢轴点捕捉反转点比较精准。
- 参数可调,适应性强。用户可以根据自己的需求调整高低时间尺度、SMA的周期、枢轴点的参数等。
- 逻辑清晰,容易理解和实现。
策略风险
- 趋势突变风险。如果高级别时间周期的趋势突然发生变化,低级别时间周期可能还没有反应过来,导致策略失效。
- 参数设置风险。不恰当的参数设置可能导致策略表现不佳。比如SMA周期选择过短可能导致频繁交易,选择过长可能导致趋势判断滞后。
- 极端行情风险。在极端行情下(如暴涨暴跌),该策略可能失效。因为这种行情下,低级别时间周期可能不遵循高级别时间周期的趋势。
策略优化方向
- 增加趋势变化的判断。可以增加一些逻辑来判断高级别时间周期趋势是否发生变化,以便更快地调整低级别时间周期的交易。
- 优化参数选择。可以使用一些参数优化的方法(如遗传算法、网格搜索等)来寻找最优参数组合。
- 增加风险控制。可以增加一些风险控制的措施(如止损、仓位管理等)来降低极端行情下的损失。
- 多因子融合。可以考虑将其他指标或因子(如波动率、成交量等)融入到该策略中,以提高策略的稳健性。
总结
该双时间尺度动量策略利用了高低级别时间周期之间的联系,通过在高级别时间周期判断趋势方向,在低级别时间周期捕捉反转点,以此实现趋势跟随和反转交易。该策略逻辑清晰,优势明显,但同时也存在一些风险。未来可以从趋势变化判断、参数优化、风险控制、多因子融合等方面对该策略进行优化,以提高其适应性和稳健性。
策略源码
/*backtest
start: 2023-04-19 00:00:00
end: 2024-04-24 00:00:00
period: 1d
basePeriod: 1h
exchanges: [{"eid":"Futures_Binance","currency":"BTC_USDT"}]
*/

// This Pine Script™ code is subject to the terms of the Mozilla Public License 2.0 at https://mozilla.org/MPL/2.0/
// © Riester

//@version=5
strategy("Dual Timeframe Momentum", overlay=true, precision=6, pyramiding=0, initial_capital=1000, default_qty_type=strategy.percent_of_equity, default_qty_value=25.0, commission_value=0.05)

n = input.int(20, "Moving Average Period", minval=1)
src = input.source(close, "Source")
high_tf = input.timeframe("240", "Resolution")
pivot_l = input.int(5, "Pivot Let Bars")
pivot_r = input.int(2, "Pivot Right Bars")

//-----------------------------------------------------------------------------------------------------------------------------------------------------------------
// Calculations
//-----------------------------------------------------------------------------------------------------------------------------------------------------------------

// 1. Define low and high timeframe prices
low_src = src
high_src = request.security(syminfo.tickerid, high_tf, src)

// 2. Use simple moving average to determine trend of higher timeframe (up or down)
high_tf_ma = ta.sma(high_src, n)
plot(high_tf_ma,  color=color.yellow)
high_tf_trend = high_tf_ma > high_tf_ma[1] ? 1 : -1

// 3. Use pivots to identify reversals on the low timeframe
low_tf_pl = ta.pivotlow(high_src, pivot_l, pivot_r)
plot(low_tf_pl, style=plot.style_line, linewidth=3, color= color.green, offset=-pivot_r)

low_tf_ph = ta.pivothigh(high_src, pivot_l, pivot_r)
plot(low_tf_ph, style=plot.style_line, linewidth=3, color= color.red, offset=-pivot_r)

bool long = low_tf_pl and high_tf_trend == 1
bool short = low_tf_ph and high_tf_trend == -1

//-----------------------------------------------------------------------------------------------------------------------------------------------------------------
// Plots
//-----------------------------------------------------------------------------------------------------------------------------------------------------------------

// this message is an alert that can be sent to a webhook, which allows for simple automation if you have a server that listens to alerts and trades programmatically.
enter_long_alert = '{"side": "Long", "order": "Enter", "price": ' + str.tostring(open) + ', "timestamp": ' + str.tostring(timenow) + '}'
exit_long_alert = '{"side": "Long", "order": "Exit", "price": ' + str.tostring(open) + ', "timestamp": ' + str.tostring(timenow) + '}'

if long
    strategy.entry(id="Long", direction=strategy.long, limit=open, alert_message=enter_long_alert)

if short
    strategy.close(id="Long", comment="Close Long", alert_message=exit_long_alert)
相关推荐