হডল লাইন
লেখক:চাওঝাং, তারিখ: ২০-০৫-২০২০২০ঃ৫৮ঃ২৮ট্যাগঃএইচএমএ
এই সূচকটি ষাঁড়ের বাজারের সময়গুলি নির্ধারণ করে যখন একটি কিনুন এবং ধরে রাখুন বিনিয়োগকারী সম্পদটি ধরে রাখতে পারে এবং হ্রাস বাজারের সময়গুলি যখন তাদের এটি রাখা এড়ানো উচিত। যদিও এটি মূলত ক্রিপ্টোকারেন্সিগুলি মাথায় রেখে ডিজাইন করা হয়েছিল, তবে এটি যে কোনও বাজারের জন্য সফলভাবে ব্যবহার করা যেতে পারে।
প্রযুক্তিগতভাবে, সূচকটি একটি অসমত্রিক প্রবণতা ফিল্টার যা এই সত্যকে বিবেচনা করার লক্ষ্যে তৈরি করা হয়েছে যে বাজারের বিক্রয়গুলি আপ-ট্রেন্ডের চেয়ে তীব্র হওয়ার প্রবণতা রয়েছে। অ্যালগরিদমটির দুটি পদ্ধতি রয়েছে
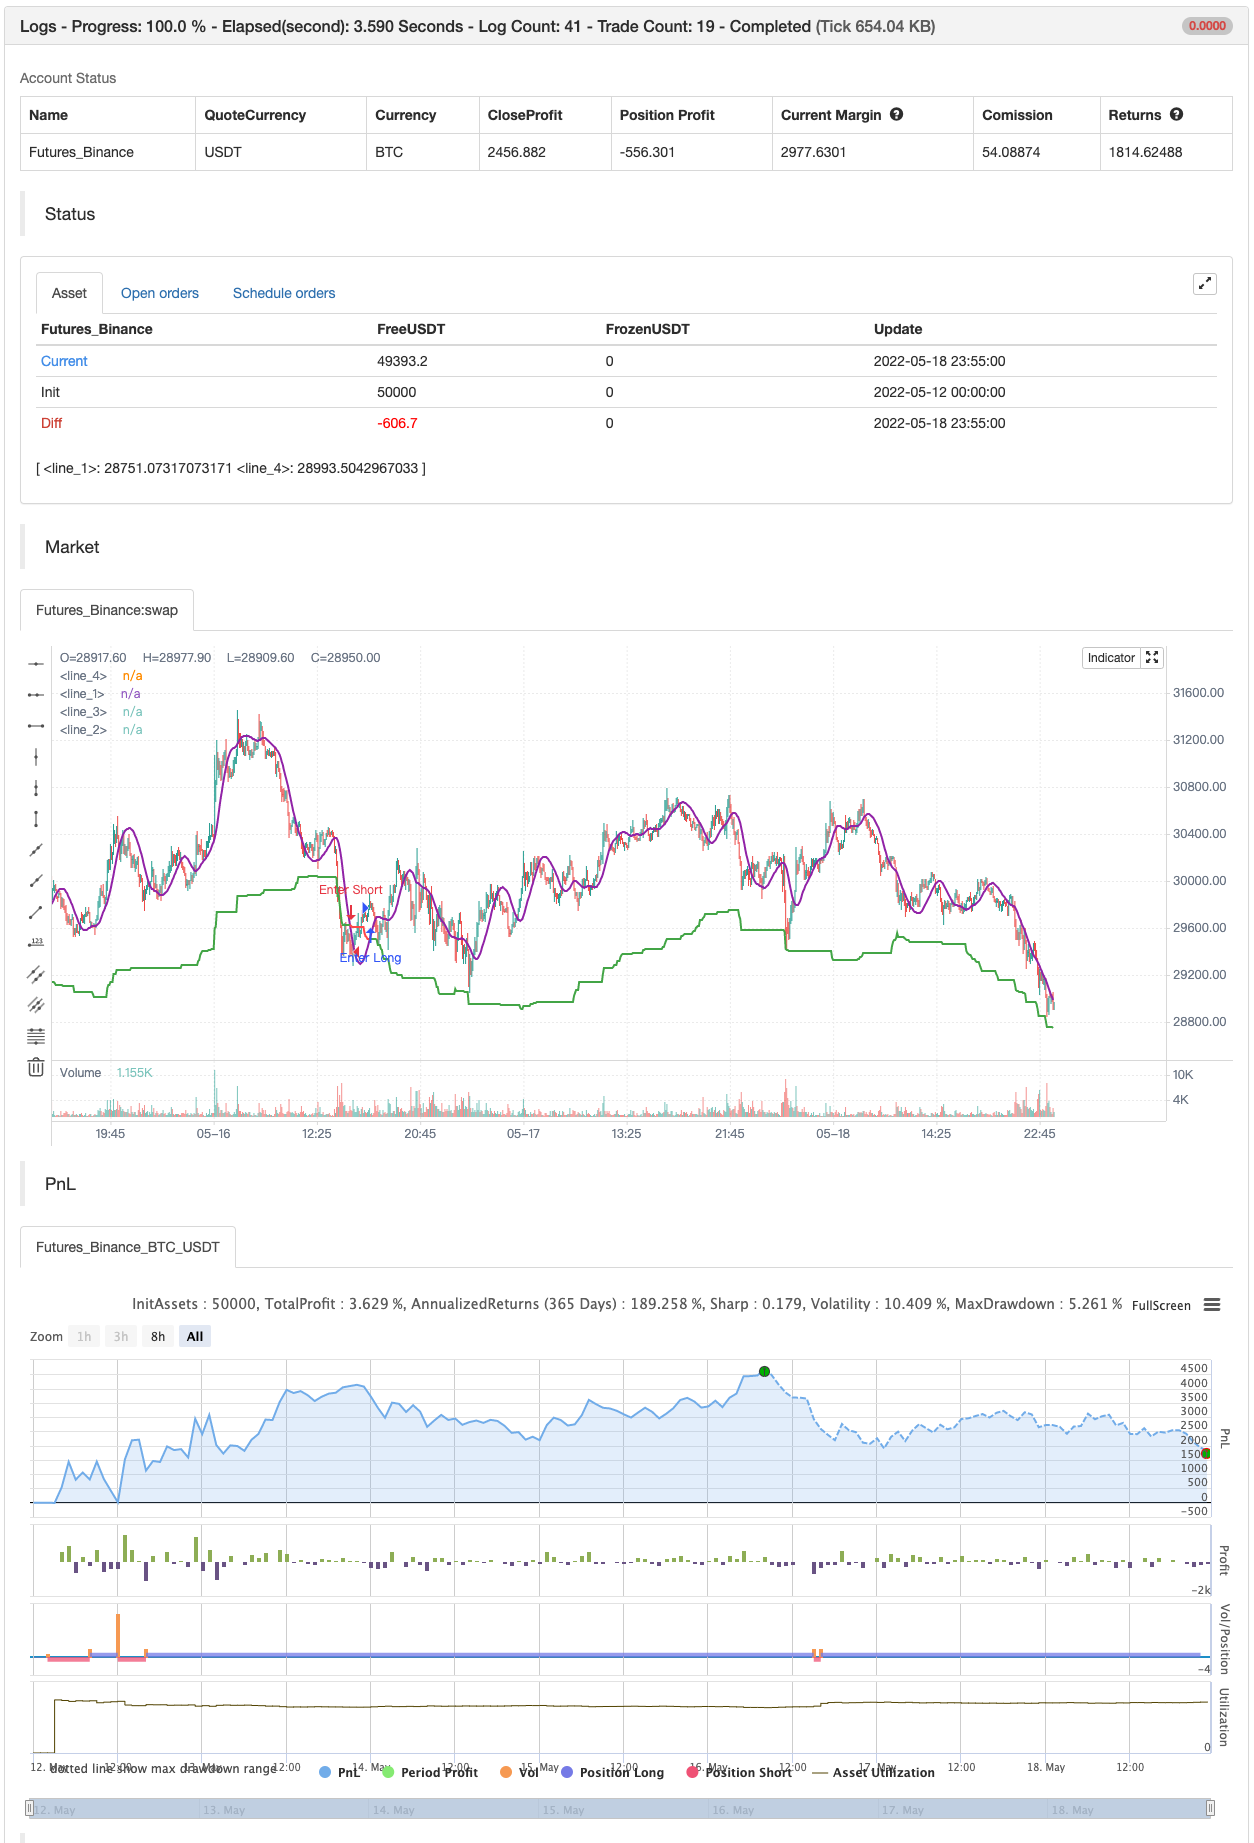
কিভাবে ব্যবহার করবেন ধাপের মতো লাইনটি মূল প্রবণতা ফিল্টার। এটি একটি আপট্রেন্ডে সবুজ এবং ডাউনট্রেন্ডে লাল রঙের। যখন মসৃণতা চালু থাকে, প্রবণতা ফিল্টারের পাশাপাশি সূচকটি একটি বেগুনি লাইন প্লট করে। এটি দামের একটি হুল মুভিং এভারেজ (এইচএমএ) । এই ক্ষেত্রে, সূচকটি প্রবণতা ফিল্টারের সাথে ক্রসিং খুঁজে পেতে দামের পরিবর্তে এই লাইনটি ব্যবহার করে। যখন দাম বা মসৃণ রেখা উপরে প্রবণতা ফিল্টার অতিক্রম করে, এটি একটি আপট্রেন্ড সংকেত। সূচকটি সবুজ বৃত্ত দিয়ে এই ধরনের ক্রসিং চিহ্নিত করে। এটি একটি আপট্রেন্ডে চার্ট পটভূমিকে সবুজ রঙও দেয়। দাম বা নীচের প্রবণতা ফিল্টারটি অতিক্রম করে বেগুনি রেখা একটি ডাউনট্রেন্ড সংকেত বোঝায়। ডাউনট্রেন্ড সংকেতগুলি লাল বৃত্ত হিসাবে প্রদর্শিত হয়। একটি ডাউনট্রেন্ডে চার্ট পটভূমি লাল হয়ে যায়।
সেটিংস
সংবেদনশীলতা
ব্যাকটেস্ট

/*backtest
start: 2022-05-12 00:00:00
end: 2022-05-18 23:59:00
period: 5m
basePeriod: 1m
exchanges: [{"eid":"Futures_Binance","currency":"BTC_USDT"}]
*/

// This source code is subject to the terms of the Mozilla Public License 2.0 at https://mozilla.org/MPL/2.0/
// © AstrideUnicorn

// Asymmetrical Trend Filter aka HODL Line

//@version=5
indicator("HODL LINE", overlay=true)

// initialize indicator period parameter and the asymmetry paramter
length = 300
asymmetry =  0.05 //input.float(defval=0.05,step=0.01, minval=0.01, maxval=0.3)

// script inputs
sensitivity = input.string(defval="Hold Short Term", title="Sensitivity", options=['Super Sensitive','Hold Short Term', 'Hold Medium Term', 'Hold Long Term'])
use_smoothing = input.bool(defval=true, title="Use Smoothing")


// Set the indicator period based on the choosen sensitivity
if sensitivity == 'Super Sensitive'
    length:=50

if sensitivity == 'Hold Short Term'
    length:=100

if sensitivity == 'Hold Medium Term'
    length:=300

if sensitivity == 'Hold Long Term'
    length:=500

// Calculate HODL Line - an assymetric trend filter
HODL_line = (ta.highest(close,length) + ta.lowest(close,length))/(2.0 + asymmetry)

// Calculate smoothed price time series
smoothed_price = ta.hma(close,50)

// Use closing price or smoothed price based on the choosen option for smoothing
price_model = use_smoothing ? smoothed_price : close

// Define conditional color for the HODL Line
hodl_line_color = price_model >= HODL_line ? color.green : color.red

// define the HODL Line crossing conditions
crossing_condition_bull = ta.crossover(price_model, HODL_line)
crossing_condition_bear = ta.crossunder(price_model, HODL_line)

// plotting
plot(HODL_line, color = hodl_line_color, linewidth = 2)

plot(crossing_condition_bull?HODL_line:na, color = color.new(color.green,40), style= plot.style_circles, linewidth = 20)
plot(crossing_condition_bear?HODL_line:na, color = color.new(color.red,40), style= plot.style_circles, linewidth = 20)

bgcolor(color.new(hodl_line_color,80))

plot(use_smoothing?price_model:na, color=color.purple, linewidth=2)

if crossing_condition_bull
    strategy.entry("Enter Long", strategy.long)
else if crossing_condition_bear
    strategy.entry("Enter Short", strategy.short)
- মাল্টি-ইন্ডিকেটর ফিউজিং ডায়নামিক মুভিং এভারেজ ক্রস কোয়ালিফাইং কৌশল
- মাল্টি-টাইম বোলিংগার মুভমেন্ট ব্রেকআউট স্ট্র্যাটেজি, হুল সমতল স্ট্র্যাটেজি এর সাথে মিলিত
- দ্বি-সমতল ক্রস-সংযুক্ত হুলের গতিশীল গড়ের পরিমাণগত কৌশল
- Hull Moving Average-এর উপর ভিত্তি করে প্রতিফলিত EMA ট্রেন্ড নির্ধারণের কৌশল
- নমনীয় মাল্টি-চক্র সমতল ক্রস কৌশল উন্নত সংস্করণ
- স্বনির্ধারিত মূল্যের ক্রস-ওয়েভেন ট্রেডিং কৌশল
- মাল্টি-ইন্ডিকেটর সংমিশ্রণ গতিশীল স্টপ লস ট্রেন্ড ট্র্যাকিং কৌশল
- এইচএমএ ডায়নামিক স্টপ লসগুলির সাথে মাল্টি-চক্রের পরিমাণগত ট্রেডিং কৌশল অপ্টিমাইজ করে
- উচ্চতর সমন্বিত গড় এবং বাজারের গতির প্রবণতা ক্যাপচার কৌশল
- মাল্টি-সাইক্লিকাল হুল চলমান গড়ের ক্রস কৌশল
- আরএসআই এবং এমএ সংমিশ্রণ কৌশল
- শ্যানন এন্ট্রপি ভি২
- ট্রেলিং স্টপ লস সঙ্গে SUPERTREND ATR
- ভলিউম ফ্লো v3
- ক্রিপ্টো ফিউচার মা & আরসি - ওগচেকার্সের সাথে ঘণ্টায় স্কালপিং
- এটিআর সমতল
- অর্ডার ব্লক ফাইন্ডার
- TrendScalp-FractalBox-3EMA
- QQE সংকেত
- U বিট গ্রিডের মাত্রা ফিল্টার
- সিএম এমএসিডি কাস্টম ইন্ডিকেটর - মাল্টিপল টাইম ফ্রেম - ভি২
- 2 চলমান গড় রঙের দিক সনাক্তকরণ
- Scalping PullBack টুল R1
- ক্রয় ও বিক্রয় কৌশল AO+Stoch+RSI+ATR এর উপর নির্ভর করে
- ইএমএ ট্রেন্ড ক্লাউড
- রেড কে ভলিউম-এক্সিলারেটেড দিকনির্দেশক শক্তির অনুপাত
- ডোনচিয়ান ব্রেকআউট কোন পুনরায় পেইন্ট
- রেড কে মোমেন্টাম বার
- সুপারজাম্প টার্ন ব্যাক বোলিঞ্জার ব্যান্ড
- ফুকুইজ ট্রেন্ড
- জনির বট