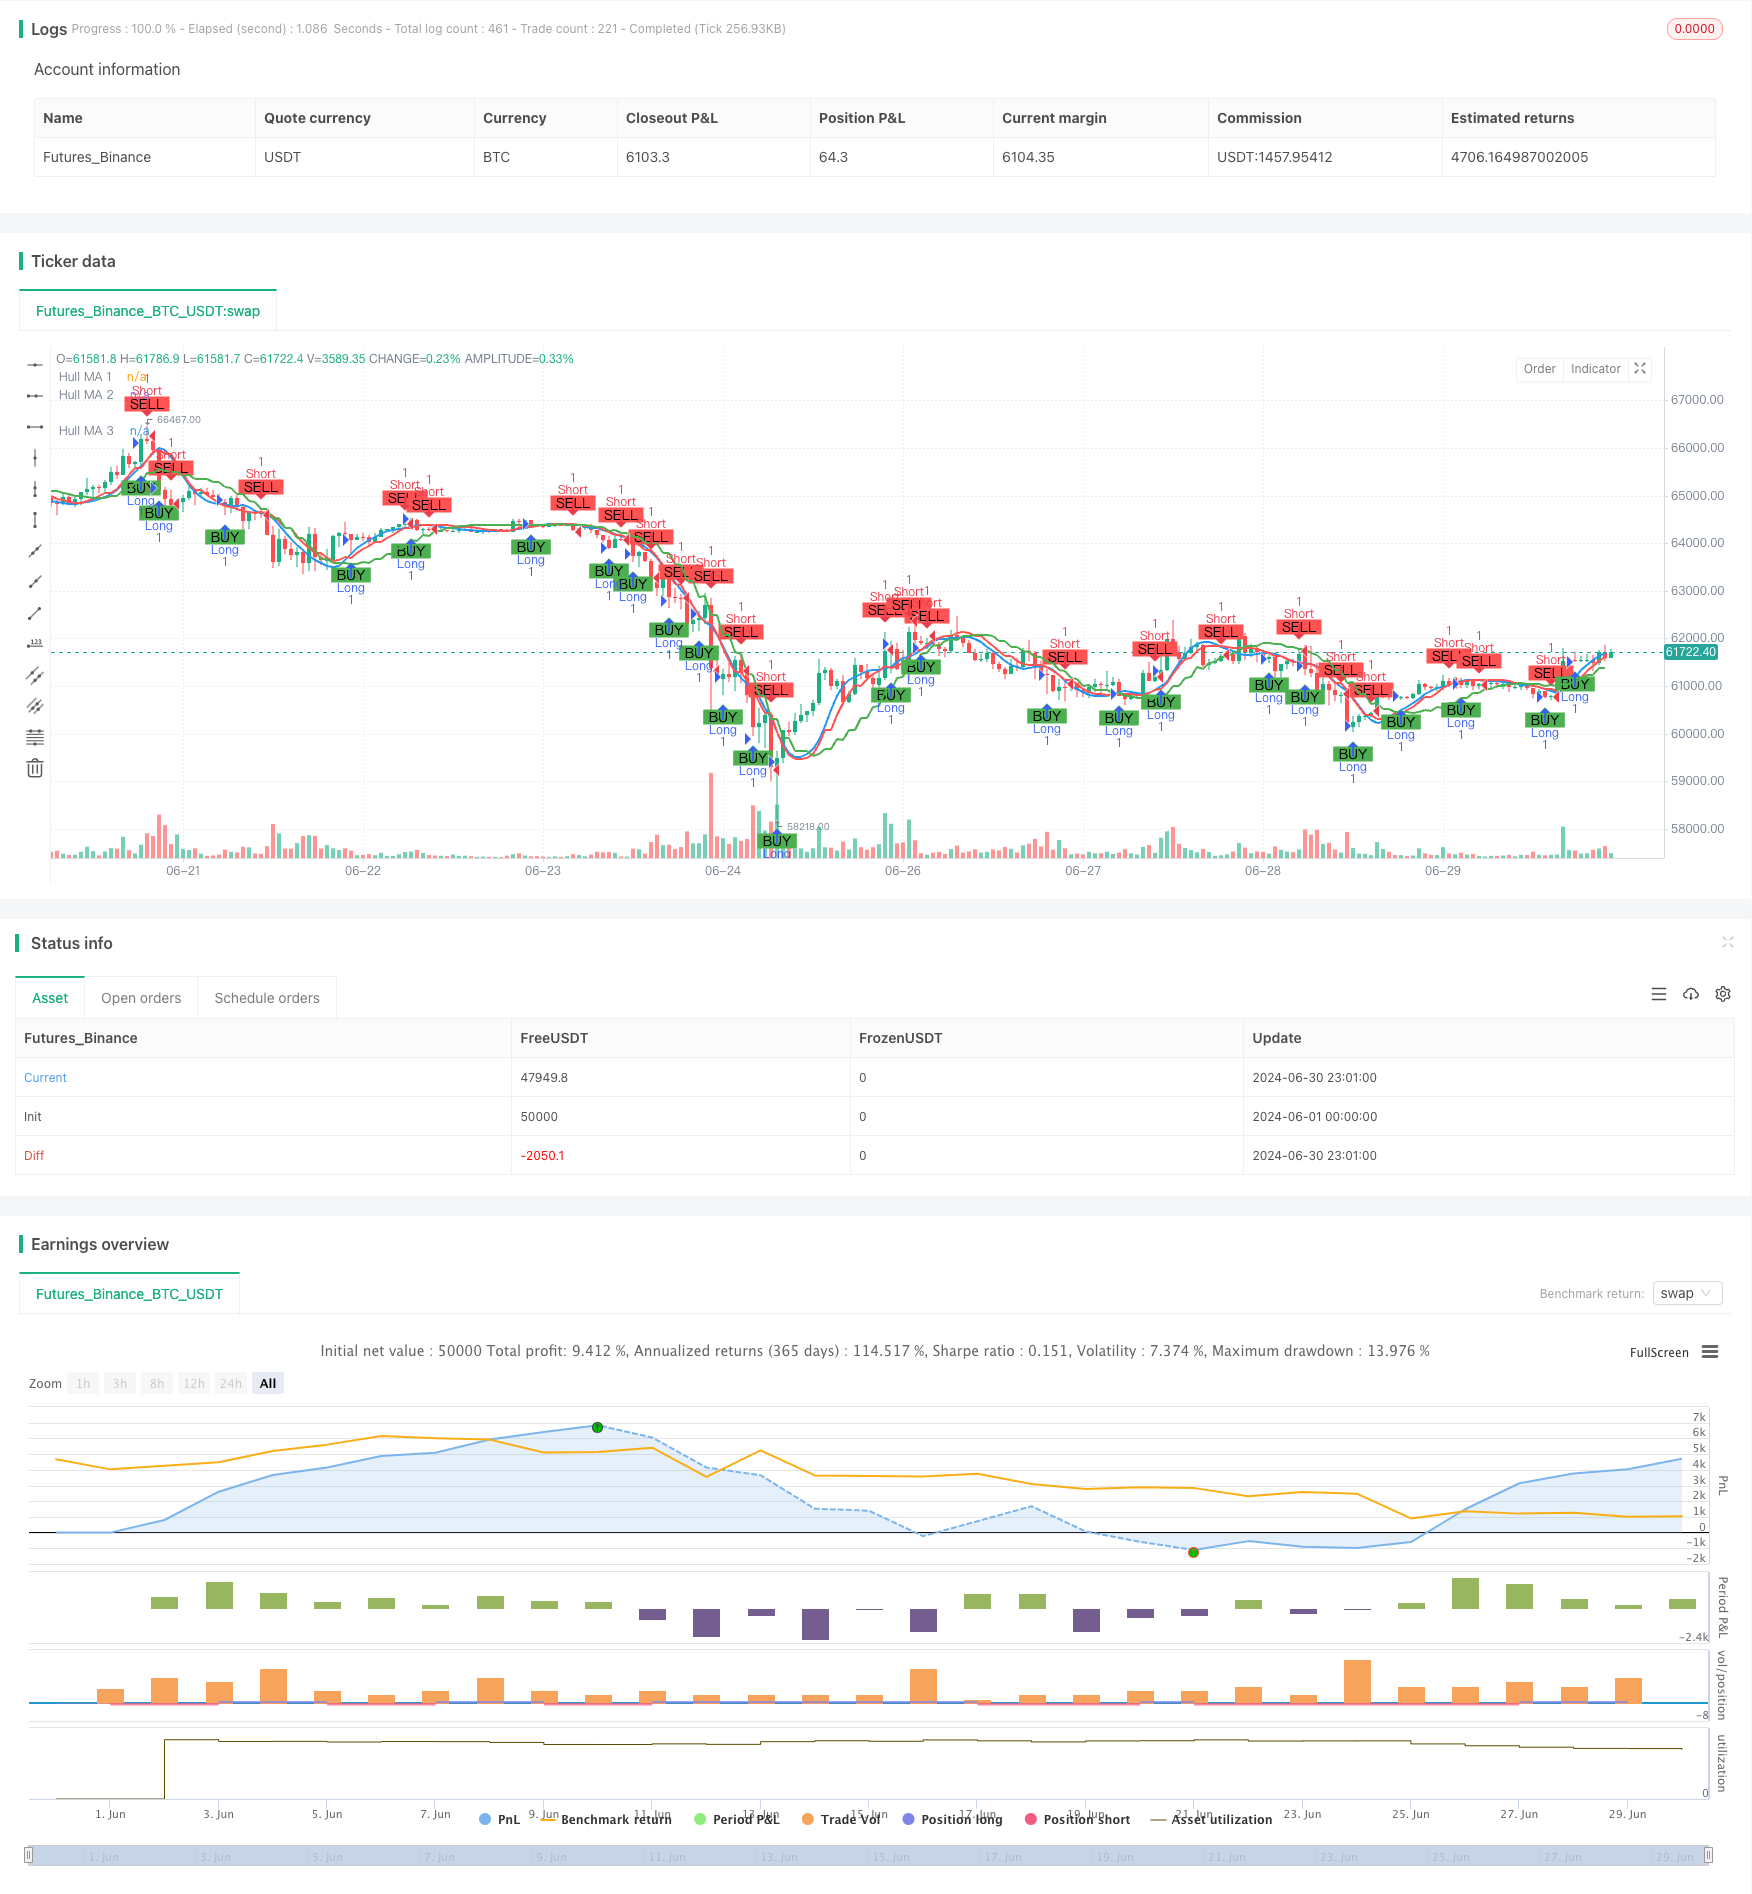
概述
多周期Hull移动平均线交叉策略是一个基于Hull移动平均线(HMA)的量化交易策略。该策略利用不同时间周期的HMA指标来识别市场趋势并生成交易信号。策略的核心是通过观察短期HMA与中期HMA的交叉来确定入场和出场时机,同时使用长期HMA作为整体趋势的参考。这种多周期approach能够有效地过滤噪音,提高交易决策的准确性。
策略原理
该策略的核心原理是利用Hull移动平均线(HMA)的快速响应特性和多周期分析的优势。具体实现如下:
计算三个不同周期的HMA:
- HMA 1: 25分钟周期
- HMA 2: 75分钟周期
- HMA 3: 125分钟周期
交易信号生成:
- 做多信号: 当HMA 1上穿HMA 2时
- 做空信号: 当HMA 1下穿HMA 2时
HMA 3作为长期趋势指标,虽然不直接参与信号生成,但可用于判断整体市场趋势。
策略使用固定比例的账户权益(10%)作为每次交易的资金量。
通过PlotShape函数在图表上标记买入和卖出信号,增强可视化效果。
设置了长短仓位的警报条件,便于实时监控市场机会。
策略优势
降低滞后性: Hull移动平均线本身就具有较低的滞后性,比传统移动平均线更快地响应价格变化。
多周期分析: 通过结合不同时间周期的HMA,策略能够同时捕捉短期、中期和长期趋势,提高交易的准确性和稳定性。
噪音过滤: 使用较长周期(75分钟和125分钟)的HMA可以有效过滤短期市场噪音,减少虚假信号。
灵活性: 策略允许用户自定义各个HMA的长度和数据源,适应不同的市场环境和交易风格。
风险管理: 使用账户权益的固定比例进行交易,有助于控制风险敞口。
可视化: 通过在图表上直观显示买卖信号,帮助交易者更好地理解和验证策略逻辑。
实时警报: 设置了交易信号警报,使得交易者能够及时把握市场机会。
策略风险
趋势反转风险: 在强趋势市场中,策略可能会频繁产生信号,导致过度交易和不必要的成本。
横盘市场风险: 在没有明显趋势的市场中,HMA交叉可能会产生大量虚假信号,影响策略表现。
参数敏感性: 策略性能高度依赖于所选择的HMA长度和时间周期,不同的参数组合可能导致截然不同的结果。
滑点和交易成本: 频繁的交易可能导致较高的滑点和交易成本,尤其是在流动性较低的市场中。
技术依赖性: 策略完全依赖于技术指标,忽视了基本面因素,可能在重大新闻或事件发生时表现不佳。
过度拟合风险: 如果在历史数据上过度优化参数,可能导致策略在实盘交易中表现不佳。
策略优化方向
引入趋势过滤器: 可以考虑使用HMA 3作为趋势过滤器,只在长期趋势方向上开仓,以减少逆势交易。
动态调整参数: 实现一个自适应机制,根据市场波动性动态调整HMA的长度和时间周期,以适应不同的市场环境。
增加止损和止盈机制: 引入基于ATR或固定百分比的止损和止盈规则,以更好地控制风险和锁定利润。
优化仓位管理: 实现更复杂的仓位管理策略,如基于波动性或账户盈亏的动态调整仓位大小。
整合其他技术指标: 结合如RSI、MACD等其他技术指标,构建更全面的入场和出场条件。
回测和优化: 在不同的市场条件和时间框架下进行广泛的回测,以找到最优的参数组合。
考虑基本面因素: 引入对重要经济数据发布或公司事件的考虑,在特定时期调整策略行为。
实现部分仓位交易: 允许策略根据信号强度执行部分仓位交易,而不是每次都全仓进出。
总结
多周期Hull移动平均线交叉策略是一个结合了Hull移动平均线快速响应特性和多周期分析优势的量化交易策略。通过观察不同时间周期HMA之间的交叉关系,策略能够有效识别市场趋势并生成交易信号。其优势在于降低了传统移动平均线的滞后性,同时通过多周期分析提高了信号的可靠性。然而,策略也面临着趋势反转、参数敏感性等风险。
为了进一步提高策略的稳健性和盈利能力,可以考虑引入趋势过滤器、动态参数调整、优化仓位管理等方向进行改进。同时,结合其他技术指标和基本面因素,可以构建一个更全面、更适应不同市场环境的交易系统。
总的来说,这个策略为交易者提供了一个有潜力的框架,通过持续的优化和完善,有望成为一个强大的量化交易工具。然而,在实际应用中,交易者仍需谨慎评估市场风险,并根据个人风险承受能力和交易目标进行相应的调整。
/*backtest
start: 2024-06-01 00:00:00
end: 2024-06-30 23:59:59
period: 1h
basePeriod: 15m
exchanges: [{"eid":"Futures_Binance","currency":"BTC_USDT"}]
*/

//@version=5
strategy(title='Hull v2 Strategy', shorttitle='V2 HMA', overlay=true)

// Hull MA 1
length_1 = input.int(20, minval=1, title="Length 1")
src_1 = input(close, title='Source 1')
timeframe_1 = input.timeframe('25')
hullma_1 = request.security(syminfo.tickerid, timeframe_1, ta.wma(2 * ta.wma(src_1, length_1 / 2) - ta.wma(src_1, length_1), math.round(math.sqrt(length_1))))
plot(hullma_1, title='Hull MA 1', color=color.blue, linewidth=2)

// Hull MA 2
length_2 = input.int(20, minval=1, title="Length 2")
src_2 = input(close, title='Source 2')
timeframe_2 = input.timeframe('75')
hullma_2 = request.security(syminfo.tickerid, timeframe_2, ta.wma(2 * ta.wma(src_2, length_2 / 2) - ta.wma(src_2, length_2), math.round(math.sqrt(length_2))))
plot(hullma_2, title='Hull MA 2', color=color.red, linewidth=2)

// Hull MA 3
length_3 = input.int(20, minval=1, title="Length 3")
src_3 = input(close, title='Source 3')
timeframe_3 = input.timeframe('125')
hullma_3 = request.security(syminfo.tickerid, timeframe_3, ta.wma(2 * ta.wma(src_3, length_3 / 2) - ta.wma(src_3, length_3), math.round(math.sqrt(length_3))))
plot(hullma_3, title='Hull MA 3', color=color.green, linewidth=2)

// Cross Strategy
longCondition = ta.crossover(hullma_1, hullma_2)
shortCondition = ta.crossunder(hullma_1, hullma_2)
// Entry and Exit
if (longCondition)
    strategy.entry("Long", strategy.long)
if (shortCondition)
    strategy.entry("Short", strategy.short)

// Plot Buy/Sell Signals
plotshape(series=longCondition, location=location.belowbar, color=color.green, style=shape.labelup, title='Buy Signal', text='BUY')
plotshape(series=shortCondition, location=location.abovebar, color=color.red, style=shape.labeldown, title='Sell Signal', text='SELL')

// Alerts
alertcondition(longCondition, title='Long Alert', message='Long Condition Met')
alertcondition(shortCondition, title='Short Alert', message='Short Condition Met')
- 双均线交叉结合赫尔移动平均线量化策略
- 灵活多周期均线交叉策略高级版
- RSI与MA组合策略
- 多指标融合动态移动平均线交叉量化策略
- 多重均线成交量净值震荡趋势转换交易策略
- 多重技术指标黄金即时变动检测与风险管理策略
- Hull Moving Average Swing Trader
- 均线,简单移动平均线,均线斜率,追踪止损,重新进场
- 双均线趋势跟踪交易系统与自适应动态过滤策略
- 基于平均方向指数过滤器的均线拒绝策略
- 多重指数移动平均交叉策略
- SMA交叉结合超趋势的自适应动量交易策略
- 加权移动平均线和相对强弱指数交叉策略与风险管理优化系统
- 双重平滑海肯阿希趋势跟随策略
- RSI 反转交叉动量盈利目标量化交易策略
- 多指标融合的自适应趋势跟踪策略
- 多指标综合交易策略:动量、超买超卖与波动率的完美结合
- 高精度RSI和布林带突破策略与优化风险比
- 高级EMA交叉策略:基于动态止损和获利目标的自适应交易系统
- EMA交叉指示双重止盈止损策略
- 动态移动止损双目标价均线交叉策略
- 动态自适应动量突破策略
- 自适应移动平均交叉追踪止损策略
- EMA趋势追踪自动化交易策略
- Darvas 盒子突破与风险管理策略
- 多时间框架融合型指数均线交叉策略
- SMA交叉多空策略结合峰值回撤控制与自动终止
- 高频翻转百分比追踪动量策略
- SMI与枢轴点结合的动量交叉策略
- 支撑阻力策略结合动态风险管理系统