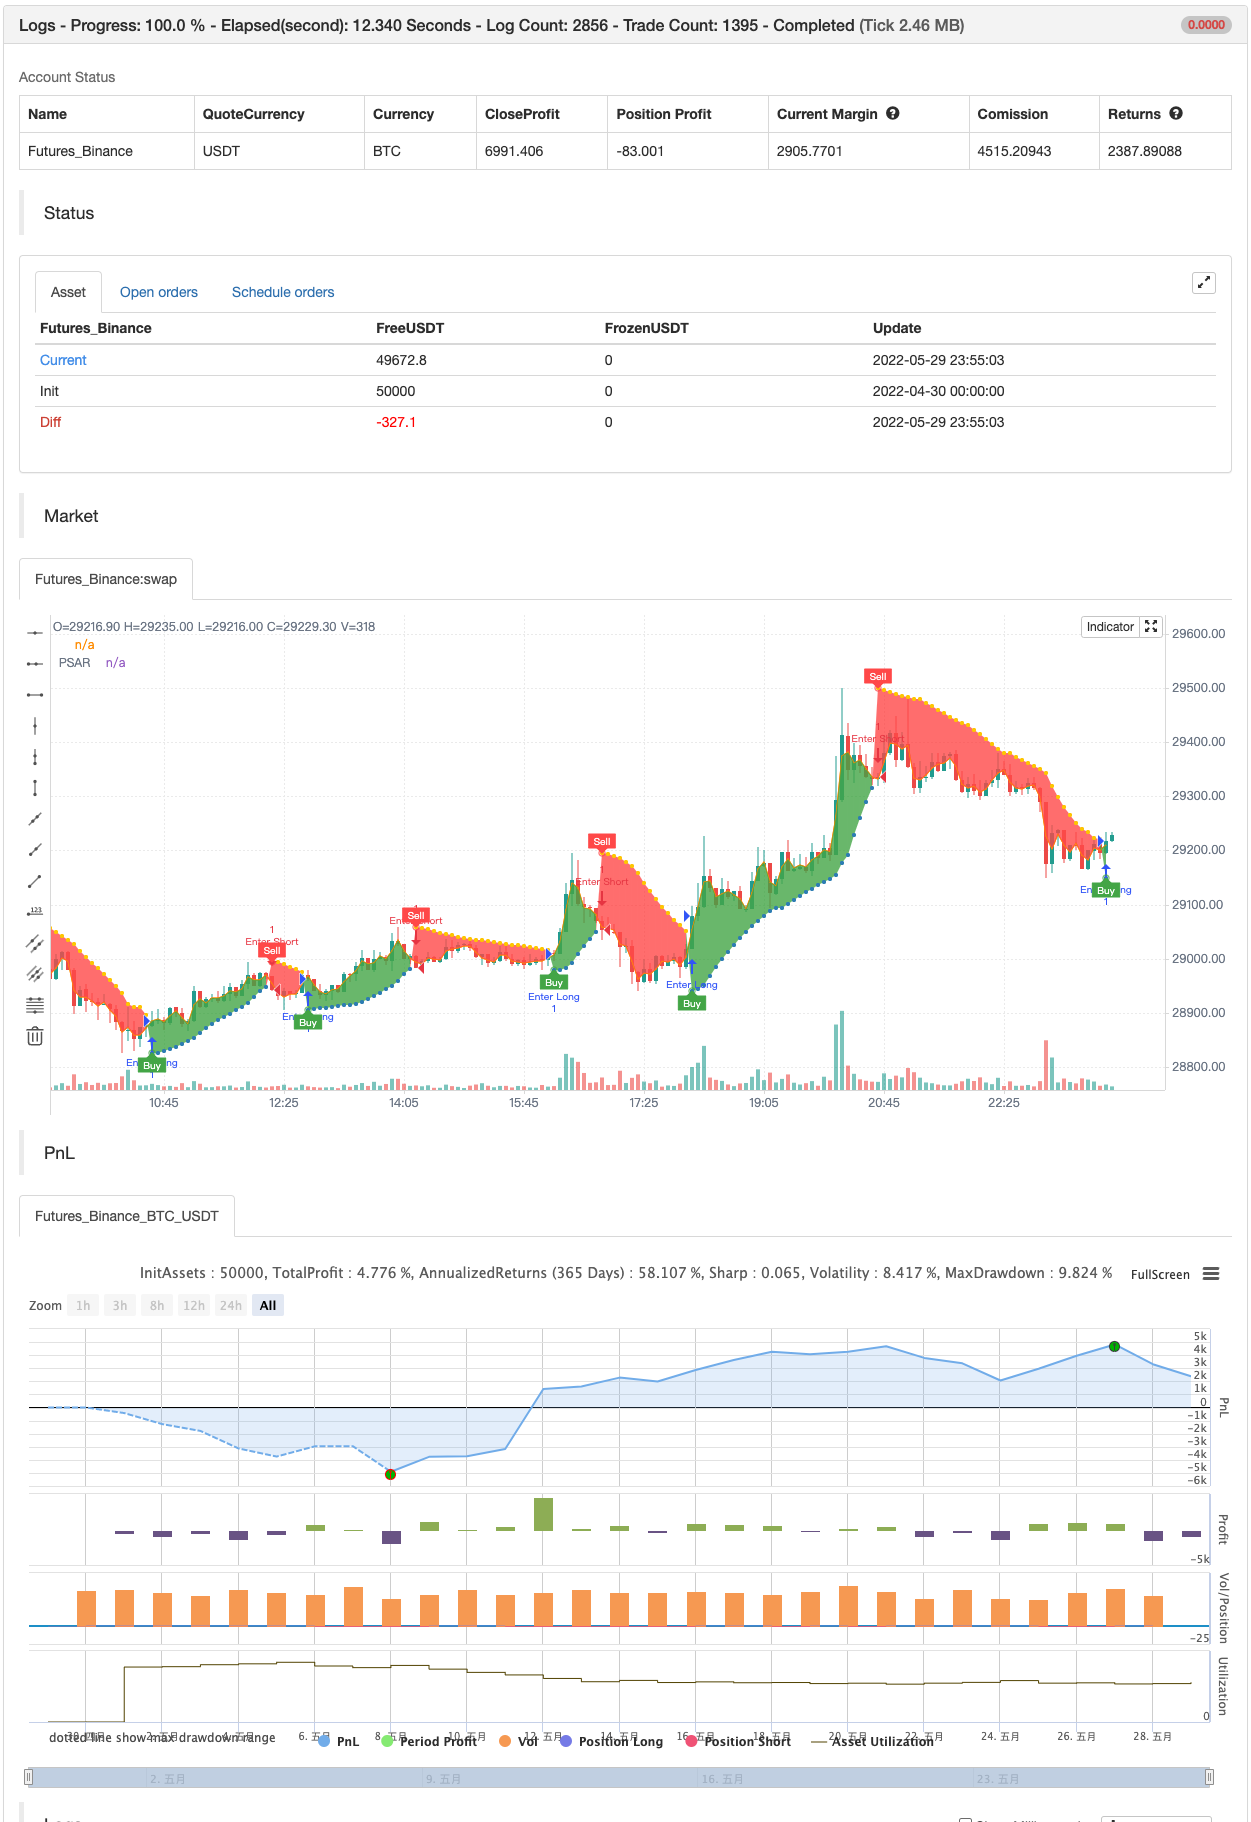
প্যারাবোলিক এসএআর
লেখক:চাওঝাং, তারিখ: ২০২২-০৫-৩১ ১৯ঃ০১ট্যাগঃএসএআর
এটি অন্তর্নির্মিত প্যারাবোলিক এসএআর সূচকটির একটি নতুন নকশা। আমি একটি সঠিক ইনপুট সিস্টেম যুক্ত করেছি, উভয় লাইনের জন্য প্রাথমিক পয়েন্টগুলি হাইলাইট করার একটি বিকল্প এবং পয়েন্টের প্রস্থ নির্বাচন করার একটি বিকল্প। সুতরাং, আপনি চান হিসাবে এটি কাস্টমাইজ করুন।
প্যারাবোলিক এসএআর মূলত জে ওয়েলস ওয়াইল্ডার দ্বারা বিকাশিত হয়েছিল এবং তার বইতে বর্ণনা করা হয়েছিল
PSAR জন্য সেটিংস আপনার যন্ত্র এবং সময়সীমার উপর সবচেয়ে লাভজনক হয় জানতে আপনি এই টুল ব্যবহার করতে পারেন
ব্যাকটেস্ট

/*backtest
start: 2022-04-30 00:00:00
end: 2022-05-29 23:59:00
period: 5m
basePeriod: 1m
exchanges: [{"eid":"Futures_Binance","currency":"BTC_USDT"}]
*/

//@version=4
// Copyright (c) 2019-present, Alex Orekhov (everget)
// Parabolic SAR script may be freely distributed under the terms of the GPL-3.0 license.
study("Parabolic SAR", shorttitle="PSAR", overlay=true)

start = input(title="Start", type=input.float, step=0.001, defval=0.02)
increment = input(title="Increment", type=input.float, step=0.001, defval=0.02)
maximum = input(title="Maximum", type=input.float, step=0.01, defval=0.2)
width = input(title="Point Width", type=input.integer, minval=1, defval=2)
highlightStartPoints = input(title="Highlight Start Points ?", type=input.bool, defval=true)
showLabels = input(title="Show Buy/Sell Labels ?", type=input.bool, defval=true)
highlightState = input(title="Highlight State ?", type=input.bool, defval=true)

psar = sar(start, increment, maximum)
dir = psar < close ? 1 : -1

psarColor = dir == 1 ? #3388bb : #fdcc02
psarPlot = plot(psar, title="PSAR", style=plot.style_circles, linewidth=width, color=psarColor, transp=0)

var color longColor = color.green
var color shortColor = color.red

buySignal = dir == 1 and dir[1] == -1
plotshape(buySignal and highlightStartPoints ? psar : na, title="Long Start", location=location.absolute, style=shape.circle, size=size.tiny, color=longColor, transp=0)
plotshape(buySignal and showLabels ? psar : na, title="Buy Label", text="Buy", location=location.absolute, style=shape.labelup, size=size.tiny, color=longColor, textcolor=color.white, transp=0)

sellSignal = dir == -1 and dir[1] == 1
plotshape(sellSignal and highlightStartPoints ? psar : na, title="Short Start", location=location.absolute, style=shape.circle, size=size.tiny, color=shortColor, transp=0)
plotshape(sellSignal and showLabels ? psar : na, title="Sell Label", text="Sell", location=location.absolute, style=shape.labeldown, size=size.tiny, color=shortColor, textcolor=color.white, transp=0)

midPricePlot = plot(ohlc4, title="", display=display.none)

fillColor = highlightState ? (dir == 1 ? longColor : shortColor) : na
fill(midPricePlot, psarPlot, title="Trade State Filling", color=fillColor)

changeCond = dir != dir[1]
alertcondition(changeCond, title="Alert: PSAR Direction Change", message="PSAR has changed direction!")
alertcondition(buySignal, title="Alert: PSAR Long", message="PSAR Long")
alertcondition(sellSignal, title="Alert: PSAR Short", message="PSAR Sell")


if buySignal
    strategy.entry("Enter Long", strategy.long)
else if sellSignal
    strategy.entry("Enter Short", strategy.short)
সম্পর্কিত বিষয়বস্তু
- বর্ধিত প্রবণতা ট্র্যাকিং কৌশলঃ ADX এবং প্যারালাইটিকাল SAR এর উপর ভিত্তি করে গতিশীল প্রবণতা সনাক্তকরণ সিস্টেম
- মাল্টি-ইন্ডিকেটর ট্রেন্ড ট্র্যাকিং এবং থাম্বনেইল অপ্টিমাইজেশান কৌশল
- প্যারালাইটিক এসএআর সূচক ট্রেডিং কৌশল থেকে বিচ্যুত
- বহু-পরিমাপক সমন্বিত লম্বা লাইন ট্রেডিং কৌশল
- একাধিক অর্ডার বিচ্ছিন্নতা ট্রেন্ড ট্র্যাক কৌশল
- সমান্তরাল EMA এবং প্যারালাইটিক SAR সংমিশ্রণ কৌশল
- EMA SAR এর মধ্যবর্তী দীর্ঘমেয়াদী প্রবণতা অনুসরণ কৌশল
- এলিয়ট তরঙ্গ তত্ত্ব 4-9 পালস তরঙ্গ স্বয়ংক্রিয়ভাবে ট্রেডিং কৌশল সনাক্ত করে
- এসএআর - উচ্চ এবং নিম্ন
- উচ্চ নিম্ন SAR
আরও দেখুন
- TUE ADX/MACD কনফ্লুয়েন্স V1.0
- টুইন রেঞ্জ ফিল্টার
- এসএআর - উচ্চ এবং নিম্ন
- সঠিক সুইং ট্রেডিং সিস্টেম
- রৈখিক প্রবণতা
- ফিবোনাচি টাইমিং প্যাটার্ন
- ডারভাস বক্স কিনুন বিক্রি করুন
- ডিমার্ক সেটআপ সূচক
- Bollinger Bands স্টোকাস্টিক RSI Extreme
- AK MACD BB INDICATOR V ১.০০
- আরএসআই ডিভার্জেন্স ইন্ডিকেটর
- OBV MACD সূচক
- পিভট ট্রেন্ড
- মূল্য বৈষম্য কৌশল v1.0
- সাপোর্ট-রেসিস্ট্যান্স ব্রেকআউট
- ঢাল অনুকূলনামূলক চলমান গড়
- ডেল্টা-আরএসআই দোলক কৌশল
- নিম্ন স্ক্যানার কৌশল ক্রিপ্টো
- [blackcat] L2 বিপরীত লেবেল কৌশল
- সুপার বি