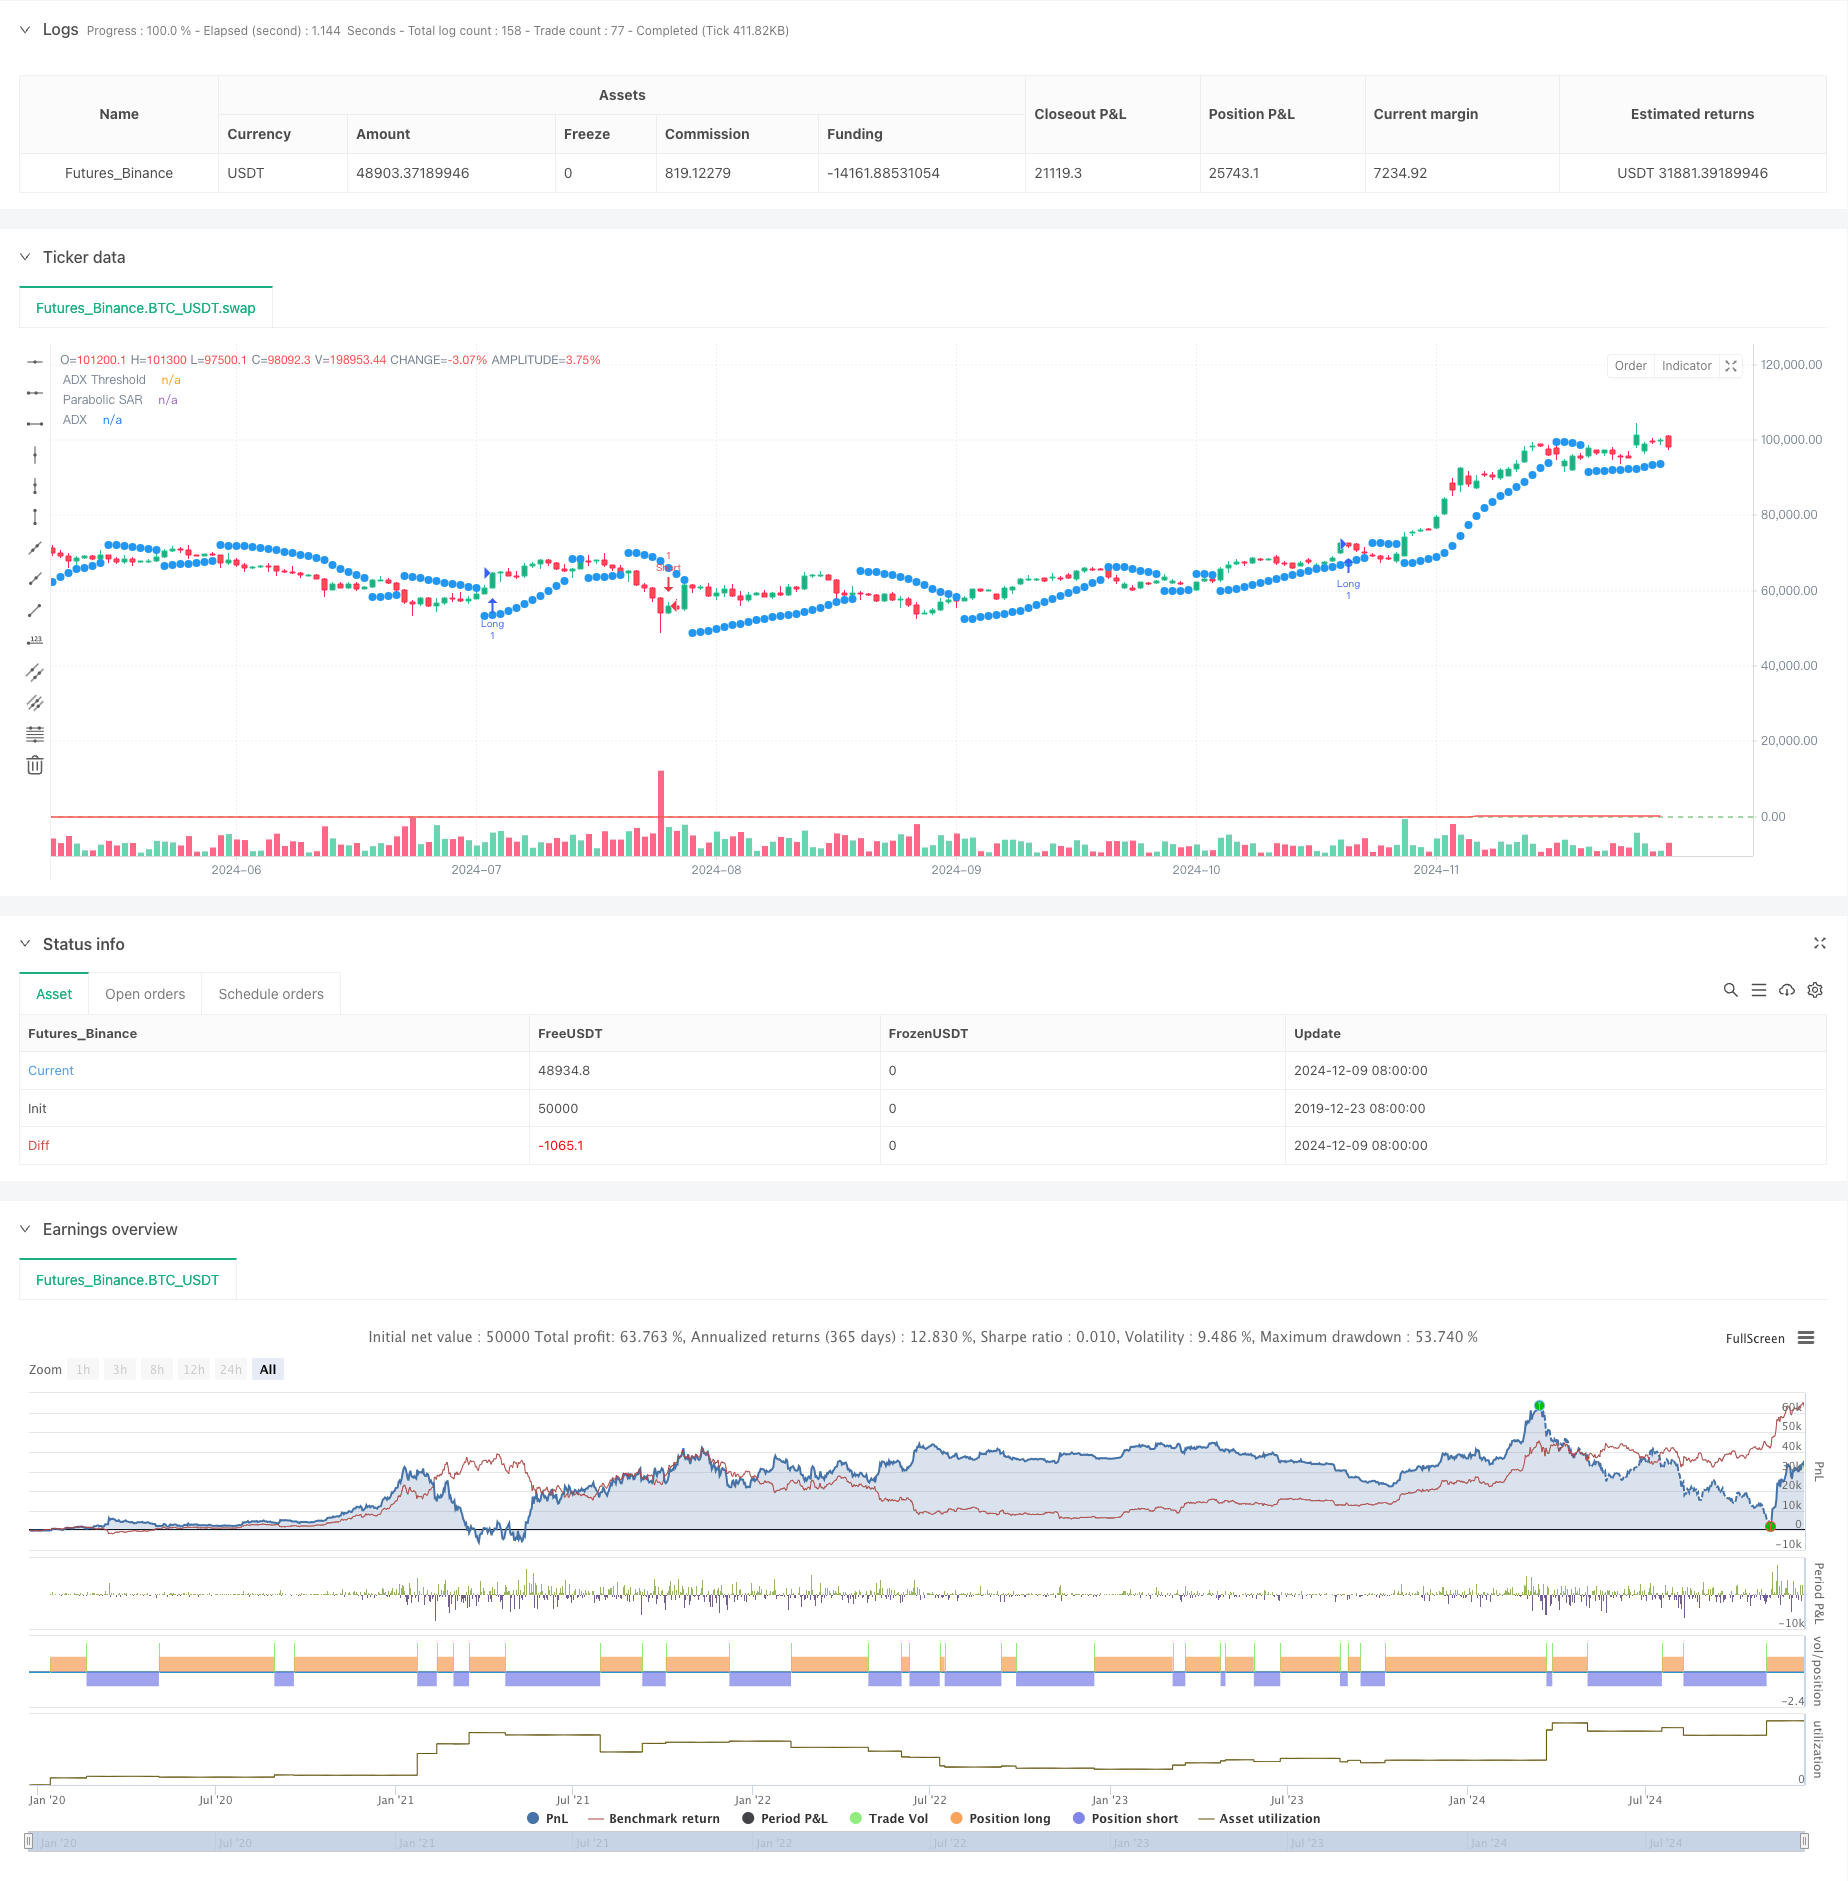
概述
本策略是一个结合了平均趋向指标(ADX)和抛物线止损转向指标(SAR)的趋势跟踪交易系统。该系统通过ADX来衡量趋势强度,利用SAR来确认趋势方向,从而在强趋势市场中捕捉交易机会。系统采用双重确认机制,既确保趋势的存在性,又验证趋势的可靠性。
策略原理
策略的核心逻辑基于以下几个关键组成部分: 1. ADX指标用于测量趋势强度,当ADX值超过25时,表明市场存在明显趋势。 2. DI+和DI-的交叉用于判断趋势方向,DI+大于DI-时代表上升趋势,反之则为下降趋势。 3. 抛物线SAR通过动态调整止损点来跟踪价格走势,为趋势方向提供额外确认。
交易信号的触发条件如下: - 做多条件:ADX>25且DI+>DI-且价格位于SAR之上 - 做空条件:ADX>25且DI->DI+且价格位于SAR之下 - 平仓条件:当出现相反的交易信号时
策略优势
- 双重确认机制显著提高了交易信号的可靠性
- 动态止损设置helps保护既有利润
- 参数可调整性强,适应不同市场环境
- 策略逻辑清晰,易于理解和执行
- 在强趋势市场中表现优异
策略风险
- 在震荡市场中可能产生频繁的假信号
- 入场点可能滞后于趋势起点
- 快速反转行情下可能承受较大回撤
- 参数设置不当可能影响策略表现
风险控制建议: - 设置最大回撤限制 - 根据市场波动调整参数 - 结合其他技术指标进行交易确认 - 实施仓位管理策略
策略优化方向
引入波动率指标调整参数
- 在高波动期间提高ADX阈值
- 在低波动期间降低SAR敏感度
优化出场机制
- 添加利润目标
- 设计动态止损策略
增加市场环境过滤
- 结合趋势线分析
- 考虑成交量因素
完善仓位管理
- 基于ATR设计仓位大小
- 实现分批建仓/平仓
总结
该策略通过结合ADX和SAR指标,构建了一个稳健的趋势跟踪系统。策略的主要优势在于其双重确认机制和动态止损设置,但在震荡市场中表现可能欠佳。通过合理的参数优化和风险控制,该策略能够在趋势明显的市场环境中获得良好表现。建议交易者在实盘应用前进行充分的回测,并根据具体市场特点调整参数设置。
策略源码
/*backtest
start: 2019-12-23 08:00:00
end: 2024-12-10 08:00:00
period: 1d
basePeriod: 1d
exchanges: [{"eid":"Futures_Binance","currency":"BTC_USDT"}]
*/

// This Pine Script™ code is subject to the terms of the Mozilla Public License 2.0 at https://mozilla.org/MPL/2.0/
// © traderhub

//@version=5
strategy("Trend Following ADX + Parabolic SAR", overlay=true)

// Strategy parameters
adxLength = input(14, title="ADX Period")
adxThreshold = input(25, title="ADX Threshold")
adxSmoothing = input(14, title="ADX Smoothing")
sarStart = input(0.02, title="Parabolic SAR Start")  // Starting acceleration factor
sarIncrement = input(0.02, title="Parabolic SAR Increment")  // Increment step
sarMax = input(0.2, title="Parabolic SAR Max")  // Maximum acceleration factor

// Calculate ADX, DI+, and DI-
[diPlus, diMinus, adx] = ta.dmi(adxLength, adxSmoothing)

// Parabolic SAR calculation
sar = ta.sar(sarStart, sarIncrement, sarMax)

// Conditions for a long position
longCondition = adx > adxThreshold and diPlus > diMinus and close > sar

// Conditions for a short position
shortCondition = adx > adxThreshold and diMinus > diPlus and close < sar

// Enter a long position
if (longCondition)
    strategy.entry("Long", strategy.long)

// Enter a short position
if (shortCondition)
    strategy.entry("Short", strategy.short)

// Close position on reverse signal
if (strategy.position_size > 0 and shortCondition)
    strategy.close("Long")
if (strategy.position_size < 0 and longCondition)
    strategy.close("Short")

// Plot indicators on the chart
plot(sar, color=color.blue, style=plot.style_circles, linewidth=2, title="Parabolic SAR")
plot(adx, color=color.red, title="ADX")
hline(adxThreshold, "ADX Threshold", color=color.green)
相关推荐