EMA SAR Medium-to-Long-Term Trend Following Strategy
Author: ChaoZhang, Date: 2024-05-17 15:22:15Tags: EMASAR
Overview
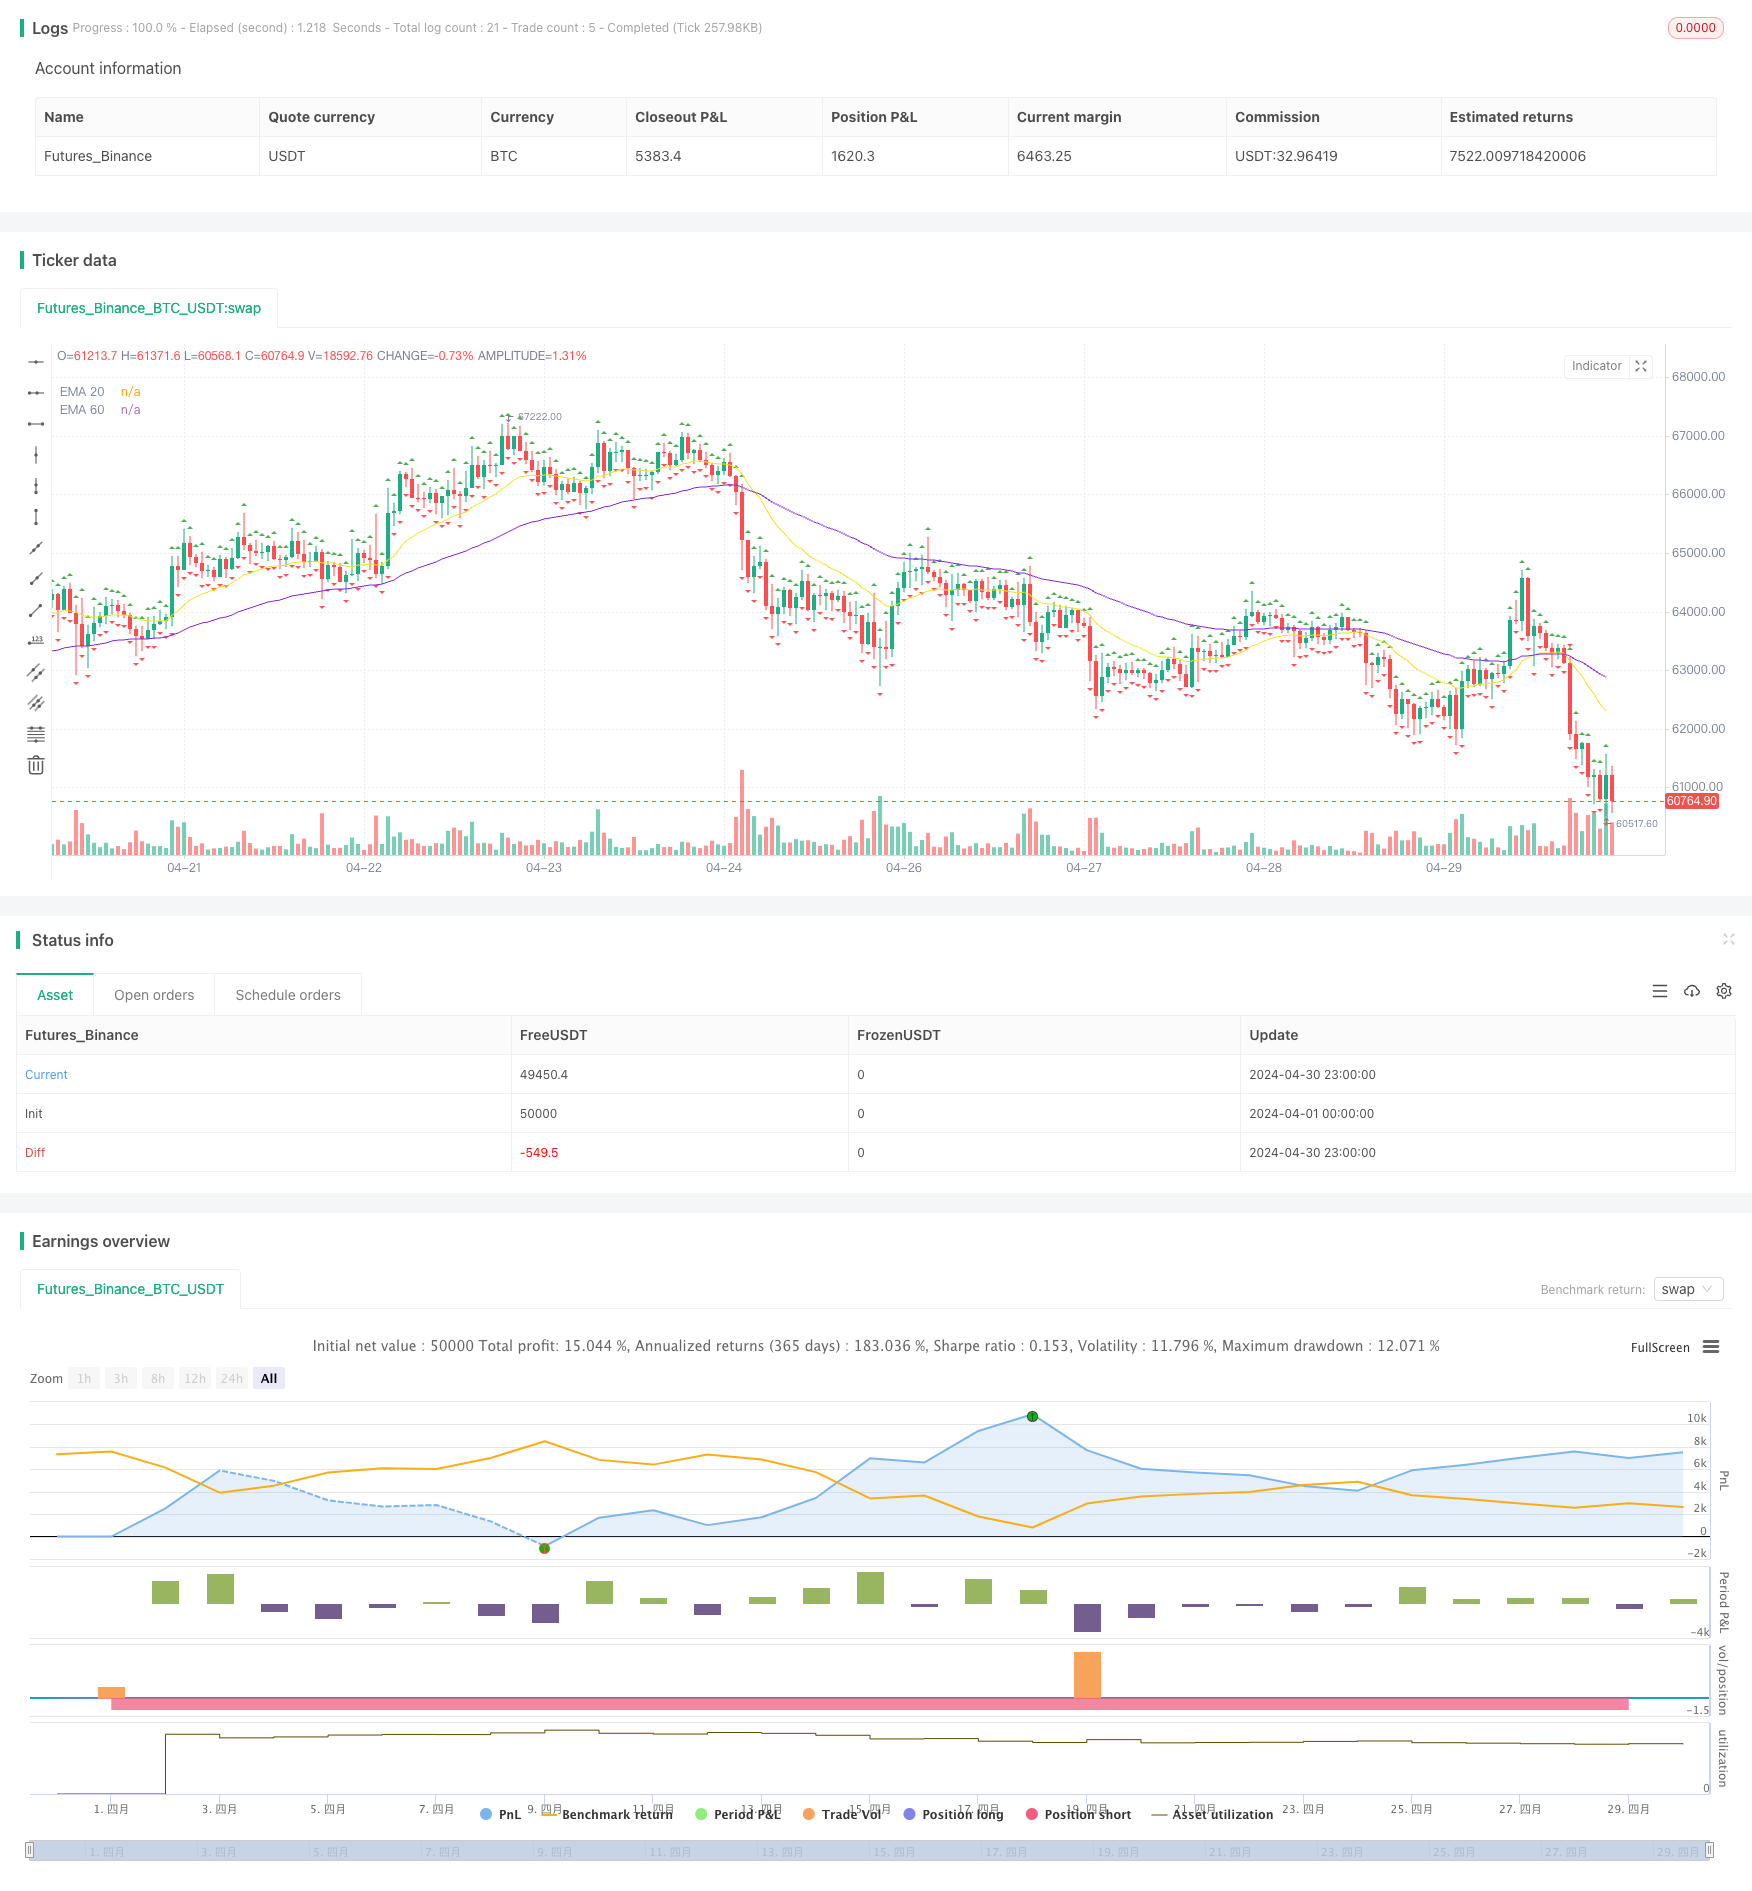
The EMA SAR Medium-to-Long-Term Trend Following Strategy is a quantitative trading strategy that utilizes a combination of Exponential Moving Averages (EMAs) and the Parabolic Stop and Reverse (SAR) indicator to capture medium-to-long-term trends in the market. The strategy determines the current market trend direction by comparing the 20-period and 60-period EMAs and confirming with the SAR indicator. The main objective of the strategy is to enter trades early in the formation of a trend and hold positions until a reversal signal appears.
Strategy Principle
The core of this strategy is to use the crossover of two EMAs with different periods (20 and 60) to determine the trend direction. When the 20-period EMA crosses above the 60-period EMA from below, it indicates that an uptrend may be forming; conversely, when the 20-period EMA crosses below the 60-period EMA from above, it suggests a potential downtrend. To further confirm the authenticity of the trend, the strategy also incorporates the SAR indicator. The strategy will only consider entering a trade when the EMA crossover occurs simultaneously with the SAR indicator showing a signal consistent with the trend (SAR below price in an uptrend, SAR above price in a downtrend).
Advantage Analysis
- By combining the EMA and SAR indicators, the strategy effectively filters out noise and false signals, improving the accuracy of trend identification.
- The strategy has a relatively low trading frequency, making it more suitable for capturing medium-to-long-term trends, which helps reduce trading costs and risks associated with frequent trading.
- Entering trades early in the formation of a trend allows the strategy to maximize the profit potential of each trend.
- The stop-loss is set at the previous trading day’s high (for long positions) or low (for short positions), effectively controlling the risk of individual trades.
Risk Analysis
- The strategy may generate numerous false signals during range-bound markets, leading to frequent trading and capital losses.
- The performance of the strategy heavily depends on the selection of EMA and SAR parameters, and different parameter settings may result in significant performance variations.
- In strong trending markets, the strategy may miss the best entry opportunities as it requires confirmation from both EMA crossover and SAR.
- The strategy lacks dynamic risk-reward balancing, and the risk taken in each trade may not be consistent.
Optimization Direction
- Consider incorporating additional technical indicators or market sentiment indicators to further improve the accuracy and reliability of trend identification.
- Optimize the parameters of the EMA and SAR to find the best-performing combinations under different market conditions.
- Introduce dynamic stop-loss and take-profit mechanisms to adjust risk control in real-time based on market volatility and individual stock characteristics.
- Combine with market leadership or sector rotation strategies to enhance adaptability and profit potential in strong trending markets.
Summary
The EMA SAR Medium-to-Long-Term Trend Following Strategy combines EMA and SAR indicators to enter trades early in the formation of a trend, aiming to capture medium-to-long-term trending opportunities in the market. The strategy’s advantages lie in its ability to filter out noise and hold positions once a trend is established to maximize profits. However, it may generate numerous false signals in range-bound markets, and its performance is significantly influenced by parameter selection. Future enhancements to the strategy could involve incorporating additional indicators, parameter optimization, dynamic risk management, and integration with other strategies to improve its robustness and profit potential across different market environments.
/*backtest
start: 2024-04-01 00:00:00
end: 2024-04-30 23:59:59
period: 1h
basePeriod: 15m
exchanges: [{"eid":"Futures_Binance","currency":"BTC_USDT"}]
*/

//@version=5
strategy("EMA SAR Strategy", overlay=true)

// EMA Settings
ema_20 = ta.ema(close, 20)
ema_60 = ta.ema(close, 60)

/// SAR Settings
sar = ta.sar(0.02, 0.2, 0.2)
sar_value = sar
is_trend_up = sar[1] > sar[2] ? true : false  // Evaluating the trend direction

/// Condition for Buy Signal
buy_condition = ta.crossover(ema_20, ema_60) and (sar_value < ema_20) and (is_trend_up)

// Condition for Sell Signal
sell_condition = ta.crossunder(ema_20, ema_60) and (sar_value > ema_20) and (not is_trend_up)

// Define Entry Time
entry_time = time + 180000

// Strategy Entry
strategy.entry("Buy", strategy.long, when=buy_condition, comment="Buy Signal", stop=high[1])
strategy.entry("Sell", strategy.short, when=sell_condition, comment="Sell Signal", stop=low[1], when=entry_time)

// Plot EMAs
plot(ema_20, color=#f3e221, linewidth=1, title="EMA 20")
plot(ema_60, color=#8724f0, linewidth=1, title="EMA 60")

// Plot SAR
plotshape(sar_value, style=shape.triangleup, location=location.abovebar, color=color.green, size=size.small, title="SAR Up")
plotshape(sar_value, style=shape.triangledown, location=location.belowbar, color=color.red, size=size.small, title="SAR Down")

// Plot Buy and Sell Signals
plotshape(series=buy_condition, title="Buy Signal", location=location.belowbar, color=color.green, style=shape.triangleup, size=size.small)
plotshape(series=sell_condition, title="Sell Signal", location=location.abovebar, color=color.red, style=shape.triangledown, size=size.small)

// Send Alerts
alertcondition(condition=buy_condition, title="Buy Signal", message="Buy Signal - EMA SAR Strategy")
alertcondition(condition=sell_condition, title="Sell Signal", message="Sell Signal - EMA SAR Strategy")
- EMA and Parabolic SAR Combination Strategy
- HIGH LOW SAR
- Multi-Order Breakout Trend Following Strategy
- Elliott Wave Theory 4-9 Impulse Wave Automatic Detection Trading Strategy
- CM Sling Shot System
- EMA Trend-Following Automated Trading Strategy
- Triple EMA with Dynamic Support/Resistance Trading Strategy
- Range Filter Buy and Sell 5min [Strategy]
- Sidboss
- Buy/Sell Strat
- SMC Market High-Low Breakout Strategy
- Dynamic Trend Momentum Trading Strategy
- EMA Crossover with Short-term Signals Strategy
- Ichimoku Cloud and ATR Strategy
- BONK Multi-Factor Trading Strategy
- Dual Moving Average Crossover Strategy
- HalfTrend Bullish and Bearish Trend Following Stop-Limit Buy Strategy
- Alligator Long-Term Trend Following Trading Strategy
- Multi-timeframe Trend Tracking Strategy Based on Impulse MACD and Dual Moving Average Crossover
- EMA5 and EMA13 Crossover Strategy
- Reverse Volatility Breakout Strategy
- Nifty 50 3-Minute Opening Range Breakout Strategy
- Dynamic Stop Loss and Take Profit Bollinger Bands Strategy
- Improved Swing High/Low Breakout Strategy with Bullish and Bearish Engulfing Patterns
- Laguerre RSI with ADX Filtered Trading Signals Strategy
- Price and Volume Breakout Buy Strategy
- K Consecutive Candles Bull Bear Strategy
- Super Moving Average and Upperband Crossover Strategy
- Multi-factor Trend Following Quantitative Trading Strategy Based on RSI, ADX, and Ichimoku Cloud
- RSI and MACD Combined Long-Short Strategy