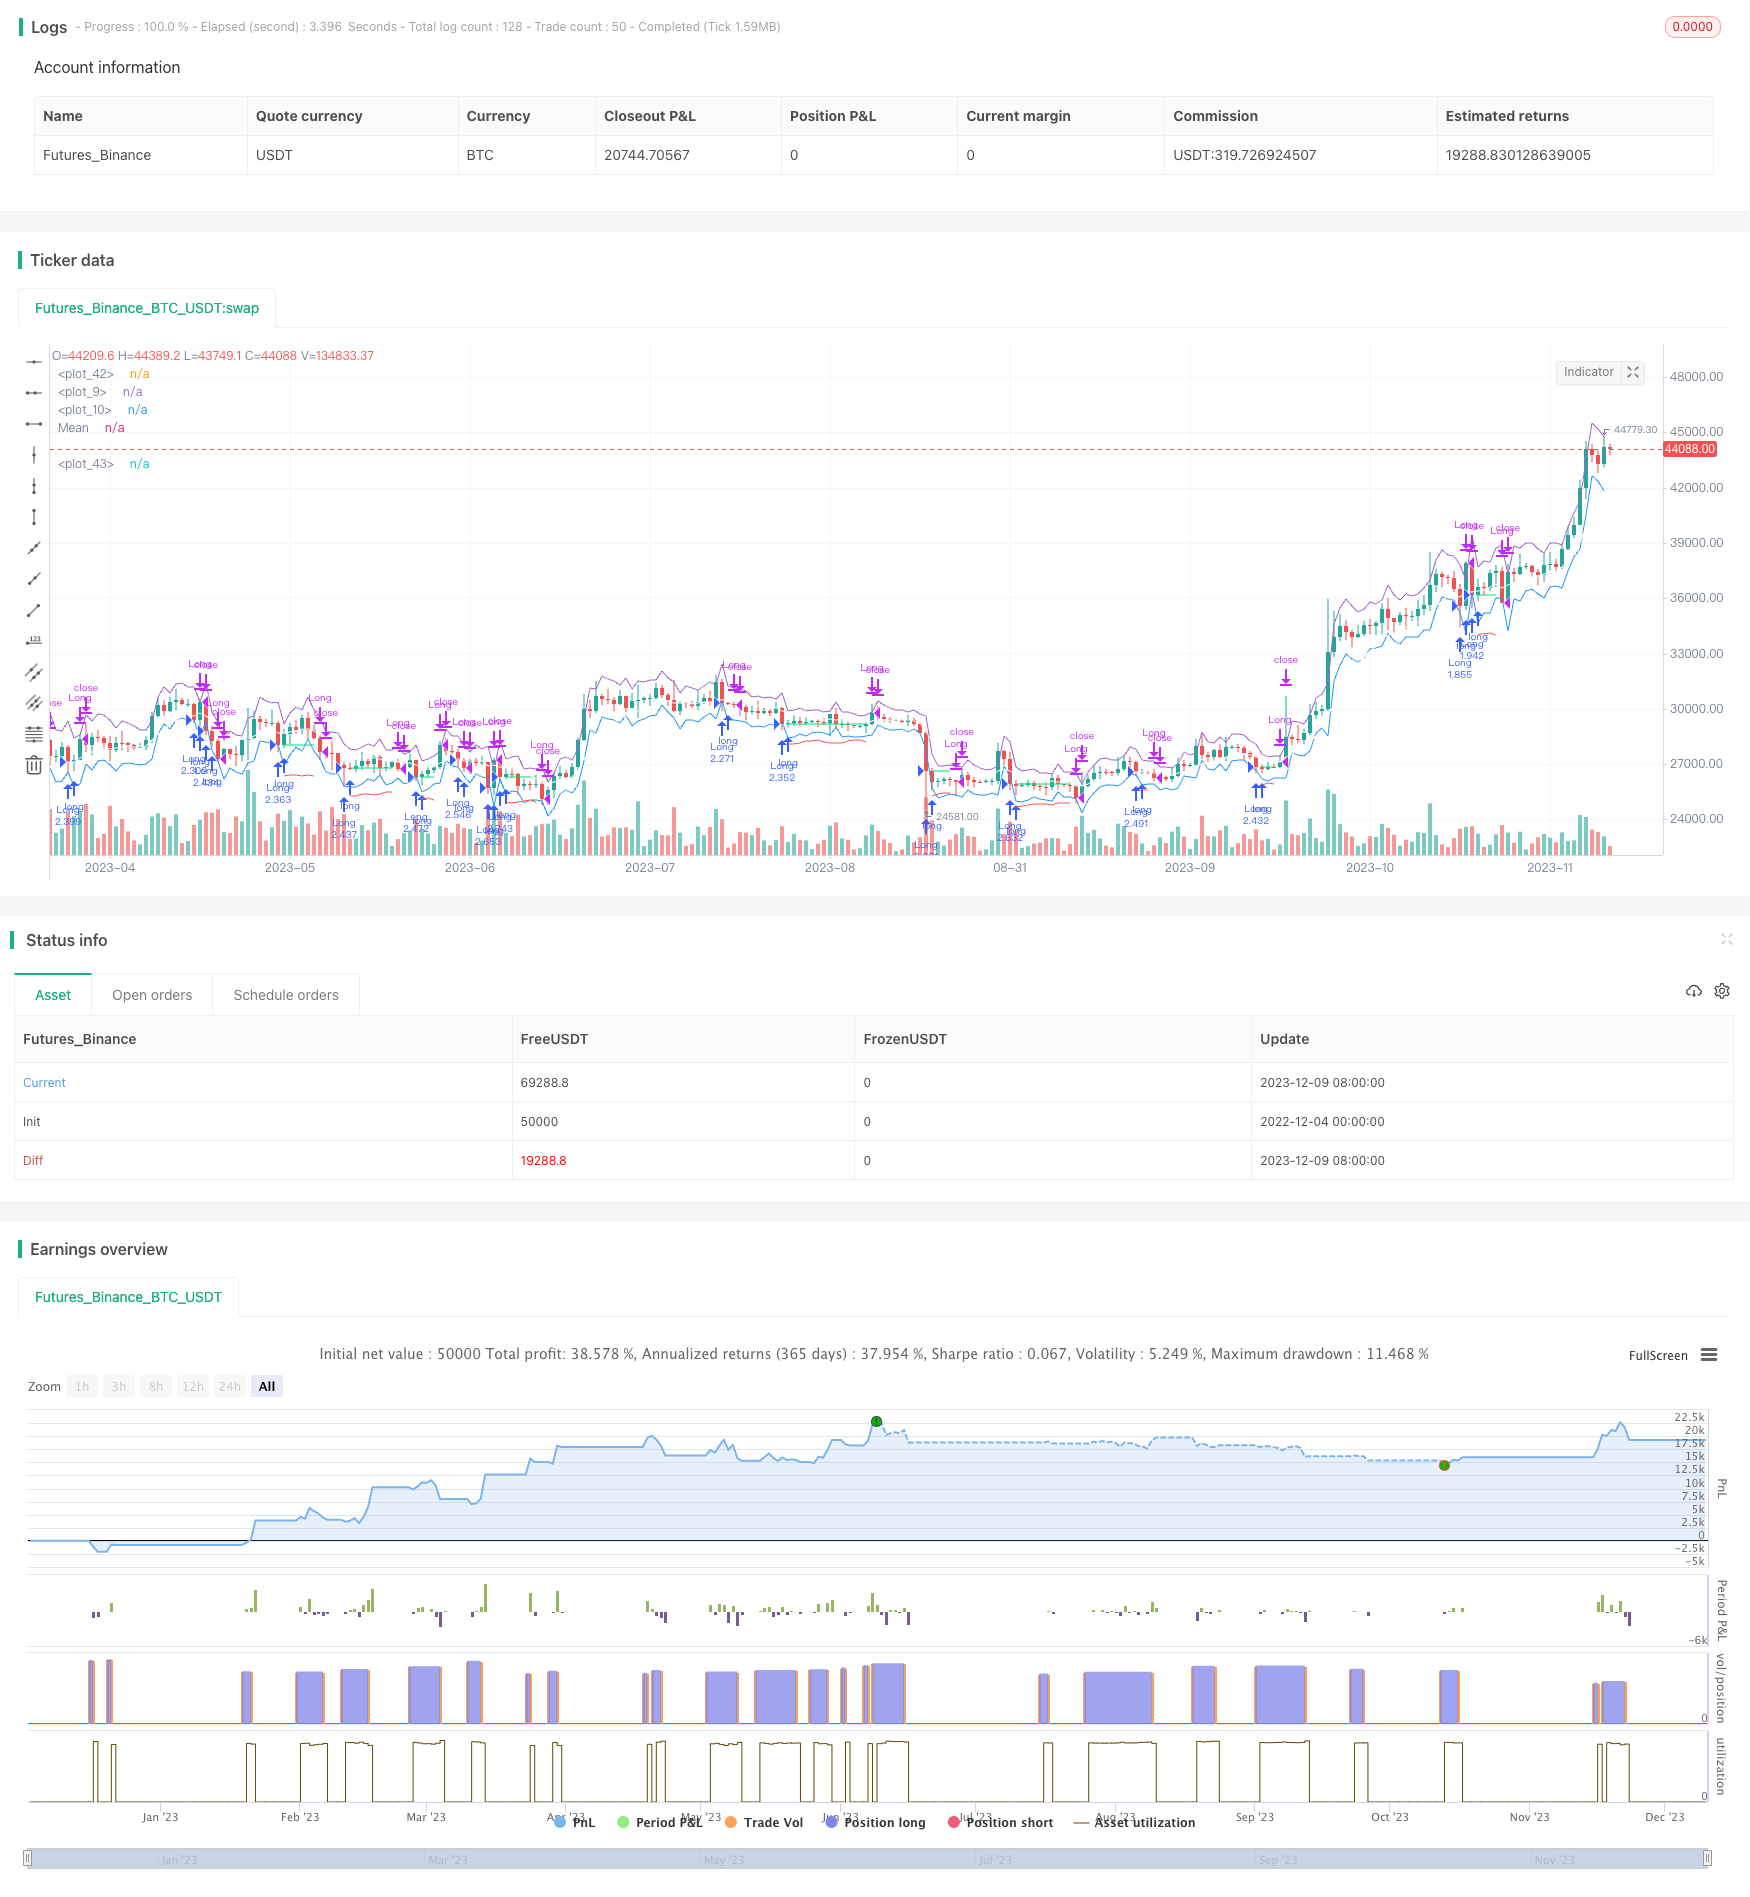
এটিআর চ্যানেল গড় বিপরীতের পরিমাণগত ট্রেডিং কৌশল
লেখক:চাওঝাং, তারিখ: ২০২৩-১২-১১ ১৫ঃ৩৮ঃ২৫ট্যাগঃ

সারসংক্ষেপ
এটি একটি দীর্ঘ-কেবল কৌশল যা যখন দামগুলি এটিআর চ্যানেলের নীচের ব্যান্ডের নীচে ভেঙে যায় তখন প্রবেশ সংকেতগুলি সনাক্ত করে এবং যখন দামগুলি এটিআর চ্যানেলের মাঝারি ব্যান্ড (ইএমএ) বা উপরের ব্যান্ডে পৌঁছে যায় তখন মুনাফা নেয়। এটি স্টপ লস স্তর গণনা করতে এটিআরও ব্যবহার করে। এই কৌশলটি দ্রুত স্বল্পমেয়াদী ব্যবসায়ের জন্য উপযুক্ত।
কৌশলগত যুক্তি
যখন মূল্য নিম্ন এটিআর ব্যান্ডের নীচে ভেঙে যায়, তখন এটি একটি অস্বাভাবিক পতনের সংকেত দেয়। কৌশলটি পরবর্তী মোমবাতি খোলার সময় দীর্ঘ হবে। স্টপ লসটি এন্ট্রি মূল্য বিয়োগ এটিআর স্টপ লস গুণক গুণিত এটিআর এ সেট করা হয়। লাভ নিন মাঝারি ব্যান্ডে (ইএমএ) বা উপরের এটিআর ব্যান্ডে। যদি বর্তমান বারগুলি বন্ধ হয় পূর্ববর্তী বারগুলির চেয়ে কম হয়, তবে পূর্ববর্তী বারগুলি লাভ হিসাবে নিন।
বিশেষ করে, মূল যুক্তিতে নিম্নলিখিতগুলি অন্তর্ভুক্ত রয়েছেঃ
- ATR এবং মধ্যবর্তী ব্যান্ড (EMA) গণনা করুন
- সময় ফিল্টার সংজ্ঞায়িত করুন
- যখন দাম < নিম্ন এটিআর ব্যান্ড হয় তখন দীর্ঘ সংকেত চিহ্নিত করুন
- পরবর্তী বার খোলা এ দীর্ঘ প্রবেশ করুন
- রেকর্ড প্রবেশ মূল্য
- স্টপ লস মূল্য গণনা করুন
- মুনাফা গ্রহণ করুন যখন মূল্য > মধ্যবর্তী ব্যাণ্ড (EMA) বা উপরের ATR ব্যাণ্ড
- স্টপ আউট যখন মূল্য < স্টপ লস মূল্য
সুবিধা বিশ্লেষণ
এই কৌশলটির সুবিধাঃ
- নির্ভরযোগ্য প্রবেশ এবং প্রস্থান সংকেতের জন্য এটিআর চ্যানেল ব্যবহার করে
- শুধুমাত্র দীর্ঘ পরে অস্বাভাবিকতা ড্রপ উচ্চতা তাড়া এড়াতে
- স্টপ লস ঝুঁকি কঠোর নিয়ন্ত্রণ
- দ্রুত স্বল্পমেয়াদী ব্যবসার জন্য উপযুক্ত
- সহজ যুক্তি বাস্তবায়ন এবং অপ্টিমাইজ করা সহজ
ঝুঁকি বিশ্লেষণ
কিছু ঝুঁকি আছেঃ
- উচ্চ ট্রেডিং ফ্রিকোয়েন্সি উচ্চ লেনদেনের খরচ এবং স্লিপিংয়ের দিকে পরিচালিত করে
- ধারাবাহিক স্টপ লস ট্রিগার হতে পারে
- অনুপযুক্ত প্যারামিটার অপ্টিমাইজেশান কর্মক্ষমতা প্রভাবিত করে
- দামের বড় পরিবর্তনগুলি অত্যধিক স্টপ লস হতে পারে
এই ঝুঁকিগুলি ATR সময়কাল, স্টপ লস মাল্টিপ্লায়ার ইত্যাদি সামঞ্জস্য করে হ্রাস করা যেতে পারে। কম ট্রেডিং ফি সহ ব্রোকার নির্বাচন করাও গুরুত্বপূর্ণ।
অপ্টিমাইজেশান নির্দেশাবলী
কৌশলটি নিম্নলিখিতগুলির মাধ্যমে উন্নত করা যেতে পারেঃ
- সেরা এন্ট্রি সংকেতগুলি মিস করা এড়াতে অন্যান্য ফিল্টার সূচক যুক্ত করা
- এটিআর সময়ের অপ্টিমাইজেশন
- পুনরায় প্রবেশের প্রক্রিয়া বিবেচনা করা
- এডাপ্টিভ স্টপ লস সাইজ
- বিপরীত প্রবণতা ট্রেড এড়াতে প্রবণতা ফিল্টার যোগ করা
সিদ্ধান্ত
সংক্ষেপে, এটি এটিআর চ্যানেলে ভিত্তি করে একটি সহজ এবং ব্যবহারিক গড় বিপরীত কৌশল। এটিতে স্পষ্ট এন্ট্রি নিয়ম, কঠোর স্টপ লস এবং যুক্তিসঙ্গত লাভ গ্রহণ রয়েছে। প্যারামিটার টিউনিংয়ের জন্যও জায়গা রয়েছে। যদি ব্যবসায়ীরা সঠিক প্রতীকটি চয়ন করতে এবং স্টপ লসের সাথে ঝুঁকি নিয়ন্ত্রণ করতে পারে তবে এই কৌশলটি ভাল ফলাফল অর্জন করতে পারে।
/*backtest
start: 2022-12-04 00:00:00
end: 2023-12-10 00:00:00
period: 1d
basePeriod: 1h
exchanges: [{"eid":"Futures_Binance","currency":"BTC_USDT"}]
*/

// This source code is subject to the terms of the Mozilla Public License 2.0 at https://mozilla.org/MPL/2.0/
// © Bcullen175

//@version=5
strategy("ATR Mean Reversion", overlay=true, initial_capital=100000,default_qty_type=strategy.percent_of_equity, default_qty_value=100, commission_type=strategy.commission.percent, commission_value=6E-5) // Brokers rate (ICmarkets = 6E-5)
SLx = input(1.5, "SL Multiplier", tooltip = "Multiplies ATR to widen stop on volatile assests, Higher values reduce risk:reward but increase winrate, Values below 1.2 are not reccomended")
src = input(close, title="Source")
period = input.int(10, "ATR & MA PERIOD")
plot(open+ta.atr(period))
plot(open-ta.atr(period))
plot((ta.ema(src, period)), title = "Mean", color=color.white)

i_startTime     = input(title="Start Filter", defval=timestamp("01 Jan 1995 13:30 +0000"), group="Time Filter", tooltip="Start date & time to begin searching for setups")
i_endTime       = input(title="End Filter", defval=timestamp("1 Jan 2099 19:30 +0000"), group="Time Filter", tooltip="End date & time to stop searching for setups")

// Check filter(s)
f_dateFilter = true

atr = ta.atr(period)

// Check buy/sell conditions
var float buyPrice = 0
buyCondition    = low < (open-ta.atr(period)) and strategy.position_size == 0 and f_dateFilter
sellCondition   = (high > (ta.ema(close, period)) and strategy.position_size > 0 and close < low[1]) or high > (open+ta.atr(period))
stopDistance    = strategy.position_size > 0 ? ((buyPrice - atr)/buyPrice) : na
stopPrice       = strategy.position_size > 0 ? (buyPrice - SLx*atr): na
stopCondition   = strategy.position_size > 0 and low < stopPrice

// Enter positions
if buyCondition
    strategy.entry(id="Long", direction=strategy.long)

if buyCondition[1]
    buyPrice := open

// Exit positions
if sellCondition or stopCondition
    strategy.close(id="Long", comment="Exit" + (stopCondition ? "SL=true" : ""))
    buyPrice := na

// Draw pretty colors
plot(buyPrice, color=color.lime, style=plot.style_linebr)
plot(stopPrice, color=color.red, style=plot.style_linebr, offset=-1)
- এএইচএ মম্পটাম ব্রেকআউটের উপর ভিত্তি করে কৌশল অনুসরণ করে গড় বিপরীতমুখী প্রবণতা
- গতি ট্র্যাকিং অভিযোজিত পরিসংখ্যানগত মধ্যস্থতা কৌশল
- ডেরিভেটিভ ভিত্তিক ট্রেন্ড কৌশল
- ADX, BB %B, AO এবং EMA এর উপর ভিত্তি করে চারটি ফ্যাক্টর মম্পটম ট্র্যাকিং ট্রেডিং কৌশল
- RSI-MA ট্রেন্ড অনুসরণকারী কৌশল
- এডিএক্স、আরএসআই গতির সূচক কৌশল
- এটিআর স্টপ লস সহ ইএমএ কৌশল
- অভ্যন্তরীণ মূল্য চ্যানেলের উপর ভিত্তি করে লুক-আপ এবং লুক-ডাউন কৌশল
- ইএমএ এবং সুপারট্রেন্ড যৌথ প্রবণতা অনুসরণকারী কৌশল
- কৌশল অনুসরণ করে গতিশীল প্রবণতা
- ডাবল মুভিং এভারেজ ক্রসওভার কৌশল
- ইনসাইড বার রেঞ্জ ব্রেকআউট কৌশল
- ডাবল মুভিং এভারেজ বোলিংজার ব্যান্ড ট্রেন্ড ট্র্যাকিং কৌশল
- ট্রেডিং কৌশল অনুসারে চলমান গড় প্রবণতা
- ইচিমোকু ট্রেন্ড অনুসরণকারী কৌশল
- ম্যাকডি ট্রেন্ড অনুসরণকারী কৌশল
- ওক্টা-ইএমএ এবং ইচিমোকু ক্লাউড কোন্টিটেটিভ ট্রেডিং কৌশল
- মসৃণ চলমান গড় রিবন কৌশল
- ৫২ সপ্তাহের উচ্চ নিম্ন বক্স ট্রেডিং কৌশল
- মুভিং মিডিয়ার মধ্যে ওসিলেশন ট্রেডিং কৌশল