RSI সূচক ভিত্তিক স্টক ট্রেডিং পিরামিডিং কৌশল
লেখক:চাওঝাং, তারিখঃ 2024-01-30 15:26:49ট্যাগঃ

সারসংক্ষেপ
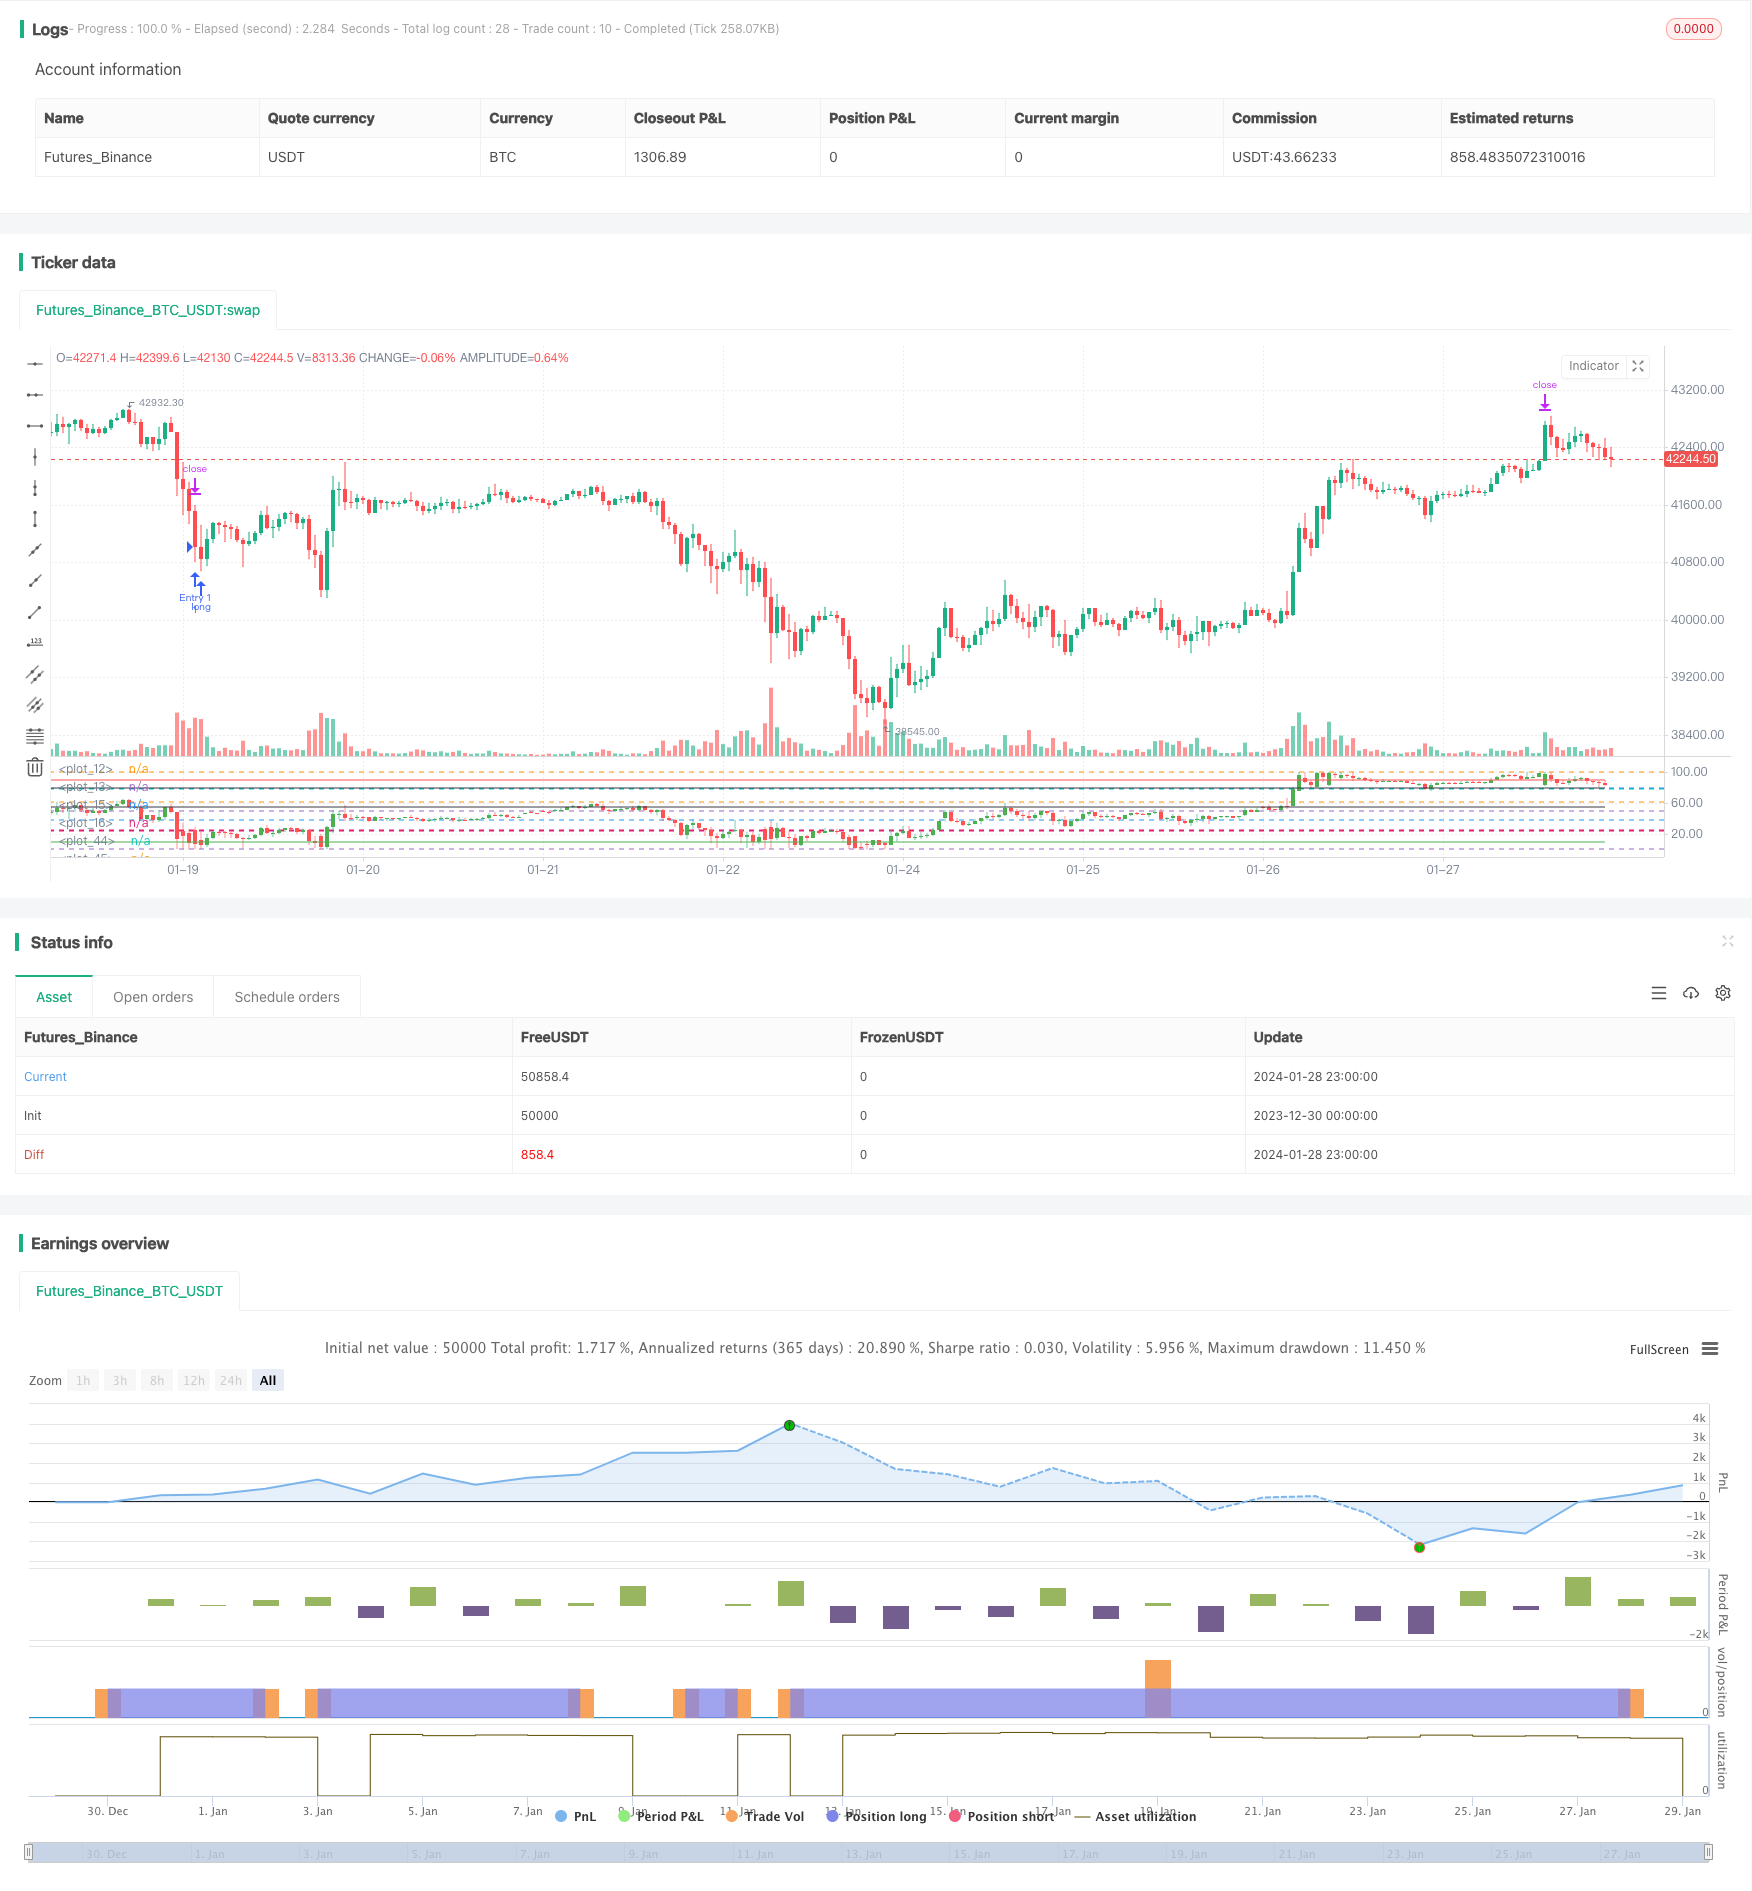
এই নিবন্ধটি মূলত রিলেটিভ স্ট্রেনথ ইন্ডেক্স (আরএসআই) সূচকের উপর ভিত্তি করে ডিজাইন করা একটি স্টক ট্রেডিং পিরামিডিং কৌশল প্রবর্তন করে। কৌশলটি স্টকগুলির অতিরিক্ত ক্রয় এবং অতিরিক্ত বিক্রয় অঞ্চলগুলি নির্ধারণের জন্য আরএসআই সূচক ব্যবহার করে এবং পিরামিডিং নীতিগুলির মাধ্যমে মুনাফা অর্জনের বাস্তবায়ন করে।
কৌশল নীতি
- স্টকটি ওভারকোপড বা ওভারসোল্ড অঞ্চলে প্রবেশ করেছে কিনা তা বিচার করার জন্য RSI সূচকটি ব্যবহার করুন। 25 এর নিচে RSI ওভারসোল্ড এবং 80 এর উপরে ওভারসোল্ড।
- আরএসআই যখন ওভারসোল্ড অঞ্চলে প্রবেশ করে, তখন লম্বা যেতে শুরু করুন। যখন আরএসআই ওভারকুপেড অঞ্চলে প্রবেশ করে, তখন শর্ট যেতে শুরু করুন।
- পিরামিড পদ্ধতি গ্রহণ করুন, 7 টি অতিরিক্ত ক্রয়ের সাথে। প্রতিটি অতিরিক্ত ক্রয়ের পরে লাভ এবং স্টপ লস পয়েন্ট সেট করুন।
সুবিধা বিশ্লেষণ
- অতিরিক্ত ক্রয় এবং অতিরিক্ত বিক্রয় অঞ্চলগুলি নির্ধারণের জন্য আরএসআই সূচকটি ব্যবহার করে দামের বিপরীতমুখী সুযোগগুলি আরও বড় করে তুলতে পারে।
- যখন বাজার সঠিকভাবে চলে তখন পিরামিড পদ্ধতি তুলনামূলকভাবে ভাল রিটার্ন পেতে পারে।
- প্রতিটি অতিরিক্ত ক্রয়ের পরে লাভ এবং স্টপ লস সেট করা ঝুঁকি নিয়ন্ত্রণ করতে পারে।
ঝুঁকি বিশ্লেষণ
- অতিরিক্ত ক্রয় এবং অতিরিক্ত বিক্রয় অঞ্চল নির্ধারণে আরএসআই সূচকের প্রভাব অস্থির এবং ভুল সংকেত দেখা দিতে পারে।
- অতিরিক্ত ক্রয়ের সংখ্যা যুক্তিসঙ্গতভাবে নির্ধারণ করা দরকার, অতিরিক্ত ক্রয় ঝুঁকি বাড়িয়ে তুলবে।
- স্টপ লস পয়েন্ট নির্ধারণের সময় ভোল্টেবিলিটি বিবেচনা করতে হবে, এটি খুব কম সেট করা যাবে না।
অপ্টিমাইজেশান নির্দেশাবলী
- আরএসআই সংকেতগুলি ফিল্টার করতে এবং অতিরিক্ত ক্রয় এবং অতিরিক্ত বিক্রয় স্থিতি নির্ধারণের নির্ভুলতা উন্নত করতে অন্যান্য সূচকগুলির সংমিশ্রণ বিবেচনা করুন। যেমন কেডিজে, বিওএলএল এবং অন্যান্য সূচক।
- দাম ট্র্যাক করতে ফ্লোটিং স্টপ লস সেট করতে পারেন। অস্থিরতা এবং ঝুঁকি নিয়ন্ত্রণের প্রয়োজনীয়তা অনুযায়ী গতিশীলভাবে সামঞ্জস্য করুন।
- বাজারের অবস্থার উপর ভিত্তি করে অভিযোজিত পরামিতি ব্যবহার করার কথা বিবেচনা করুন (গরু বাজার, ভালুক বাজার ইত্যাদি) ।
সংক্ষিপ্তসার
এই কৌশলটি পিরামিডিং কৌশলটির সাথে আরএসআই সূচককে একত্রিত করে। অতিরিক্ত ক্রয় এবং অতিরিক্ত বিক্রয় স্থিতিগুলি বিচার করার সময়, এটি অতিরিক্ত ক্রয়ের মাধ্যমে আরও বেশি রিটার্ন অর্জন করতে পারে। যদিও আরএসআই বিচারের নির্ভুলতা উন্নত করা দরকার, যুক্তিসঙ্গত পরামিতি অপ্টিমাইজেশান এবং অন্যান্য সূচকগুলির সাথে সংমিশ্রণের মাধ্যমে এটি একটি কার্যকর ট্রেডিং কৌশল গঠন করতে পারে। এই কৌশলটির কিছু সার্বজনীনতা রয়েছে এবং এটি একটি তুলনামূলকভাবে সহজ এবং সরল পরিমাণগত ট্রেডিং পদ্ধতি।
/*backtest
start: 2023-12-30 00:00:00
end: 2024-01-29 00:00:00
period: 1h
basePeriod: 15m
exchanges: [{"eid":"Futures_Binance","currency":"BTC_USDT"}]
*/

//@version=4
// This source code is subject to the terms of the Mozilla Public License 2.0 at https://mozilla.org/MPL/2.0/
// © RafaelZioni

strategy(title='Simple RSI strategy', overlay=false)

SWperiod = 1
look = 0
OverBought = input(80, minval=50)
OverSold = input(25, maxval=50)

bandmx = hline(100)
bandmn = hline(0)

band1 = hline(OverBought)
band0 = hline(OverSold)
//band50 = hline(50, color=black, linewidth=1)
fill(band1, band0, color=color.purple, transp=98)


src = close
len = input(5, minval=1, title="RSI Length")
up = rma(max(change(src), 0), len)
down = rma(-min(change(src), 0), len)
rsi = down == 0 ? 100 : up == 0 ? 0 : 100 - 100 / (1 + up / down)

p = 100

//scale
hh = highest(high, p)
ll = lowest(low, p)
scale = hh - ll

//dynamic OHLC
dyno = (open - ll) / scale * 100
dynl = (low - ll) / scale * 100
dynh = (high - ll) / scale * 100
dync = (close - ll) / scale * 100

//candle color
color_1 = close > open ? 1 : 0

//drawcandle
hline(78.6)
hline(61.8)
hline(50)
hline(38.2)
hline(23.6)
plotcandle(dyno, dynh, dynl, dync, title="Candle", color=color_1 == 1 ? color.green : color.red)
plot(10, color=color.green)
plot(55, color=color.black)
plot(80, color=color.black)
plot(90, color=color.red)

long = rsi <= OverSold ? 5 : na

//Strategy
golong = rsi <= OverSold ? 5 : na

longsignal = golong
//based on https://www.tradingview.com/script/7NNJ0sXB-Pyramiding-Entries-On-Early-Trends-by-Coinrule/
//set take profit

ProfitTarget_Percent = input(3)
Profit_Ticks = close * (ProfitTarget_Percent / 100) / syminfo.mintick

//set take profit

LossTarget_Percent = input(10)
Loss_Ticks = close * (LossTarget_Percent / 100) / syminfo.mintick


//Order Placing

strategy.entry("Entry 1", strategy.long, when=strategy.opentrades == 0 and longsignal)

strategy.entry("Entry 2", strategy.long, when=strategy.opentrades == 1 and longsignal)

strategy.entry("Entry 3", strategy.long, when=strategy.opentrades == 2 and longsignal)

strategy.entry("Entry 4", strategy.long, when=strategy.opentrades == 3 and longsignal)

strategy.entry("Entry 5", strategy.long, when=strategy.opentrades == 4 and longsignal)

strategy.entry("Entry 6", strategy.long, when=strategy.opentrades == 5 and longsignal)

strategy.entry("Entry 7", strategy.long, when=strategy.opentrades == 6 and longsignal)


if strategy.position_size > 0
    strategy.exit(id="Exit 1", from_entry="Entry 1", profit=Profit_Ticks, loss=Loss_Ticks)
    strategy.exit(id="Exit 2", from_entry="Entry 2", profit=Profit_Ticks, loss=Loss_Ticks)
    strategy.exit(id="Exit 3", from_entry="Entry 3", profit=Profit_Ticks, loss=Loss_Ticks)
    strategy.exit(id="Exit 4", from_entry="Entry 4", profit=Profit_Ticks, loss=Loss_Ticks)
    strategy.exit(id="Exit 5", from_entry="Entry 5", profit=Profit_Ticks, loss=Loss_Ticks)
    strategy.exit(id="Exit 6", from_entry="Entry 6", profit=Profit_Ticks, loss=Loss_Ticks)
    strategy.exit(id="Exit 7", from_entry="Entry 7", profit=Profit_Ticks, loss=Loss_Ticks)
- বুল মার্কেটের কৌশলতে স্কাল্পিং ডিপস
- অ্যাডাপ্টিভ মুভিং মিডিয়ার উপর ভিত্তি করে কৌশল অনুসরণ করে প্রবণতা
- প্রকৃত আপেক্ষিক গতিশীল গড় কৌশল
- এমএসিডি এবং আরএসআই ভিত্তিক ৫ মিনিটের গতির ট্রেডিং কৌশল
- ডাবল ফ্র্যাক্টাল ব্রেকআউট কৌশল
- নোরো স্টপ লস কৌশল পরিবর্তন করেছে
- ডাবল এক্সপোনেনশিয়াল মুভিং এভারেজ RSI ট্রেডিং কৌশল
- সরল চলমান গড় ক্রসওভার কৌশল
- বাজার তরলতা এবং প্রবণতা উপর ভিত্তি করে স্কেলপিং কৌশল
- সীমান্তবর্তী স্বল্পমেয়াদী অগ্রগতি বিপরীত 5EMA কৌশল
- ইএমএ চ্যানেল ট্রেডিং কৌশল সম্পর্কে সবকিছু
- ডাবল ডেকার আরএসআই ট্রেডিং কৌশল
- বোলিংজার ব্যান্ড এবং আরএসআই সংমিশ্রণ কৌশল
- ডাবল ইনসাইড বার এবং ট্রেন্ড কৌশল
- আশ্চর্যজনক দামের কৌশল
- শক্তিশালী প্রবণতা অব্যাহত রাখার কৌশল
- প্রবণতা ট্র্যাকিং চলমান গড় ক্রসওভার কৌশল
- ব্রেকআউট বিপরীতমুখী মডেল টার্টেল ট্রেডিং কৌশল ভিত্তিক
- গতিশীল প্রবণতা কৌশল
- পিনট 123 বিপরীতমুখী এবং ব্রেকআউট রেঞ্জ স্বল্পমেয়াদী ট্রেডিং কৌশল