সুপারট্রেন্ড এবং বোলিংজার ব্যান্ডের সমন্বয় কৌশল
লেখক:চাওঝাং, তারিখ: ২০২৪-০৩-২৯ 15:18:22ট্যাগঃ

সারসংক্ষেপ
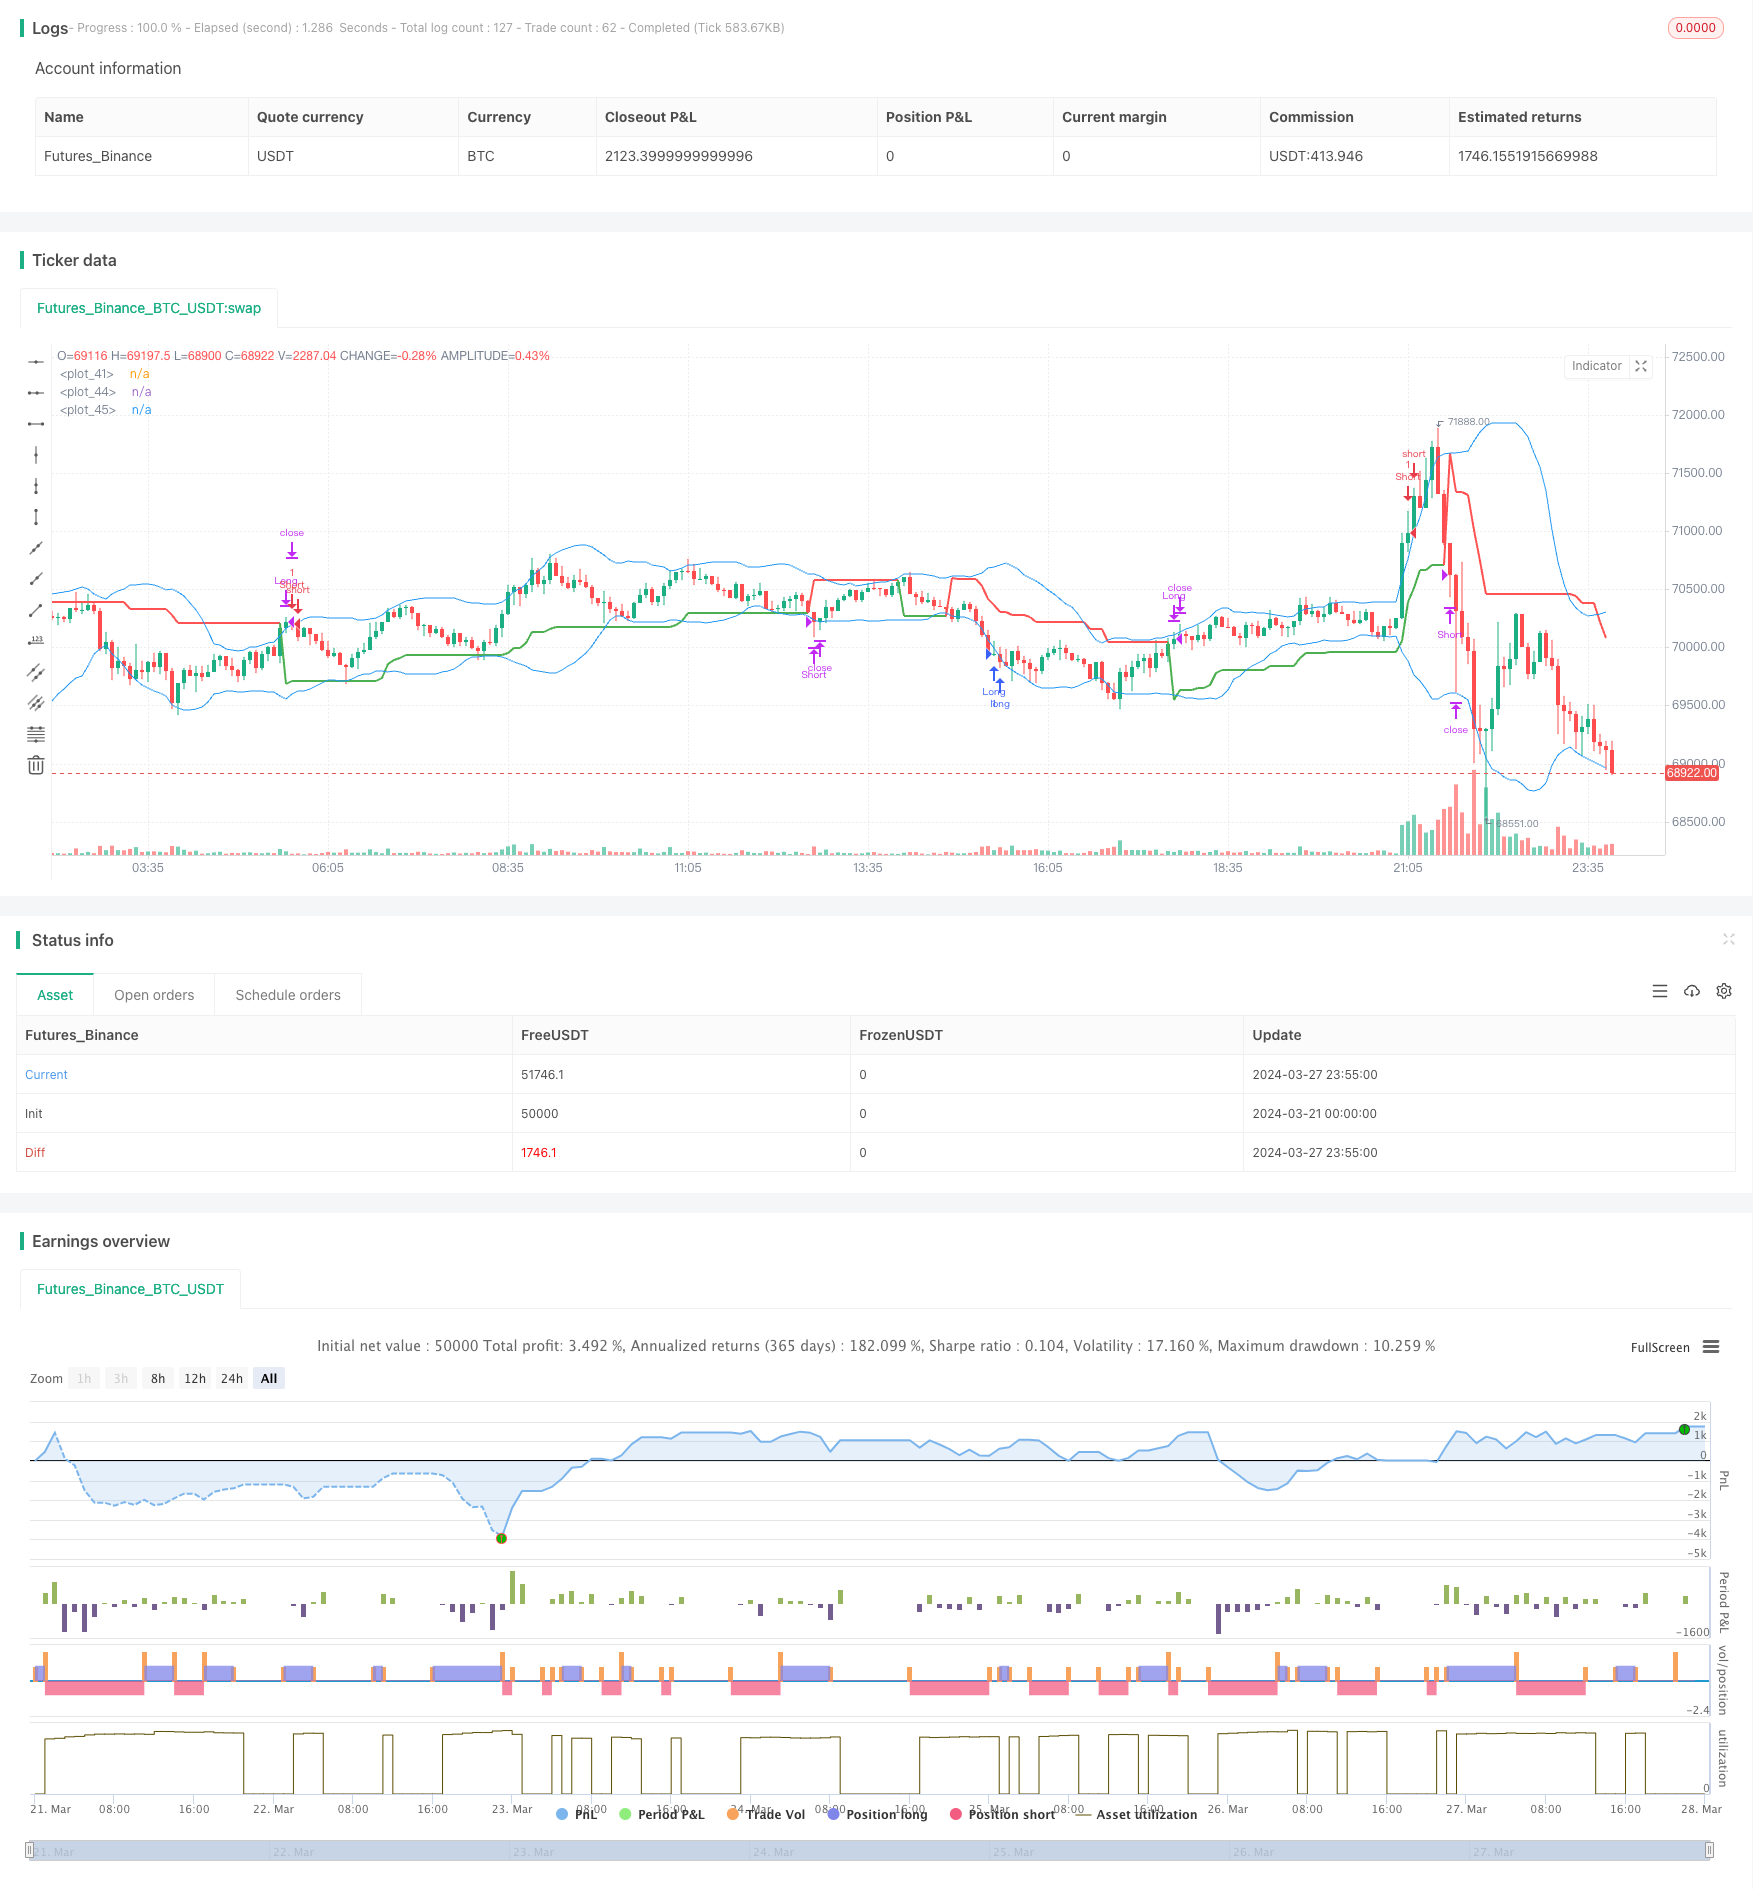
এই কৌশলটি সুপারট্রেন্ড সূচক এবং বোলিংজার ব্যান্ড সূচককে একত্রিত করে বাজারে ট্রেন্ডিং সুযোগগুলি ক্যাপচার করতে। সুপারট্রেন্ড সূচকটি বর্তমান বাজারের প্রবণতা দিক নির্ধারণ করতে ব্যবহৃত হয়, যখন বোলিংজার ব্যান্ড সূচকটি বাজারের অস্থিরতা পরিমাপ করতে ব্যবহৃত হয়। যখন বন্ধের দাম সুপারট্রেন্ড লাইনের উপরে ভেঙে যায় এবং নিম্ন বোলিংজার ব্যান্ডের নীচে থাকে তখন একটি দীর্ঘ সংকেত উত্পন্ন হয় এবং যখন বন্ধের দাম সুপারট্রেন্ড লাইনের নীচে ভেঙে যায় এবং উপরের বোলিংজার ব্যান্ডের উপরে থাকে তখন একটি সংক্ষিপ্ত সংকেত উত্পন্ন হয়। এই কৌশলটির সুবিধা হ'ল এটি প্রবণতা স্পষ্ট হলে সময়মতো বাজারে প্রবেশ করতে পারে, যখন একটি অস্থির বাজারে অকাল প্রবেশ এড়ানো হয়।
কৌশলগত নীতি
- বর্তমান বাজার প্রবণতা দিক নির্ধারণের জন্য গড় সত্যিকারের পরিসীমা (এটিআর) এবং সুপারট্রেন্ড সূচক গণনা করুন।
- বাজারের অস্থিরতা পরিমাপ করার জন্য উপরের এবং নীচের বোলিংজার ব্যান্ড গণনা করুন।
- যখন বন্ধের মূল্য সুপারট্রেন্ড লাইনের উপরে ভেঙে যায় এবং নিম্ন বোলিঞ্জার ব্যান্ডের নীচে থাকে তখন একটি দীর্ঘ সংকেত তৈরি করুন; যখন বন্ধের মূল্য সুপারট্রেন্ড লাইনের নীচে ভেঙে যায় এবং উপরের বোলিঞ্জার ব্যান্ডের উপরে থাকে তখন একটি সংক্ষিপ্ত সংকেত তৈরি করুন।
- লং পজিশন ধরে রাখার সময়, যদি বন্ধের মূল্য সুপারট্রেন্ড লাইনের নিচে যায়, তাহলে পজিশন বন্ধ করুন; শর্ট পজিশন ধরে রাখার সময়, যদি বন্ধের মূল্য সুপারট্রেন্ড লাইনের উপরে যায়, তাহলে পজিশন বন্ধ করুন।
কৌশলগত সুবিধা
- প্রবণতা এবং অস্থিরতা উভয় মাত্রার তথ্য একত্রিত করা বাজারের সুযোগগুলি আরও ব্যাপকভাবে উপলব্ধি করতে পারে।
- প্রবণতা স্পষ্ট হলে সময়মতো বাজারে প্রবেশ করতে সক্ষম, যা প্রবণতা বাজারের লাভগুলি ধরতে সহায়তা করে।
- একটি অস্থির বাজারে, বোলিংজার ব্যান্ড এবং সুপারট্রেন্ডের সংমিশ্রণ কার্যকরভাবে মিথ্যা ব্রেকআউট সংকেত ফিল্টার করতে পারে এবং ক্ষতির ঝুঁকি হ্রাস করতে পারে।
- কোড লজিকটি স্বচ্ছ, কয়েকটি পরামিতি সহ, এবং এটি বোঝা এবং বাস্তবায়ন করা সহজ।
কৌশলগত ঝুঁকি
- একতরফা ট্রেন্ডিং বাজারে, ঘন ঘন ব্রেকআউট সংকেতগুলির কারণে, এটি অত্যধিক ট্রেডিং ফ্রিকোয়েন্সি এবং লেনদেনের ব্যয় বাড়িয়ে তুলতে পারে।
- ব্রেকআউট পয়েন্টগুলি ক্যাপচার করা সুপারট্রেন্ড সূচকের উপর নির্ভর করে, যা পরামিতিগুলির প্রতি সংবেদনশীল, এবং বিভিন্ন পরামিতির অধীনে সূচকের প্রবণতা ব্যাপকভাবে পরিবর্তিত হয়, যা কৌশলটির কার্যকারিতা প্রভাবিত করতে পারে।
- বাজারের অস্থিরতা পরিবর্তনের সাথে বোলিংজার ব্যান্ডের প্রস্থ পরিবর্তন হবে এবং উচ্চ অস্থিরতার পরিবেশে স্টপ-লসগুলি প্রসারিত হতে পারে।
কৌশল অপ্টিমাইজেশান নির্দেশাবলী
- সিগন্যালের নির্ভরযোগ্যতা আরও উন্নত করার জন্য আরও কার্যকর ফিল্টারিং শর্ত যেমন ট্রেডিং ভলিউম, বাজার আবেগ ইত্যাদি প্রবর্তন বিবেচনা করুন।
- সুপারট্রেন্ড সূচকের পরামিতিগুলির জন্য, কৌশল স্থিতিশীলতা উন্নত করার জন্য সর্বোত্তম পরামিতিগুলি নির্বাচন করার জন্য অপ্টিমাইজেশন পরীক্ষা পরিচালনা করা যেতে পারে।
- ট্রেড এক্সিকিউশনের ক্ষেত্রে, একটি একক ট্রেডের ঝুঁকি ঝুঁকি হ্রাস করার জন্য আরও বিস্তারিত পজিশন ম্যানেজমেন্ট এবং ঝুঁকি নিয়ন্ত্রণ ব্যবস্থা চালু করা যেতে পারে, যেমন ট্রেলিং স্টপ সেট করা, গতিশীলভাবে পজিশনগুলি সামঞ্জস্য করা ইত্যাদি।
সংক্ষিপ্তসার
সুপারট্রেন্ড বোলিংজার ব্যান্ড সংমিশ্রণ কৌশল একটি প্রবণতা অনুসরণকারী কৌশল যা দুটি বাজারের কারণঃ প্রবণতা এবং অস্থিরতা একত্রিত করে প্রবণতার সুযোগগুলি কার্যকরভাবে ক্যাপচার করতে পারে। তবে, এই কৌশলটির কিছু সীমাবদ্ধতা রয়েছে, যেমন পরামিতিগুলির প্রতি সংবেদনশীল হওয়া এবং উচ্চ অস্থিরতার পরিবেশে ঝুঁকি বৃদ্ধি করা। অতএব, প্রকৃত প্রয়োগে, বাজারের বৈশিষ্ট্য এবং নিজের ঝুঁকি পছন্দ অনুসারে কৌশলটি যথাযথভাবে অনুকূলিতকরণ এবং উন্নত করা প্রয়োজন।
/*backtest
start: 2024-03-21 00:00:00
end: 2024-03-28 00:00:00
period: 5m
basePeriod: 1m
exchanges: [{"eid":"Futures_Binance","currency":"BTC_USDT"}]
*/

// This Pine Script™ code is subject to the terms of the Mozilla Public License 2.0 at https://mozilla.org/MPL/2.0/
// © sabhiv27

//@version=4
strategy("Supertrend & Bollinger Bands Strategy", shorttitle="ST_BB_Strategy", overlay=true)

// Input options
factor = input(3, title="Supertrend Factor")
length = input(10, title="ATR Length")
bollinger_length = input(20, title="Bollinger Bands Length")
bollinger_deviation = input(2, title="Bollinger Bands Deviation")

// Calculate True Range for Supertrend
truerange = rma(tr, length)

// Calculate Supertrend
var float up_trend = na
var float dn_trend = na
var float trend = na
up_signal = hl2 - (factor * truerange)
dn_signal = hl2 + (factor * truerange)
up_trend := close[1] > up_trend[1] ? max(up_signal, up_trend[1]) : up_signal
dn_trend := close[1] < dn_trend[1] ? min(dn_signal, dn_trend[1]) : dn_signal
trend := close > dn_trend ? 1 : close < up_trend ? -1 : nz(trend[1], 1)

// Calculate Bollinger Bands
basis = sma(close, bollinger_length)
dev = stdev(close, bollinger_length)
upper_band = basis + bollinger_deviation * dev
lower_band = basis - bollinger_deviation * dev

// Entry conditions
long_condition = crossover(close, up_trend) and close < lower_band
short_condition = crossunder(close, dn_trend) and close > upper_band

// Exit conditions
exit_long_condition = crossover(close, dn_trend)
exit_short_condition = crossunder(close, up_trend)

// Plot Supertrend
plot(trend == 1 ? up_trend : dn_trend, color=trend == 1 ? color.green : color.red, linewidth=2)

// Plot Bollinger Bands
plot(upper_band, color=color.blue)
plot(lower_band, color=color.blue)

// Generate buy and sell signals
strategy.entry("Long", strategy.long, when=long_condition)
strategy.entry("Short", strategy.short, when=short_condition)
strategy.close("Long", when=exit_long_condition)
strategy.close("Short", when=exit_short_condition)
- ইএমএ ডাবল মুভিং এভারেজ ক্রসওভার ট্রেন্ড অনুসরণ করছে
- চলমান গড় ক্রসওভার কৌশল
- ম্যানুয়াল টিপি এবং এসএল সহ আরএসআই গতি কৌশল
- ইএমএ আরএসআই ট্রেন্ড-ফলোিং এবং ইম্পোমেন্টাম স্ট্র্যাটেজি
- কৌশল অনুসরণ করে গাউসিয়ান চ্যানেল ট্রেন্ড
- Bollinger Bands এবং DCA এর সমন্বয়কারী উচ্চ-ফ্রিকোয়েন্সি ট্রেডিং কৌশল
- কৌশল অনুসরণ করে সংশোধিত আপেক্ষিক শক্তি সূচক প্রবণতা
- ইনট্রা ডে বুলিশ ব্রেকআউট কৌশল
- EMA-MACD-SuperTrend-ADX-ATR মাল্টি-ইন্ডিক্টর ট্রেডিং সিগন্যাল কৌশল
- প্রবণতা অনুসরণকারী পরিবর্তনশীল অবস্থান গ্রিড কৌশল
- ম্যাকডি ট্রেন্ড অনুসরণকারী কৌশল
- ইএমএ ডাবল মুভিং এভারেজ ক্রসওভার কৌশল
- XAUUSD 1-মিনিট স্কেলপিং কৌশল
- ভেক্টর মোমবাতি ভিত্তিক চ্যানেল ব্রেকআউট এবং কাস্টম ChoCH কৌশল
- BreakHigh EMA ক্রসওভার কৌশল
- কৌশল অনুসরণ করে গতিশীল প্রবণতা
- সুপারট্রেন্ড এটিআর কৌশল
- ট্রিপল এক্সপোনেনশিয়াল মুভিং গড় কনভার্জেন্স ডিভার্জেন্স এবং আপেক্ষিক শক্তি সূচক একত্রিত 1-মিনিট চার্ট ক্রিপ্টোকারেন্সি পরিমাণগত ট্রেডিং কৌশল
- আরএসআই এবং ডাবল মুভিং এভারেজ ভিত্তিক ১ ঘণ্টার ট্রেন্ড অনুসরণকারী কৌশল
- এক্সপোনেনশিয়াল মুভিং এভারেজ ক্রসওভার কোন্টিটেটিভ ট্রেডিং স্ট্র্যাটেজি