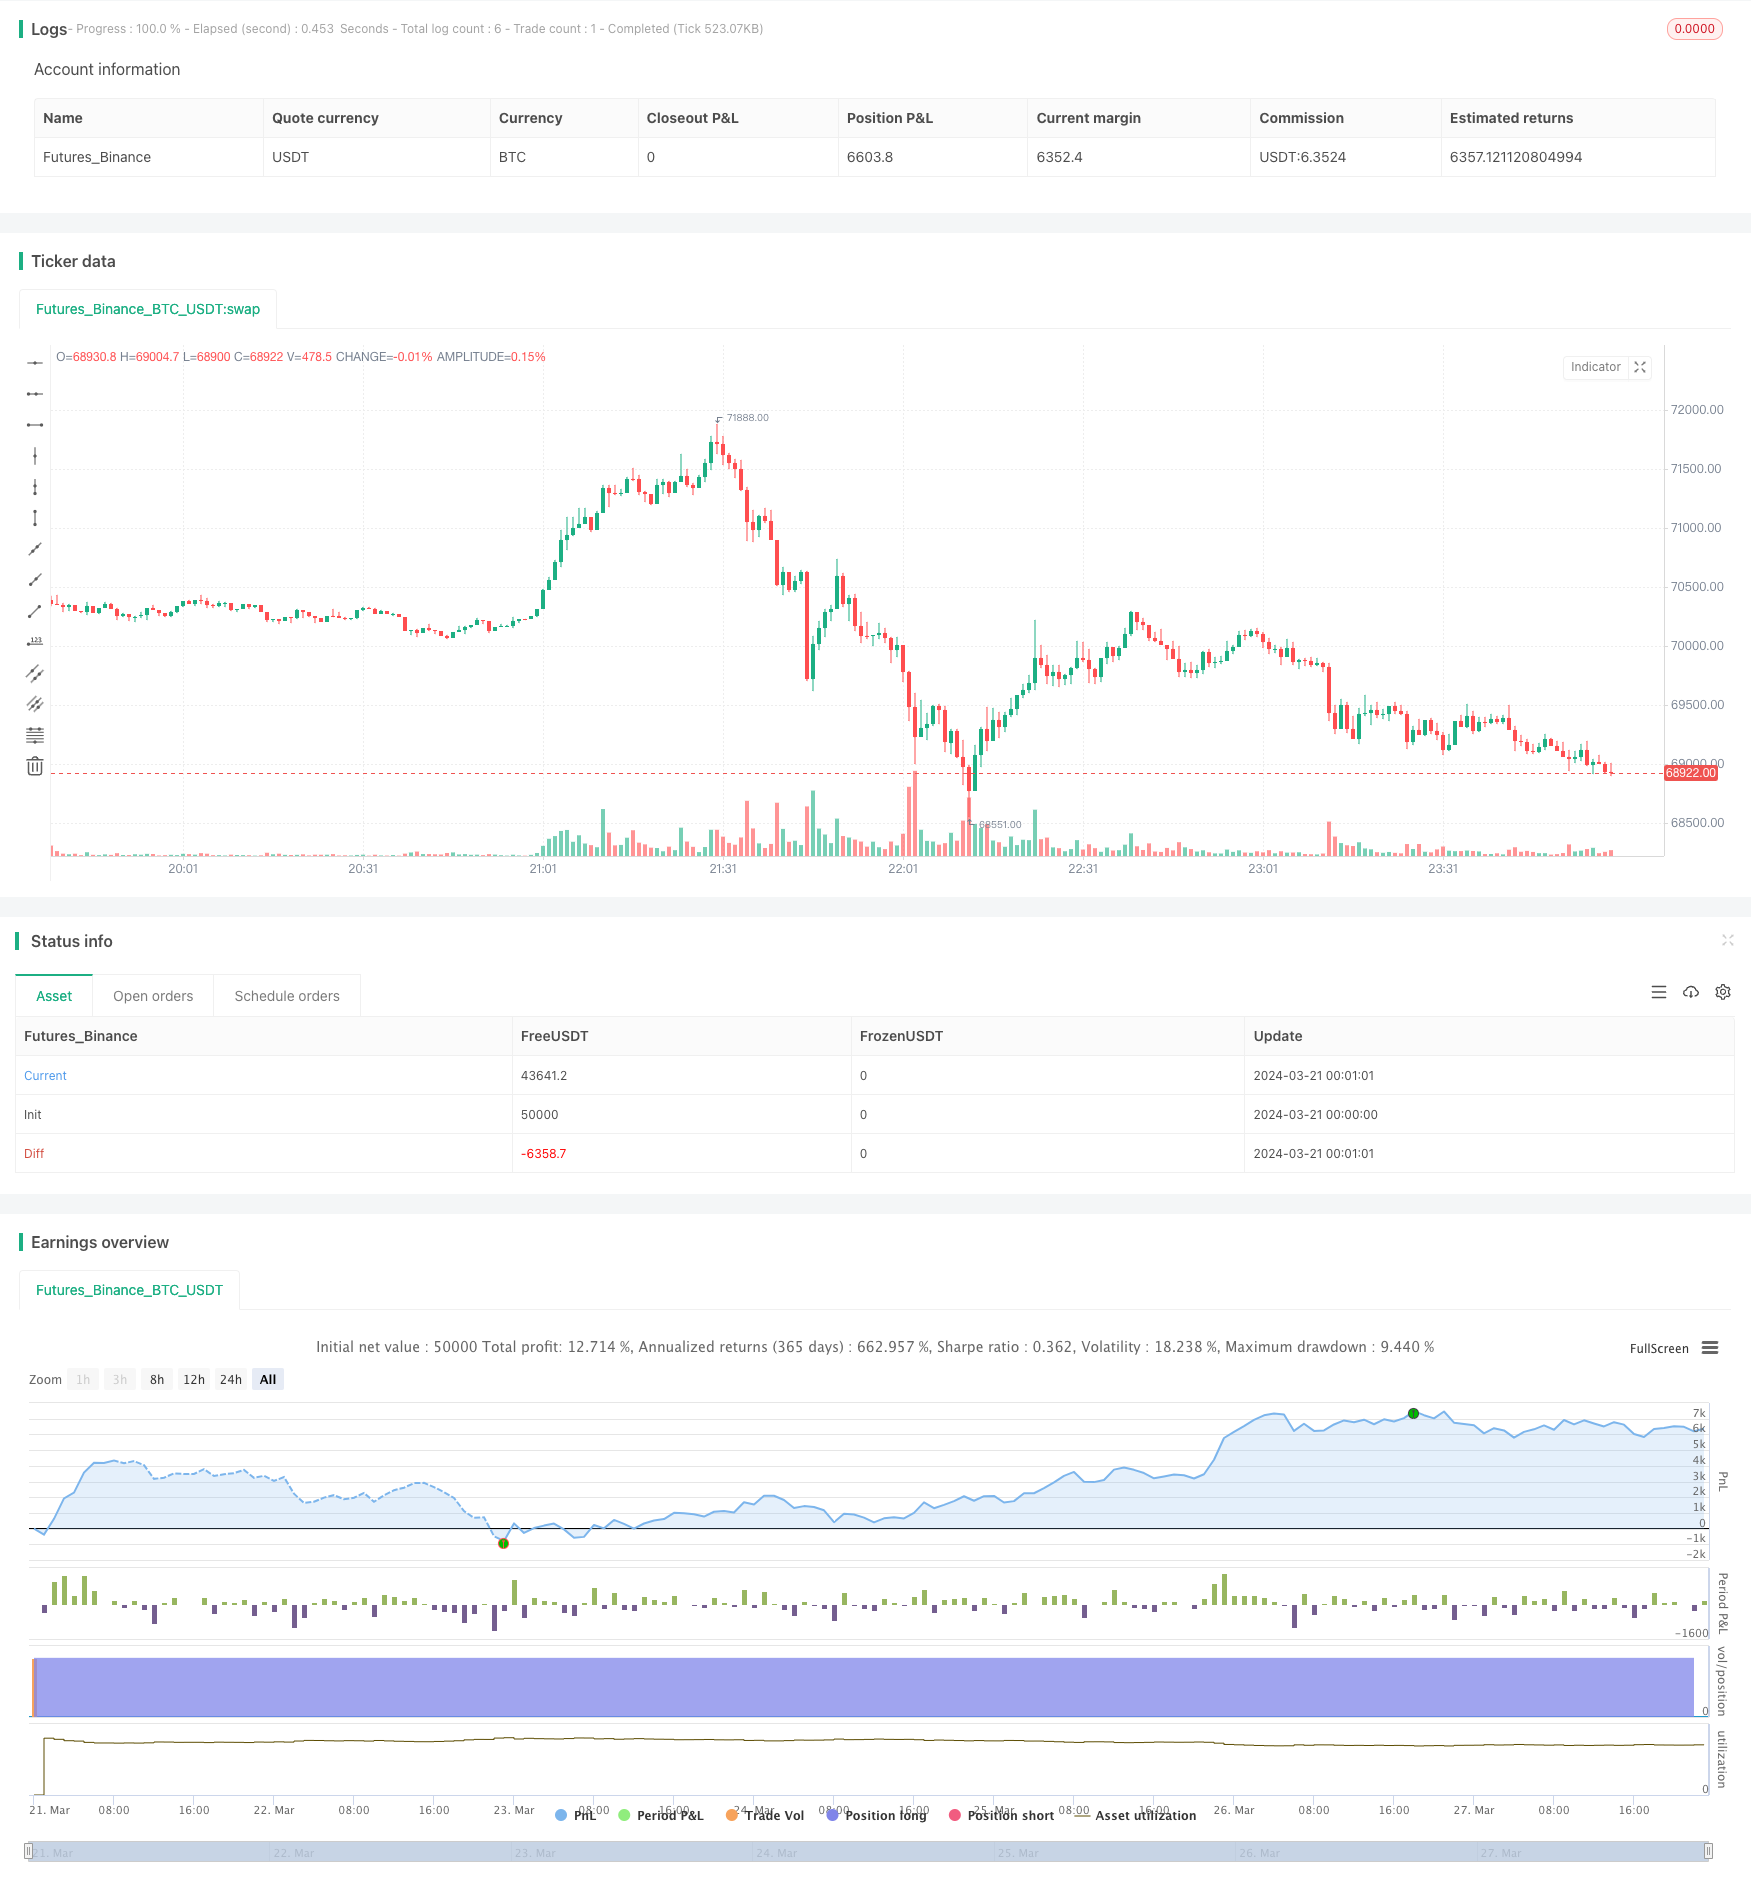
EMA RSI 趋势追踪与动量策略
Author: ChaoZhang, Date: 2024-03-29 16:30:42Tags:

概述
Bybit EMA RSI 趋势追踪与动量策略是一个结合了指数移动平均线(EMA)和相对强弱指数(RSI)的量化交易策略。该策略利用两条不同周期的EMA来判断市场趋势,同时使用RSI指标来确认趋势的有效性。当快速EMA上穿慢速EMA且RSI低于特定下限时,策略产生做多信号;反之,当快速EMA下穿慢速EMA且RSI高于特定上限时,策略产生做空信号。该策略还根据Bybit账户等级设置不同的手续费比例,并内置止盈止损功能,可以有效控制风险。
策略原理
- 计算快速EMA和慢速EMA,周期分别为90和300。
- 计算RSI指标,周期为5。
- 当快速EMA上穿慢速EMA且RSI低于45时,产生做多信号;当快速EMA下穿慢速EMA且RSI高于85时,产生做空信号。
- 根据Bybit账户等级设置不同的手续费比例,从VIP 0的0.075%到VIP 4的0.035%不等。
- 计算包含手续费的开仓价格。
- 根据设定的止盈止损百分比(5%和3%)计算止盈价和止损价。
- 在图表上绘制开仓价、止盈线和止损线。
- 根据交易信号执行开仓操作。
策略优势
- 结合趋势追踪和动量指标,能够较好地捕捉市场趋势。
- 内置止盈止损功能,可以有效控制风险。
- 根据Bybit账户等级设置不同的手续费比例,适应不同用户的交易条件。
- 在图表上绘制开仓价、止盈线和止损线,提供直观的交易信号确认。
策略风险
- EMA和RSI参数的选择可能不适用于所有市场环境,需要根据实际情况进行优化。
- 在震荡市场中,该策略可能产生频繁的交易信号,导致高昂的交易成本。
- 止盈止损的设置可能过于保守或激进,需要根据个人风险偏好进行调整。
策略优化方向
- 对EMA和RSI的参数进行优化,以适应不同的市场环境。可以通过回测和参数扫描来寻找最佳参数组合。
- 引入其他技术指标,如布林带、MACD等,以提高交易信号的准确性。
- 优化止盈止损的设置,例如采用移动止损或动态止损方法,以更好地保护利润和控制风险。
- 考虑市场波动性和交易量等因素,对交易信号进行过滤,减少频繁交易带来的成本。
总结
Bybit EMA RSI 趋势追踪与动量策略是一个结合了趋势追踪和动量指标的量化交易策略,通过EMA和RSI的配合使用,可以较好地捕捉市场趋势。该策略内置止盈止损功能和根据Bybit账户等级设置手续费的功能,可以有效控制风险并适应不同用户的交易条件。然而,该策略仍有优化空间,如参数优化、引入其他技术指标、优化止盈止损设置等。通过不断优化和改进,该策略有望在实际交易中取得更好的效果。
/*backtest
start: 2024-03-21 00:00:00
end: 2024-03-28 00:00:00
period: 1m
basePeriod: 1m
exchanges: [{"eid":"Futures_Binance","currency":"BTC_USDT"}]
*/

// @BryanAaron

//@version=5
strategy("Bybit EMA RSI Strategy", overlay=true)

// Input parameters
fastLength = input(90, title="Fast EMA Length")
slowLength = input(300, title="Slow EMA Length")
rsiLength = input(5, title="RSI Length")
rsiUpperThreshold = input(85, title="RSI Upper Threshold")
rsiLowerThreshold = input(45, title="RSI Lower Threshold")
takeProfitPerc = input(5, title="Take Profit %")
stopLossPerc = input(3, title="Stop Loss %")
bybitAccountLevel = input.string("VIP 0", title="Bybit Account Level", options=["VIP 0", "VIP 1", "VIP 2", "VIP 3", "VIP 4"])

// Calculate moving averages
fastMA = ta.ema(close, fastLength)
slowMA = ta.ema(close, slowLength)

// Calculate RSI
rsi = ta.rsi(close, rsiLength)

// Trading conditions
longCondition = (fastMA > slowMA) and (rsi < rsiLowerThreshold)
shortCondition = (fastMA < slowMA) and (rsi > rsiUpperThreshold)

// Set commission based on Bybit account level
commissionPerc = switch bybitAccountLevel
    "VIP 0" => 0.075
    "VIP 1" => 0.065
    "VIP 2" => 0.055
    "VIP 3" => 0.045
    "VIP 4" => 0.035
    => 0.075

// Calculate entry prices with commission
var float longEntryPrice = na
var float shortEntryPrice = na

longEntryPriceWithCommission = close * (1 + commissionPerc / 100)
shortEntryPriceWithCommission = close * (1 - commissionPerc / 100)

// Calculate take profit and stop loss prices
takeProfitPrice(entryPrice) => entryPrice * (1 + takeProfitPerc / 100)
stopLossPrice(entryPrice) => entryPrice * (1 - stopLossPerc / 100)

// Plot entry prices
plotchar(longCondition, title="Long Entry Price", char="LE", location=location.belowbar, color=color.green)
plotchar(shortCondition, title="Short Entry Price", char="SE", location=location.abovebar, color=color.red)

// Draw position on the chart
longColor = color.green
shortColor = color.red
profitColor = color.new(color.green, 80)
lossColor = color.new(color.red, 80)

plotshape(longCondition and strategy.position_size > 0, title="Long Position", text="Long", location=location.belowbar, style=shape.labelup, size=size.small, color=longColor, textcolor=color.white)
plotshape(shortCondition and strategy.position_size < 0, title="Short Position", text="Short", location=location.abovebar, style=shape.labeldown, size=size.small, color=shortColor, textcolor=color.white)

if (strategy.position_size > 0)
    line.new(bar_index, longEntryPrice, bar_index + 1, longEntryPrice, color=longColor, width=2)

    longProfitLine = line.new(bar_index, takeProfitPrice(longEntryPrice), bar_index + 1, takeProfitPrice(longEntryPrice), color=profitColor, width=1)
    longLossLine = line.new(bar_index, stopLossPrice(longEntryPrice), bar_index + 1, stopLossPrice(longEntryPrice), color=lossColor, width=1)


else if (strategy.position_size < 0)
    line.new(bar_index, shortEntryPrice, bar_index + 1, shortEntryPrice, color=shortColor, width=2)

    shortProfitLine = line.new(bar_index, stopLossPrice(shortEntryPrice), bar_index + 1, stopLossPrice(shortEntryPrice), color=profitColor, width=1)
    shortLossLine = line.new(bar_index, takeProfitPrice(shortEntryPrice), bar_index + 1, takeProfitPrice(shortEntryPrice), color=lossColor, width=1)


// Entry
if (longCondition)
    strategy.entry("Long", strategy.long)
    longEntryPrice := longEntryPriceWithCommission
else if (shortCondition)
    strategy.entry("Short", strategy.short)
    shortEntryPrice := shortEntryPriceWithCommission
更多内容
- 波动率趋势跟踪策略
- 基于双均线和RSI的短线可扩展趋势追踪策略
- 双区间滤波动量交易策略
- VWAP均线交叉动态ATR止损止盈策略
- 基于时间序列数据的自适应动态阈值策略
- 亚洲盘高低点突破策略
- 马库斯的趋势交易者箭头和警报策略
- EMA双均线交叉趋势追踪策略
- 均线金叉死叉策略
- RSI 动量策略
- Gaussian Channel趋势追踪策略
- 布林带与DCA结合的高频交易策略
- 修正相对强弱指数趋势跟踪策略
- 日内多头突破策略
- EMA-MACD-SuperTrend-ADX-ATR多重指标交易信号策略
- 趋势跟随可变仓位网格策略
- 超级趋势与布林带组合策略
- MACD趋势跟踪策略
- EMA双均线交叉策略
- 黄金短线交易策略 (XAUUSD Scalper 1m)