Vielfältige ATR-Strategien für digitale Währungs-Futures (Teaching)
Schriftsteller:Die Erfinder quantifizieren - Kleine Träume, Erstellt: 2022-01-07 11:11:54, Aktualisiert: 2023-09-15 20:54:33
Vielfältige ATR-Strategien für digitale Währungs-Futures (Teaching)
In jüngster Zeit ist es für Plattformnutzer sehr erwartungsvoll, dass man eine Mac-Strategien in JavaScript-Strategien übertragen kann, um so viele Optimierungsideen flexibel hinzufügen zu können. Man kann sogar die Strategie auf verschiedene Versionen erweitern. Denn Mac-Strategien sind in der Regel Trend-Strategien, und viele werden mit einem Schlusspreismodell ausgeführt.
Die Strategie für die Transplantation
TR:=MAX(MAX((H-L),ABS(REF(C,1)-H)),ABS(REF(C,1)-L));
ATR:=EMA(TR,LENGTH2);

MIDLINE^^EMA((H + L + C)/3,LENGTH1);
UPBAND^^MIDLINE + N*ATR;
DOWNBAND^^MIDLINE - N*ATR;


BKVOL=0 AND C>=UPBAND AND REF(C,1)<REF(UPBAND,1),BPK;
SKVOL=0 AND C<=DOWNBAND AND REF(C,1)>REF(DOWNBAND,1),SPK;

BKVOL>0 AND C<=MIDLINE,SP(BKVOL);
SKVOL>0 AND C>=MIDLINE,BP(SKVOL);
// 止损
// stop loss
C>=SKPRICE*(1+SLOSS*0.01),BP;
C<=BKPRICE*(1-SLOSS*0.01),SP;
AUTOFILTER;
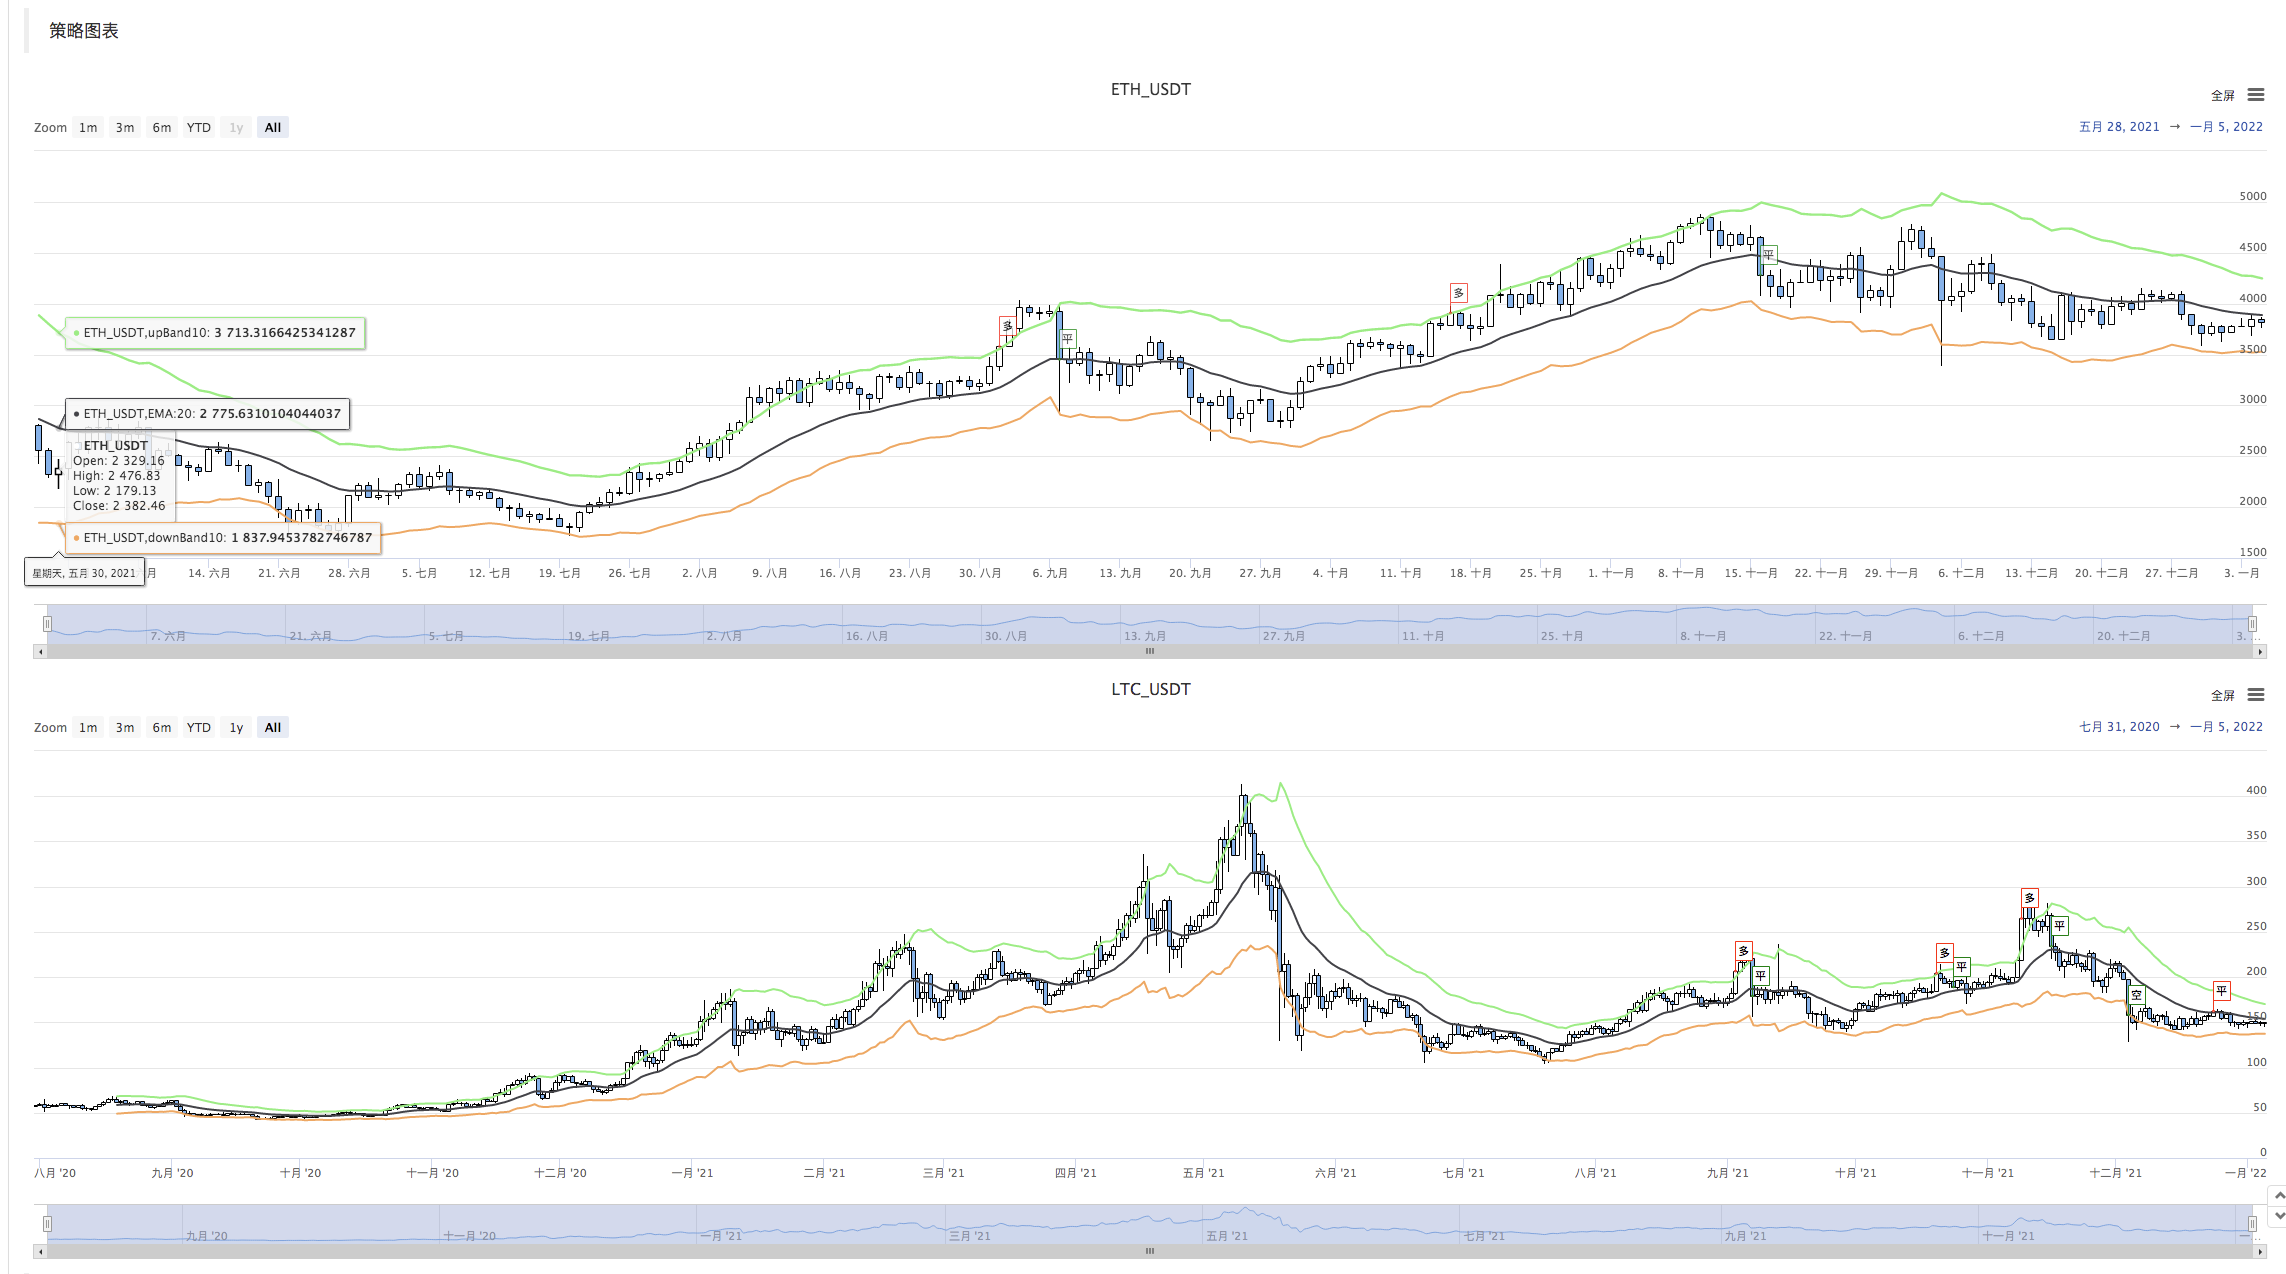
Die Handelslogik der Strategie ist einfach: Zuerst berechnet man das ATR anhand der Parameter, dann berechnet man die Mittelwerte der höchsten, niedrigsten und schließenden Preise aller K-LinienBAR und ermittelt die EMA anhand dieser Mittelwerte. Schließlich wird der Koeffizient N in den Parametern ATR kombiniert.
Die Eröffnungs- und Gegenhand basiert auf dem Schlusskurs, der den Kurs durchbricht. Die Brechungs- und Gegenhand (wenn sie einen leeren Kopf hält) ist häufiger, die Brechungs- und Gegenhand ist offen. Wenn der Schlusskurs die Mittellinie erreicht, wird er ausgeglichen, und wenn der Schlusskurs den Stop-Loss-Preis erreicht, wird er auch ausgeglichen (nach dem SLOSS-Stopp-Loss beträgt der SLOSS 1 oder 0.01, also 1%). Die Strategie wird mit dem Schlusskursmodell ausgeführt.
OK, wenn wir die strategischen Bedürfnisse und Ideen der Ma, verstehen, dann können wir mit Hand transplantieren.
Transplantation, Prototypen für die Gestaltung von Strategien
Die Strategieprototypen haben nicht mehr als 1 bis 200 Zeilen Code. Um die Ideen zu erlernen, wie man Strategien schreibt, schreibt man die Anmerkungen direkt in den Strategiecode.
// 解析params参数,从字符串解析为对象
var arrParam = JSON.parse(params)

// 该函数创建图表配置
function createChartConfig(symbol, atrPeriod, emaPeriod, index) {   // symbol : 交易对, atrPeriod : ATR参数周期 , emaPeriod : EMA参数周期 , index 对应的交易所对象索引
    var chart = {
        __isStock: true,
        extension: {
                layout: 'single',
                height: 600,
        },
        title : { text : symbol},
        xAxis: { type: 'datetime'},
        series : [
            {
                type: 'candlestick',    // K线数据系列
                name: symbol,
                id: symbol + "-" + index,
                data: []
            }, {
                type: 'line',           // EMA
                name: symbol + ',EMA:' + emaPeriod,
                data: [],
            }, {
                type: 'line',           // upBand
                name: symbol + ',upBand' + atrPeriod,
                data: []
            }, {
                type: 'line',           // downBand
                name: symbol + ',downBand' + atrPeriod,
                data: []
            }, {
                type: 'flags',
                onSeries: symbol + "-" + index,
                data: [],
            }
        ]
    }
    return chart
}

// 主要逻辑
function process(e, kIndex, c) {    // e 即交易所对象,exchanges[0] ... , kIndex K线数据在图表中的数据系列, c 为图表对象
    // 获取K线数据
    var r = e.GetRecords(e.param.period)
    if (!r || r.length < e.param.atrPeriod + 2 || r.length < e.param.emaPeriod + 2) {
        // K线数据长度不足则返回
        return
    }

    // 计算ATR指标
    var atr = TA.ATR(r, e.param.atrPeriod)
    var arrAvgPrice = []
    _.each(r, function(bar) {
        arrAvgPrice.push((bar.High + bar.Low + bar.Close) / 3)
    })
    // 计算EMA指标
    var midLine = TA.EMA(arrAvgPrice, e.param.emaPeriod)
    // 计算上下轨
    var upBand = []
    var downBand = []
    _.each(midLine, function(mid, index) {
        if (index < e.param.emaPeriod - 1 || index < e.param.atrPeriod - 1) {
            upBand.push(NaN)
            downBand.push(NaN)
            return
        }
        upBand.push(mid + e.param.trackRatio * atr[index])
        downBand.push(mid - e.param.trackRatio * atr[index])
    })

    // 画图
    for (var i = 0 ; i < r.length ; i++) {
        if (r[i].Time == e.state.lastBarTime) {
            // 更新
            c.add(kIndex, [r[i].Time, r[i].Open, r[i].High, r[i].Low, r[i].Close], -1)
            c.add(kIndex + 1, [r[i].Time, midLine[i]], -1)
            c.add(kIndex + 2, [r[i].Time, upBand[i]], -1)
            c.add(kIndex + 3, [r[i].Time, downBand[i]], -1)
        } else if (r[i].Time > e.state.lastBarTime) {
            // 添加
            e.state.lastBarTime = r[i].Time
            c.add(kIndex, [r[i].Time, r[i].Open, r[i].High, r[i].Low, r[i].Close])
            c.add(kIndex + 1, [r[i].Time, midLine[i]])
            c.add(kIndex + 2, [r[i].Time, upBand[i]])
            c.add(kIndex + 3, [r[i].Time, downBand[i]])
        }
    }

    // 检测持仓
    var pos = e.GetPosition()
    if (!pos) {
        return
    }
    var holdAmount = 0
    var holdPrice = 0
    if (pos.length > 1) {
        throw "同时检测到多空持仓!"
    } else if (pos.length != 0) {
        holdAmount = pos[0].Type == PD_LONG ? pos[0].Amount : -pos[0].Amount
        holdPrice = pos[0].Price
    }

    if (e.state.preBar == -1) {
        e.state.preBar = r[r.length - 1].Time
    }
    // 检测信号
    if (e.state.preBar != r[r.length - 1].Time) {   // 收盘价模型
        if (holdAmount <= 0 && r[r.length - 3].Close < upBand[upBand.length - 3] && r[r.length - 2].Close > upBand[upBand.length - 2]) {   // 收盘价上穿上轨
            if (holdAmount < 0) {   // 持有空仓,平仓
                Log(e.GetCurrency(), "平空仓", "#FF0000")
                $.CoverShort(e, e.param.symbol, Math.abs(holdAmount))
                c.add(kIndex + 4, {x: r[r.length - 2].Time, color: 'red', shape: 'flag', title: '平', text: "平空仓"})
            }
            // 开多
            Log(e.GetCurrency(), "开多仓", "#FF0000")
            $.OpenLong(e, e.param.symbol, 10)
            c.add(kIndex + 4, {x: r[r.length - 2].Time, color: 'red', shape: 'flag', title: '多', text: "开多仓"})
        } else if (holdAmount >= 0 && r[r.length - 3].Close > downBand[downBand.length - 3] && r[r.length - 2].Close < downBand[downBand.length - 2]) {  // 收盘价下穿下轨
            if (holdAmount > 0) {   // 持有多仓,平仓
                Log(e.GetCurrency(), "平多仓", "#FF0000")
                $.CoverLong(e, e.param.symbol, Math.abs(holdAmount))
                c.add(kIndex + 4, {x: r[r.length - 2].Time, color: 'green', shape: 'flag', title: '平', text: "平多仓"})
            }
            // 开空
            Log(e.GetCurrency(), "开空仓", "#FF0000")
            $.OpenShort(e, e.param.symbol, 10)
            c.add(kIndex + 4, {x: r[r.length - 2].Time, color: 'green', shape: 'flag', title: '空', text: "开空仓"})
        } else {
            // 平仓
            if (holdAmount > 0 && (r[r.length - 2].Close <= holdPrice * (1 - e.param.stopLoss) || r[r.length - 2].Close <= midLine[midLine.length - 2])) {   // 持多仓,收盘价小于等于中线,按开仓价格止损
                Log(e.GetCurrency(), "触发中线或止损,平多仓", "#FF0000")
                $.CoverLong(e, e.param.symbol, Math.abs(holdAmount))
                c.add(kIndex + 4, {x: r[r.length - 2].Time, color: 'green', shape: 'flag', title: '平', text: "平多仓"})
            } else if (holdAmount < 0 && (r[r.length - 2].Close >= holdPrice * (1 + e.param.stopLoss) || r[r.length - 2].Close >= midLine[midLine.length - 2])) {  // 持空仓,收盘价大于等于中线,按开仓价格止损
                Log(e.GetCurrency(), "触发中线或止损,平空仓", "#FF0000")
                $.CoverShort(e, e.param.symbol, Math.abs(holdAmount))
                c.add(kIndex + 4, {x: r[r.length - 2].Time, color: 'red', shape: 'flag', title: '平', text: "平空仓"})
            }
        }
        e.state.preBar = r[r.length - 1].Time
    }
}

function main() {
    var arrChartConfig = []
    if (arrParam.length != exchanges.length) {
        throw "参数和交易所对象不匹配!"
    }
    var arrState = _G("arrState")
    _.each(exchanges, function(e, index) {
        if (e.GetName() != "Futures_Binance") {
            throw "不支持该交易所!"
        }
        e.param = arrParam[index]
        e.state = {lastBarTime: 0, symbol: e.param.symbol, currency: e.GetCurrency()}
        if (arrState) {
            if (arrState[index].symbol == e.param.symbol && arrState[index].currency == e.GetCurrency()) {
                Log("恢复:", e.state)
                e.state = arrState[index]
            } else {
                throw "恢复的数据和当前设置不匹配!"
            }
        }
        e.state.preBar = -1   // 初始设置-1
        e.SetContractType(e.param.symbol)
        Log(e.GetName(), e.GetLabel(), "设置合约:", e.param.symbol)
        arrChartConfig.push(createChartConfig(e.GetCurrency(), e.param.atrPeriod, e.param.emaPeriod, index))
    })
    var chart = Chart(arrChartConfig)
    chart.reset()

    while (true) {
        _.each(exchanges, function(e, index) {
            process(e, index + index * 4, chart)
            Sleep(500)
        })
    }
}

function onexit() {
    // 记录 e.state
    var arrState = []
    _.each(exchanges, function(e) {
        arrState.push(e.state)
    })
    Log("记录:", arrState)
    _G("arrState", arrState)
}
Strategieparameter:
var params = '[{
        "symbol" : "swap",    // 合约代码
        "period" : 86400,     // K线周期,86400秒即为一天
        "stopLoss" : 0.07,    // 止损系数,0.07即7%
        "atrPeriod" : 10,     // ATR指标参数
        "emaPeriod" : 10,     // EMA指标参数
        "trackRatio" : 1,     // 上下轨系数
        "openRatio" : 0.1     // 预留的开仓百分比,暂时没支持
    }, {
        "symbol" : "swap",
        "period" : 86400,
        "stopLoss" : 0.07,
        "atrPeriod" : 10,
        "emaPeriod" : 10,
        "trackRatio" : 1,
        "openRatio" : 0.1
    }]'
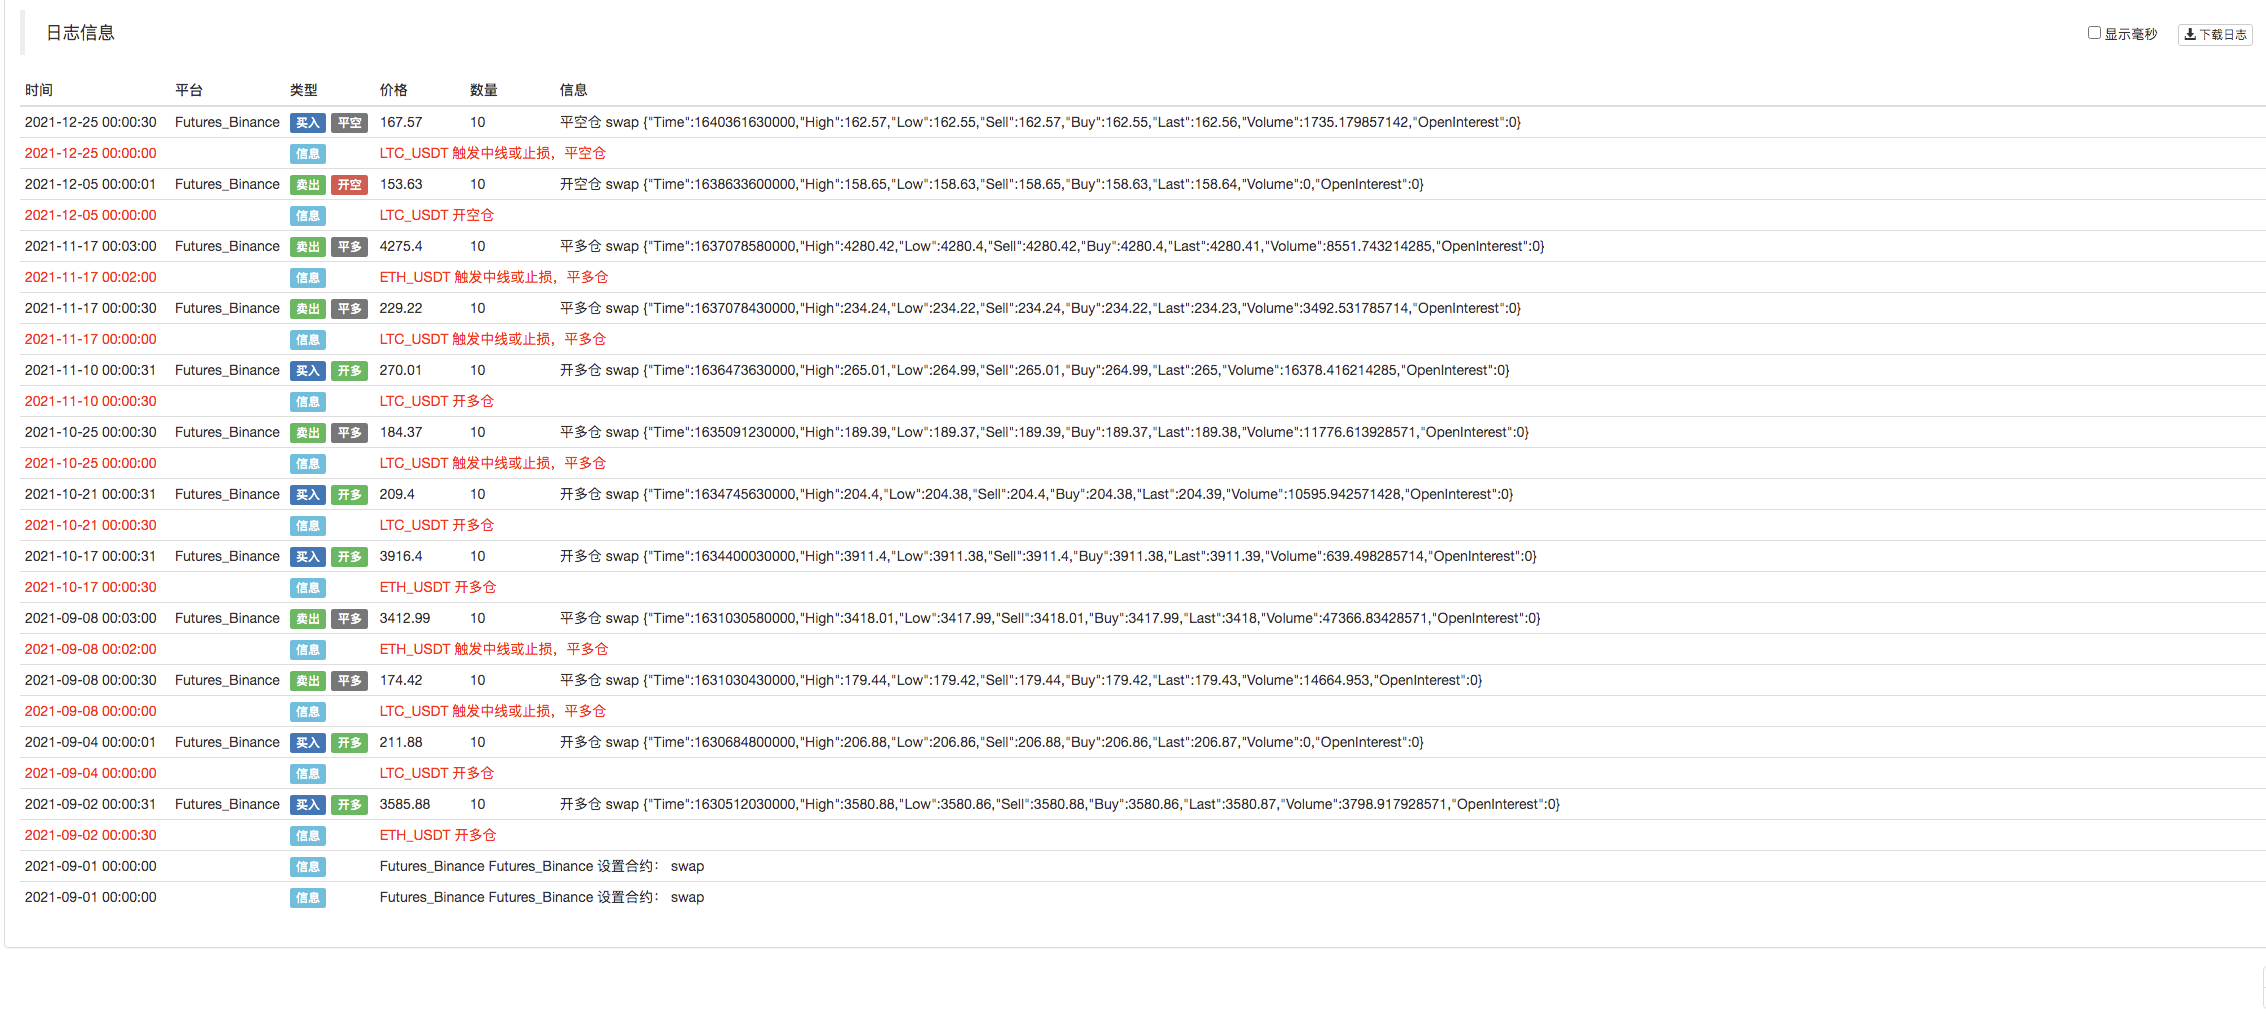
Wiederholungstests


Die Strategie ist hier:https://www.fmz.com/strategy/339344
Diese Strategie ist nur für Tests, Lern- und Forschungszwecke vorgesehen. Bitte ändern, optimieren und beziehen Sie sich selbst auf die App.
- Einführung in Lead-Lag-Arbitrage in Kryptowährungen (2)
- Einführung der Lead-Lag-Suite in der digitalen Währung (2)
- Diskussion über den externen Signalempfang der FMZ-Plattform: Eine Komplettlösung für den Empfang von Signalen mit integriertem Http-Service in der Strategie
- FMZ-Plattform: Erforschung von Signalempfangsstrategien für externe Netzwerke
- Einführung in Lead-Lag-Arbitrage in Kryptowährungen (1)
- Einführung der Lead-Lag-Suite in der Kryptowährung (1)
- Diskussion über den externen Signalempfang der FMZ-Plattform: Erweiterte API VS Strategie eingebauter HTTP-Service
- FMZ-Plattform-External Signal Reception: Erweiterung der API vs. Strategien für den eingebauten HTTP-Dienst
- Diskussion über die Strategie-Testmethode auf Basis eines Zufalls-Ticker-Generators
- Strategie-Testmethoden basierend auf Random-Market-Generatoren untersucht
- Neue Funktion von FMZ Quant: _Serve-Funktion zum einfachen Erstellen von HTTP-Diensten
- Wenn ich noch keine Strategien mit dieser leicht zu erlernenden Sprache schreiben würde, dann würde ich...
- Ausführliche Erläuterungen zu Gleichgewichts- und Netzstrategien
- Es ist eine Art Schönheit - wie man einfache Strategien entwirft, die wirksam sind.
- Die neue Strategie der digitalen Währung ist die Strategie der digitalen Währung.
- Entwerfen Sie eine Bibliothek mit mehreren Diagrammen
- Entwerfen einer Linienlibrary für mehrere Diagramme
- 60 Zeilen Code realisieren eine Idee - die Strategie der Vertragskopierung.
- Design eines FMZ-basierten Quantitativ-Synchronisierungsmanagementsystems (2)
- Gestaltung eines FMZ-basierten Quantitativ-Synchronisierungsmanagementsystems (1)
- Upgrade! Die Strategie von Martin für digitale Währungs-Futures
- Digitale Währungsmarkt-Rückblick 2021 mit den 10 einfachsten Strategien, die Sie verpasst haben
- Implementierung der JavaScript-Sprache für Fisher-Pointer und Grafiken auf FMZ
- Die Strategie der digitalen Währung ist eine gleichmäßige Strategie, die sich in verschiedenen Formen der Währung manifestiert.
- Die Strategie der doppelten Gleichlinien-Kernpunkte für digitale Währungs-Futures (Teaching)
- Aktuelle Kapitalrate-Strategie und empfohlene Maßnahmen
- Studien und Beispiele für das Entwerfen von Hedging-Strategie
- FMZ-Plattform Python Reptilian-Anwendung zum Erproben - Kryptographie der Ankündigung von Binance
- dYdX-Strategie-Design-Parameter - Zufallsgeschäftsstrategien
- Erfinder Quantitative Handelsplattform APP mit schneller Anmeldung
- Wechselkursdifferenz für den Wechselkurs der Währung