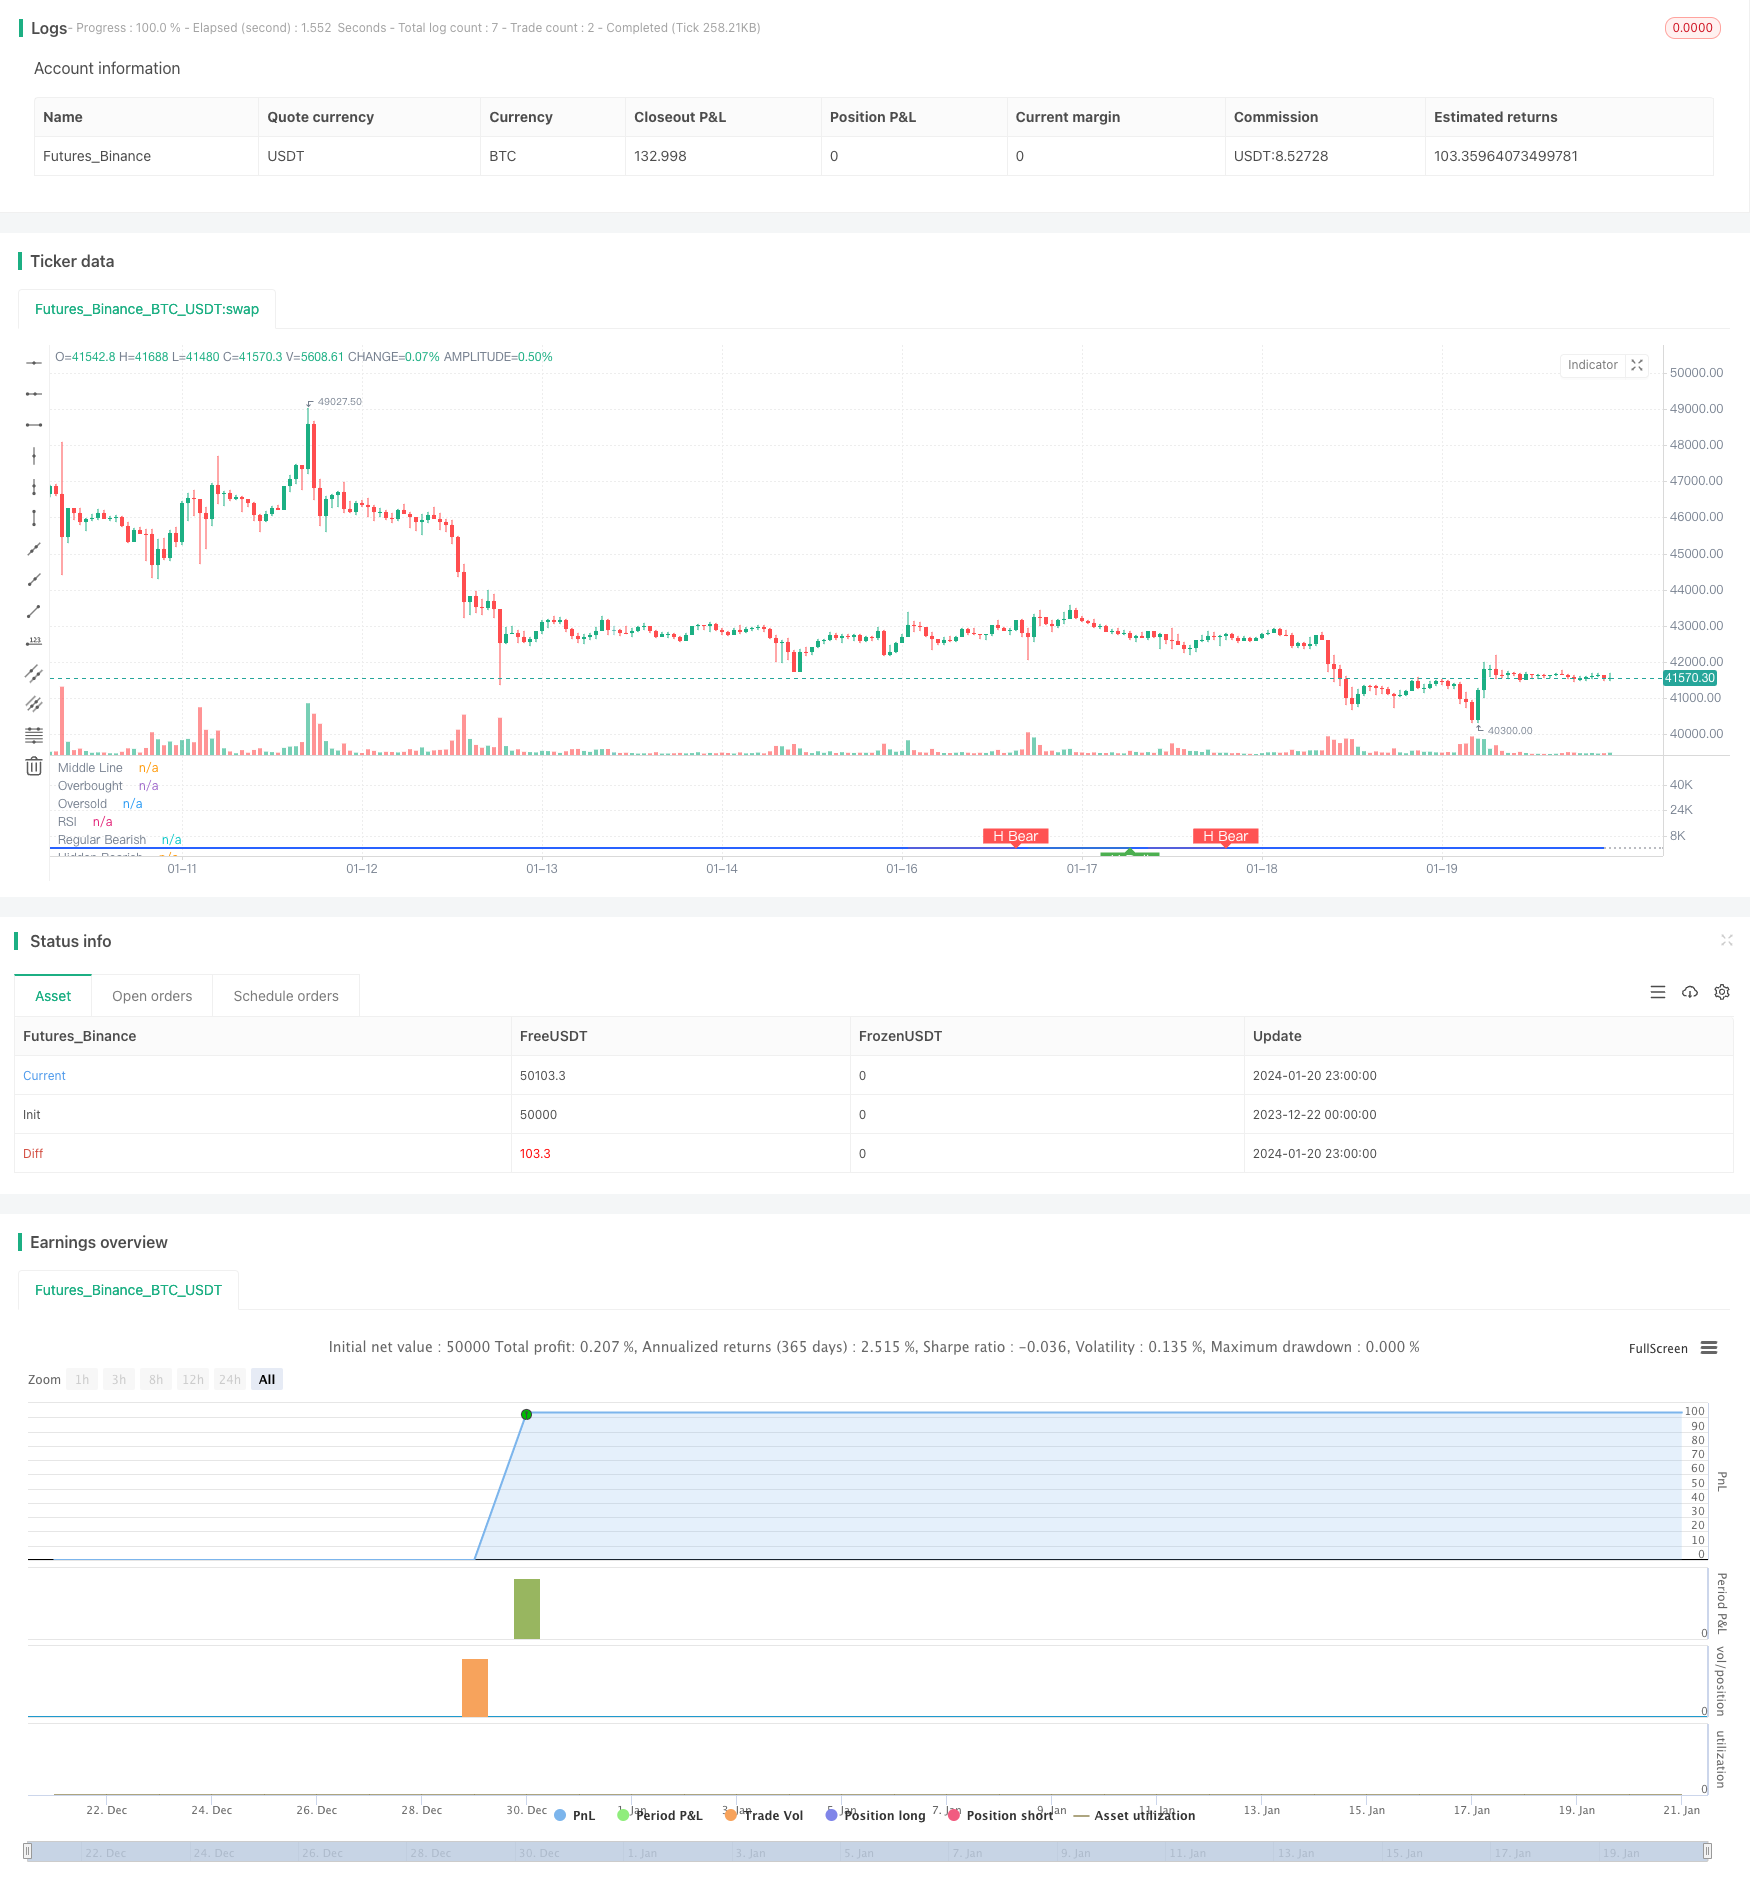
RSI-Divergenz-Handelsstrategie
Schriftsteller:ChaoZhang, Datum: 2024-01-22 11:45:25Tags:

Name der Strategie
RSI-Divergenz-Handelsstrategie Bulle/Bär
Übersicht
Diese Strategie identifiziert regelmäßige und versteckte bullische/bärenische RSI-Divergenzsignale zur Bestimmung von Long- und Short-Positionen.
Grundsätze
Wenn der Preis ein neues Hoch erreicht und der RSI nicht ein neues Hoch erreicht, bildet er eine bullische Divergenz, die als Verkaufssignal behandelt wird. Wenn der Preis ein neues Tief erreicht und der RSI nicht ein neues Tief erreicht, bildet er eine bärische Divergenz, die als Kaufsignal behandelt wird. Regelmäßige Divergenz bezieht sich auf die offensichtliche Divergenz zwischen Preis und RSI, während versteckte Divergenz eine relativ versteckte Divergenz zwischen ihnen bedeutet.
Analyse der Vorteile
- Divergenzsignale haben eine relativ hohe Zuverlässigkeit mit einer höheren Gewinnrate.
- Die Identifizierung sowohl regelmäßiger als auch versteckter bullischer/bärenischer Divergenzen bietet eine umfangreiche Abdeckung.
- Durch die verstellbaren RSI-Parameter ist es an verschiedene Marktumgebungen angepasst.
Risikoanalyse
- Versteckte Divergenzsignale haben eine höhere Wahrscheinlichkeit von Fehleinschätzungen.
- Es ist eine manuelle Überprüfung erforderlich, um fehlerhafte Signale auszuschließen.
- Die Wirksamkeit hängt von den Einstellungen der RSI-Parameter ab.
Optimierungsrichtlinien
- Optimieren Sie die RSI-Parameter, um die besten Parameterkombinationen zu finden.
- Hinzufügen von Algorithmen für maschinelles Lernen zur automatischen Identifizierung wahrer Signale.
- Mehr Indikatoren zur Überprüfung der Signalzuverlässigkeit.
Zusammenfassung
Diese Strategie identifiziert RSI-Divergenz-Handelssignale basierend auf regelmäßigen und versteckten Bullish/Bearish-Divergenzen, um Long- oder Short-Positionen zu bestimmen, was eine relativ höhere Gewinnrate bietet.
/*backtest
start: 2023-12-22 00:00:00
end: 2024-01-21 00:00:00
period: 1h
basePeriod: 15m
exchanges: [{"eid":"Futures_Binance","currency":"BTC_USDT"}]
*/

//@version=5
strategy(title="Divergence Indicator")
len = input.int(title="RSI Period", minval=1, defval=14)
src = input(title="RSI Source", defval=close)
lbR = input(title="Pivot Lookback Right", defval=5)
lbL = input(title="Pivot Lookback Left", defval=5)
rangeUpper = input(title="Max of Lookback Range", defval=60)
rangeLower = input(title="Min of Lookback Range", defval=5)
plotBull = input(title="Plot Bullish", defval=true)
plotHiddenBull = input(title="Plot Hidden Bullish", defval=true)
plotBear = input(title="Plot Bearish", defval=true)
plotHiddenBear = input(title="Plot Hidden Bearish", defval=true)
bearColor = color.red
bullColor = color.green
hiddenBullColor = color.new(color.green, 80)
hiddenBearColor = color.new(color.red, 80)
textColor = color.white
noneColor = color.new(color.white, 100)
osc = ta.rsi(src, len)

plot(osc, title="RSI", linewidth=2, color=#2962FF)
hline(50, title="Middle Line", color=#787B86, linestyle=hline.style_dotted)
obLevel = hline(70, title="Overbought", color=#787B86, linestyle=hline.style_dotted)
osLevel = hline(30, title="Oversold", color=#787B86, linestyle=hline.style_dotted)
fill(obLevel, osLevel, title="Background", color=color.rgb(33, 150, 243, 90))

plFound = na(ta.pivotlow(osc, lbL, lbR)) ? false : true
phFound = na(ta.pivothigh(osc, lbL, lbR)) ? false : true
_inRange(cond) =>
	bars = ta.barssince(cond == true)
	rangeLower <= bars and bars <= rangeUpper

//------------------------------------------------------------------------------
// Regular Bullish
// Osc: Higher Low

oscHL = osc[lbR] > ta.valuewhen(plFound, osc[lbR], 1) and _inRange(plFound[1])

// Price: Lower Low

priceLL = low[lbR] < ta.valuewhen(plFound, low[lbR], 1)
// bull : 상승 Condition : 조건
bullCond = plotBull and priceLL and oscHL and plFound // 상승다이버전스?
strategy.entry("상승 다이버전스 진입", strategy.long, when = bullCond)
strategy.close("상승 다이버전스 진입", when = ta.crossover(osc, 50))
plot(
     plFound ? osc[lbR] : na,
     offset=-lbR,
     title="Regular Bullish",
     linewidth=2,
     color=(bullCond ? bullColor : noneColor)
     )

plotshape(
	 bullCond ? osc[lbR] : na,
	 offset=-lbR,
	 title="Regular Bullish Label",
	 text=" Bull ",
	 style=shape.labelup,
	 location=location.absolute,
	 color=bullColor,
	 textcolor=textColor
	 )

//------------------------------------------------------------------------------
// Hidden Bullish
// Osc: Lower Low

oscLL = osc[lbR] < ta.valuewhen(plFound, osc[lbR], 1) and _inRange(plFound[1])

// Price: Higher Low

priceHL = low[lbR] > ta.valuewhen(plFound, low[lbR], 1)
hiddenBullCond = plotHiddenBull and priceHL and oscLL and plFound
// strategy.entry("히든 상승 다이버전스 진입", strategy.long, when = hiddenBullCond)
// strategy.close("히든 상승 다이버전스 진입", when = ta.crossover(osc, 50))
plot(
	 plFound ? osc[lbR] : na,
	 offset=-lbR,
	 title="Hidden Bullish",
	 linewidth=2,
	 color=(hiddenBullCond ? hiddenBullColor : noneColor)
	 )

plotshape(
	 hiddenBullCond ? osc[lbR] : na,
	 offset=-lbR,
	 title="Hidden Bullish Label",
	 text=" H Bull ",
	 style=shape.labelup,
	 location=location.absolute,
	 color=bullColor,
	 textcolor=textColor
	 )

//------------------------------------------------------------------------------
// Regular Bearish
// Osc: Lower High

oscLH = osc[lbR] < ta.valuewhen(phFound, osc[lbR], 1) and _inRange(phFound[1])

// Price: Higher High

priceHH = high[lbR] > ta.valuewhen(phFound, high[lbR], 1)
// bear : 하락
bearCond = plotBear and priceHH and oscLH and phFound
// strategy.entry("하락 다이버전스 진입", strategy.short, when = bearCond)
// strategy.close("하락 다이버전스 진입", when = ta.crossunder(osc, 50))
plot(
	 phFound ? osc[lbR] : na,
	 offset=-lbR,
	 title="Regular Bearish",
	 linewidth=2,
	 color=(bearCond ? bearColor : noneColor)
	 )

plotshape(
	 bearCond ? osc[lbR] : na,
	 offset=-lbR,
	 title="Regular Bearish Label",
	 text=" Bear ",
	 style=shape.labeldown,
	 location=location.absolute,
	 color=bearColor,
	 textcolor=textColor
	 )

//------------------------------------------------------------------------------
// Hidden Bearish
// Osc: Higher High

oscHH = osc[lbR] > ta.valuewhen(phFound, osc[lbR], 1) and _inRange(phFound[1])

// Price: Lower High

priceLH = high[lbR] < ta.valuewhen(phFound, high[lbR], 1)

hiddenBearCond = plotHiddenBear and priceLH and oscHH and phFound
// strategy.entry("히든 하락 다이버전스 진입", strategy.short, when = hiddenBearCond)
// strategy.close("히든 하락 다이버전스 진입", when = ta.crossunder(osc, 50))
plot(
	 phFound ? osc[lbR] : na,
	 offset=-lbR,
	 title="Hidden Bearish",
	 linewidth=2,
	 color=(hiddenBearCond ? hiddenBearColor : noneColor)
	 )

plotshape(
	 hiddenBearCond ? osc[lbR] : na,
	 offset=-lbR,
	 title="Hidden Bearish Label",
	 text=" H Bear ",
	 style=shape.labeldown,
	 location=location.absolute,
	 color=bearColor,
	 textcolor=textColor
	 )
- Dynamische Unterstützung und Widerstandsstrategie der CCI
- QQE-Momentum-Handelsstrategie
- Die Strategie zur Vorhersage von Gausswellen
- Kombination von dynamisch beweglichen EMAs
- Donchian Channel Trend nach der Strategie
- EMA-Bandstrategie
- Genaue Trendumkehrungs-Durchschnittsstrategie
- Aufwärtstrendstrategie mit mehreren EMA
- S&P500 Hybride Saisonhandelsstrategie
- Abweichungsbasierte Trendverfolgungsstrategie
- Strategie für einen Mehrindikator-Entscheidungsträuß: IMACD, EMA und Ichimoku
- MACD-Doppeloptimierungsstrategie
- Doppelte EMA-Goldene Kreuz-Strategie
- Multi-Zeitrahmen-RSI und gleitende Durchschnittshandelsstrategie
- Wöchentliche Swing-Handelsstrategie
- EVWMA-basierte MACD-Handelstrategie
- Bollinger-Bänder-Kanal-Breakout-Mittelumkehrstrategie
- Quantitative Trendverfolgungsstrategie auf der Grundlage mehrerer technischer Indikatoren
- Quantitative Handelsstrategie der Kombination von RSI und CCI
- Niedrigrisikorechtes DCA-Trend-Handel