AI case studies: the strategy of multiple heads
Author: FMZ~Lydia, Created: 2024-11-07 15:49:45, Updated:In this article, we will use a sophisticated algorithm to improve a module of the Alternative Data-Driven Investment (ADDI) strategy, an automated multi-space investment strategy aimed at achieving a stable performance that is market detached and with minimal risk of reversal.
The algorithm we developed is a customized deep neural network, which we use to reduce the risks associated with multi-space strategies.
Why use neural networks?
The background
For theQuantitative investorsBut one of the most important and interesting phases is just ahead, with countless possibilities: How are we going to turn this data into signals?
We can choose traditional statistical methods to examine our hypotheses carefully, or we can explore advanced algorithmic areas such as machine learning and deep learning. Perhaps your fascination with several macroeconomic theories makes you want to study their applicability in the FX market. Or perhaps your enthusiasm for understanding FMZ may lead you down the path of quantitative investing. Each of these research paths is not only effective, but worth exploring.
ETS methodology
In our case, there is only one guiding principle when choosing a field of study:Dare to innovate 。
When someone thinks of a cathedral as a pile of stones, it is no longer a pile of stones.
The basic principle behind this is very simple: if we don't innovate, we won't stand out and our chances of success will be reduced. So whether we're developing a new strategy that relies on traditional statistics or involves extracting insights from a company's financial statements, we always try to do it in a novel way. We create specific tests for specific scenarios, detect anomalies in financial statements, or adjust our models based on specific problems.
Therefore, due to the adaptability and flexibility of neural networks, they are particularly attractive in solving specific problems, which helps us develop innovative technologies.
As we have seen, there are many ways to use these techniques. However, we have to be careful because there are no magic formulas here. As with any effort, we should always start from the basics, and sometimes, simple linear regression can prove very effective.
Returning to today's focus, we will leverage the powerful capabilities of deep neural networks to use financial statements and historical price data as input to predict risk.
Our model
That said, we will evaluate the performance of the model by comparing it to simpler methods such as historical volatility rates.
Before we go deeper, let's assume that we already know some of the key concepts of neural networks and how we can use them to infer the distribution of predictive output.
Furthermore, for today's purposes, we will focus only on the improvement in our benchmark and the results obtained after applying it to our investment strategy.
Therefore, in a subsequent article on measuring time series data uncertainty, we will attempt to estimate a company's risk by predicting the fraction of expected price returns over different time frames in the future, in our example the time frame is 5 to 90 days.
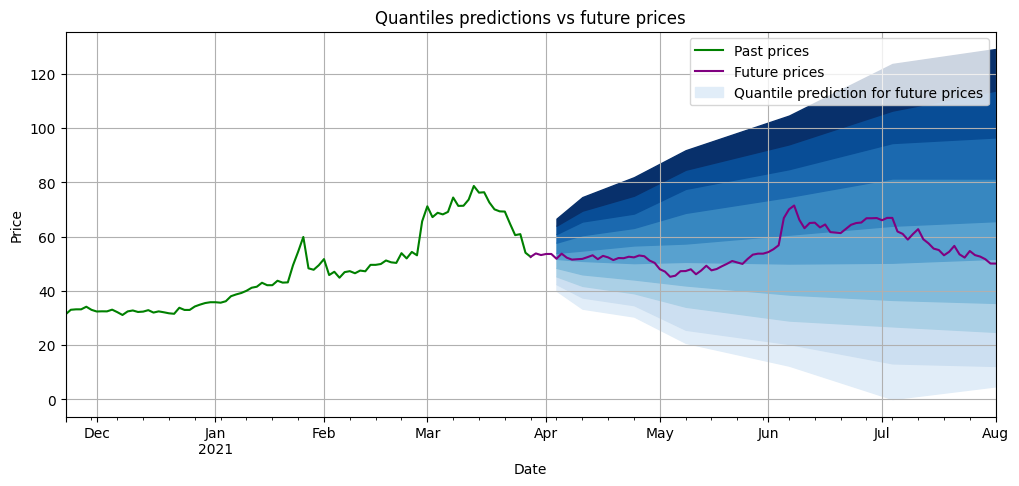
Below is an example of how a differential prediction (blue) for different time frames in the future will show up after model training. The wider the interval between the predicted differentials, the greater our investment risk. The purple is what actually happens after the prediction is made.

Evaluating our model
As mentioned above, before using our model in our strategy, we compare its prediction with the prediction obtained using a simple conversion of past volatility rates. Is a simple conversion of past volatility rates better than a complex algorithm?
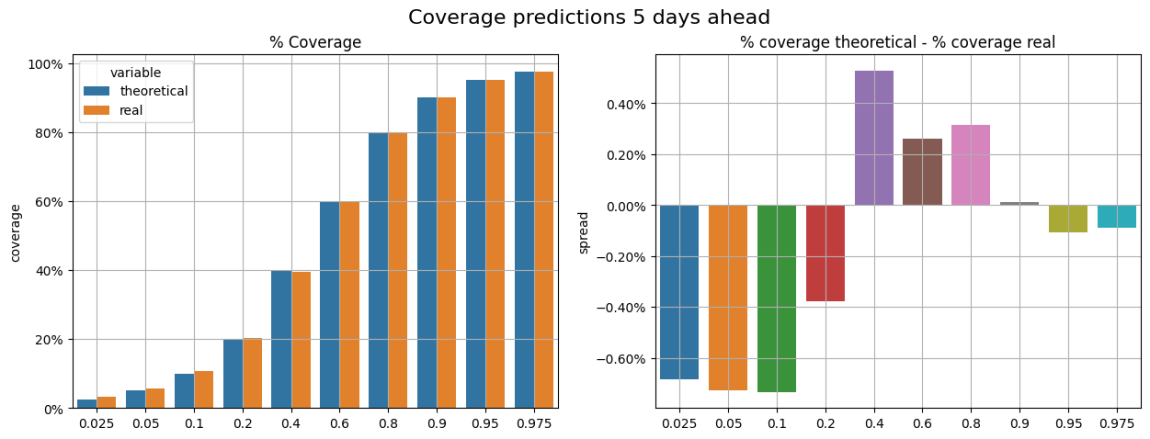
In order to evaluate our models and benchmarks, we compared their exponential predictions with the observed returns. For example, among all our predictions of exponential 0.9, we expected, on average, a 90% probability of price returns below the exponential prediction.
This is what we try to evaluate in the following graph (all the results shown are from the test set); in the left graph, we can compare theoretical coverage and actual coverage; in the right graph, we see the difference between these coverages (theoretical coverage - actual coverage), which we callCoverage errorFor example, for the fraction 0.2, the coverage error is close to 0.4%, which means that on average we observe 20.4% of the data below these values, rather than the theoretical 20%.

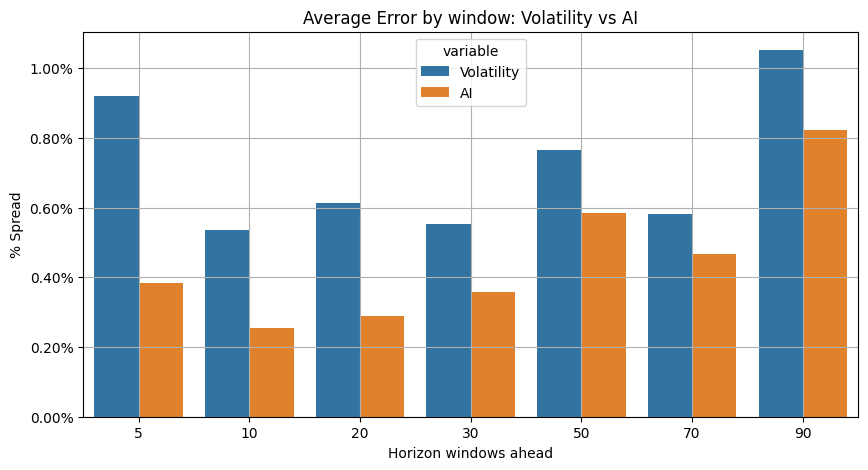
We averaged the coverage error of all exponents by projection window (5, 10...days) and compared the results obtained by the benchmark test and the AI model.Our deep learning model is performing better.We are ready to introduce our model into our strategy.

Artificial intelligence is included in ADDI
ADDI is a beta-neutral leveraged investment portfolio (beta value ~0.1), capable of generating alpha in bearish and bearish market conditions, with a limited net leverage to the market and a low risk situation.
The multi-head section of the strategy chooses high-quality and low volatility deviations. Therefore, inventory risk assessment is an important task in the process. In the empty head, risk assessment is also an important calculation as the strategy attempts to avoid very high or very low risk projects.
We can measure risk by measuring the historical volatility of different computational cycles in the multi-head and blank parts of the strategy.
In order to improve ADDI risk analysis, we will test the previously shown deep neural network algorithms to replace the current risk calculation process.
The results
Testing the new deep learning model on a multi-headed, empty-headed strategy that invests in the S&P 900 index component has seen improved results in both performance and risk:

- The total return shown is higher than the original version
- The volatility decreases
- Sharp Rate Increases
- Reduced risk in recall and VaR
- The highest one-year rolling growth is higher.

Conclusions
In this article, we show an example of a high-level algorithmic model that is used to improve transactional multi-space quantization (ADDI) strategies. We explain how to use neural networks to improve and more accurately manage specific tasks in quantized investment products, thereby improving the end result.
However, the applicability of the model goes beyond that, and we can use the algorithm for a variety of other strategies. For example, we can use it to select the companies with the highest Sharpe ratio, or even to implement pairing trading strategies. Can you think of other strategies?
The original link:https://quantdare.com/ai-case-study-long-short-strategy/
- Is this error occurring when the minimum transaction volume is set to 0.01?
- Please teach me the problem of reporting the error in the Bitcoin balance sheet.
- Please teach me JS code problems.
- Metcalfe's law in Bitcoin
- Rethinking Bitcoin's trend tracking and mean return strategy
- How many bitcoins should we allocate to the portfolio?
- How to profit from Bitcoin overnight trading?
- Why is the page always crashing?
- Building and implementing portfolio optimization using trading volume
- How do you update the parameters of a running disk?
- Strategy coding, professional quantification, former central company programmer, professional reliability.
- Simple versus advanced trading strategies - which is better?
- Python library for quantifying transactions
- Ornstein-Uhlenbeck simulation with Python
- Learn the PINE code, please ask what is the problem with the stop loss setting? Stop loss is not executed when retested, stop loss is executed when played, but subsequently does not open a straightforward, uninterrupted position according to the conditions.
- pine multi-cycle
- Summary of futures exchange orders and hold interface query details
- pine language
- o(╥﹏╥)o
- Ask people to write a grid strategy.