Rethinking Bitcoin's trend tracking and mean return strategy
Author: FMZ~Lydia, Created: 2024-11-21 15:12:50, Updated:Major changes in the financial landscape over the past few years have reshaped the dynamics of global markets, including the cryptocurrency space. The ongoing war in Ukraine, rising inflation, the soft landing of the US economy and the recent halving of Bitcoin have all had a profound impact on market sentiment and price movements. In light of these developments, we have decided to re-examine, re-evaluate our trading strategy, especially the 2022 release.Bitcoin trend tracking and mean returnThe new study explores the performance of these strategies between November 2015 and August 2024, while taking into account recent changes. The study also explores the market changes between February 2022 and August 2024, highlighting developments since the previous study. It also assesses the seasonal impact on Bitcoin price movements, similar to our previous article.The Seasonality of BitcoinBy analyzing these factors, we aim to gain a deeper understanding of the evolution of the world's leading cryptocurrency and guide investors in today's complex market environment.
Analysis within the sample
All analyses are based onGemini DataDaily real BTC data on the page. The data represents the opening price of BTC from October 9, 2015 to August 20, 2024, with the first observation date of November 11, 2015. We applied the MIN and MAX strategies to these data. The MAX strategy is based on a trend-tracking pattern, in which the most recently valued assets tend to continue to grow over the next few days. The MIN strategy is based on the theory of mean return, which states that returns tend to return to the average over time, even if the returns are very low, and they eventually return to that average.
Similar to the original, for each observed day (t) we calculate BTC's maximum (MAX) and minimum (MIN) prices for the last 10, 20, 30, 40 and 50 days:

Where BTCt is the price on day t, and X is the retrospective period.
In the next step, we will explore the behavior when BTC price reaches a maximum or minimum in a given time period. Unlike the original, this time we do not focus on behavior below the maximum or above the minimum. For the calculation, we use the following formula:
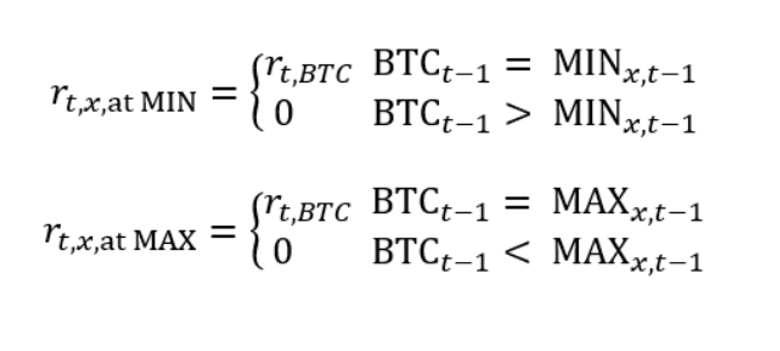
where rt,x is the BTC gain on day t of the x-day cycle.
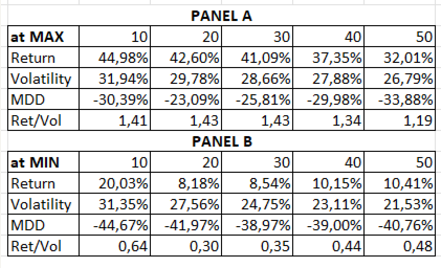 Table 1 Basic performance characteristics of strategies traded in MAX (panel A) and MIN (panel B), where Return represents annualized earnings, Volatility represents annualized volatility, MDD represents maximum drawdown, and Ret/Vol represents annualized earnings divided by annualized volatility.
According to Table 1, both strategies are still valid, especially in the 10-day cycle. For the MAX strategy shown in panel A, it seems to be better than the MIN strategy in panel B, because the returns are higher and the drawdowns are lower, although both strategies are valid for trades.
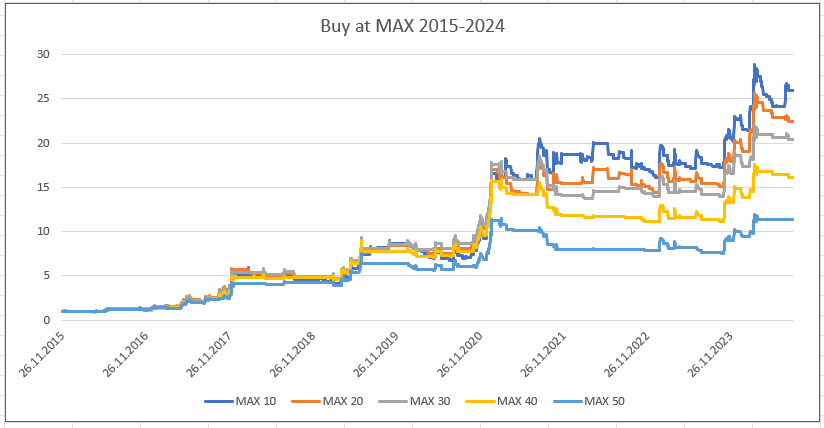
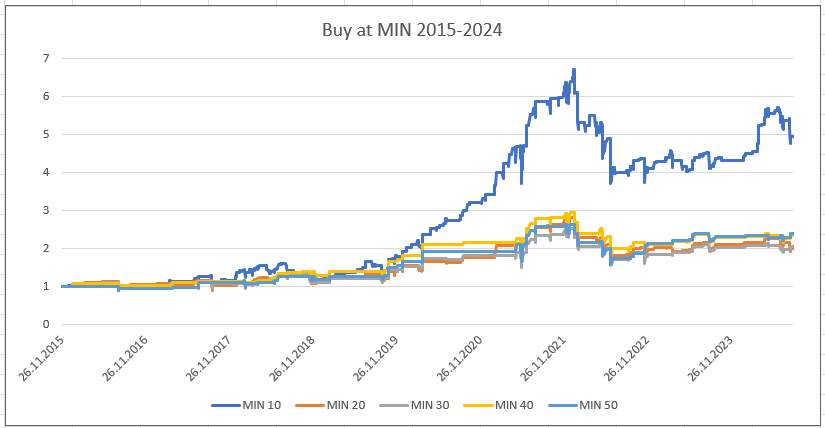
Min purchases are slower to grow, with more flat sections of the curve, compared to MAX purchases, but also lead to more severe pullbacks, as shown by the values in Table 1.
Overall, both strategies were slightly less effective than the original study; however, they were still relevant and most effective when buying BTC at the highest or lowest price in the last 10 days, based on the results.
In our previous research, we used the MIN and MAX strategies in combination to buy BTC at the lowest and highest prices in the last 10 days. Based on this, we decided to re-engineer the strategy for longer periods of time.
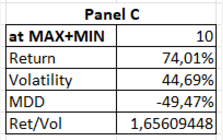
Table 2 shows the basic performance characteristics of the strategies traded in MAX and MIN (Panel C), where Return represents annualized earnings, Volatility represents annualized volatility, MDD represents maximum retracement, and Ret/Vol represents annualized earnings divided by annualized volatility.
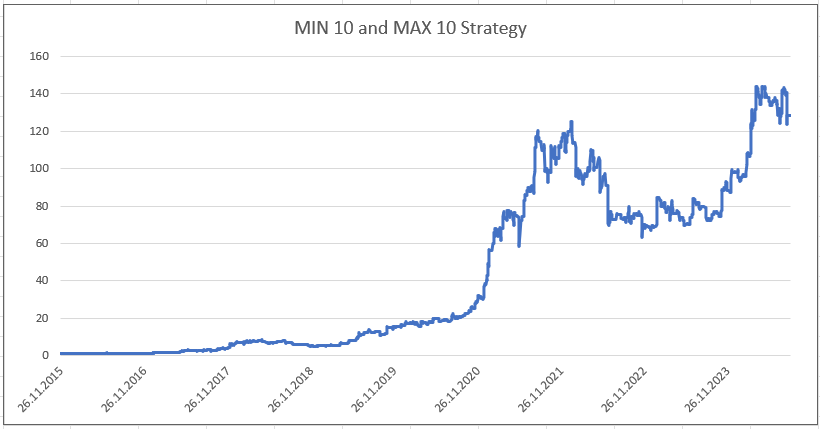
With this approach, we can still get high returns (MIN+MAX strategy is close to its historical high), and the drawdown is lower than the BTC market where only buy and hold tokens.
External analysis of the sample
We then applied these strategies only to dates not included in the original study, specifically from February 4, 2022, to August 20, 2024. During this period, the price of Bitcoin experienced a significant decline, which provided the perfect stress test for the out-of-sample analysis.
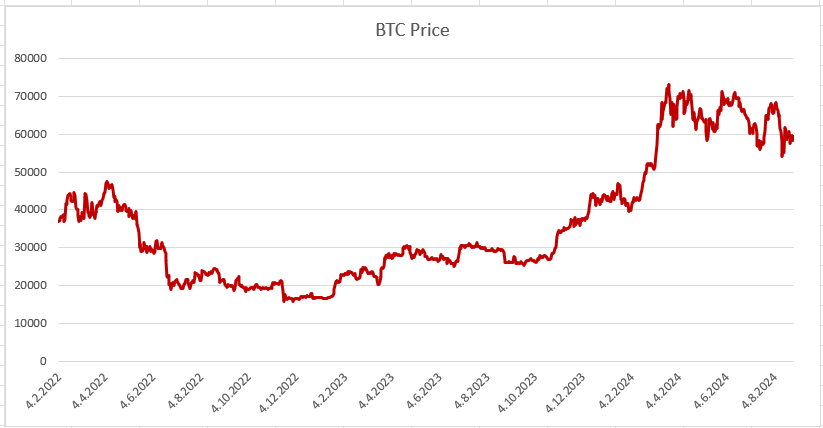
The last two and a half years have been full of challenges for this popular cryptocurrency, all of which have had a significant impact on the financial landscape due to the ongoing war in Ukraine, rising inflation rates or the soft landing of the US economy.
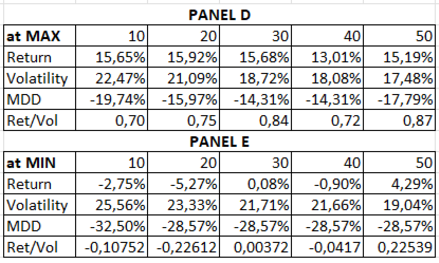
Table 3 shows the basic performance characteristics of the strategies traded in MAX (panel D) and MIN (panel E), where Return represents annualized earnings, Volatility represents annualized volatility, MDD represents maximum retracement, and Ret/Vol represents annualized earnings divided by annualized volatility.
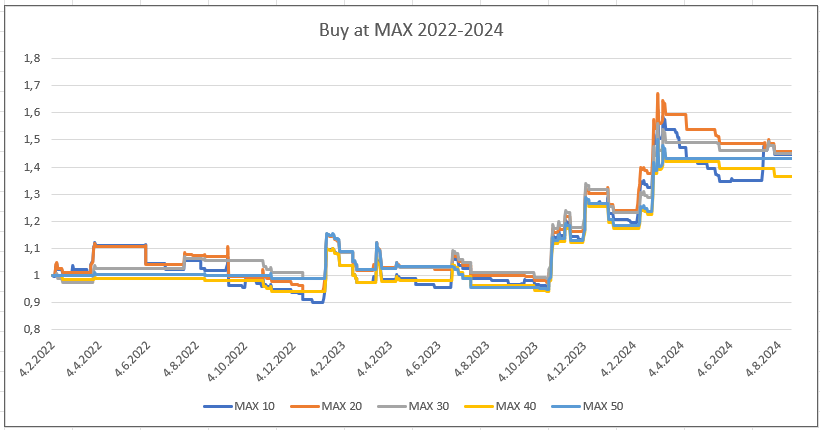
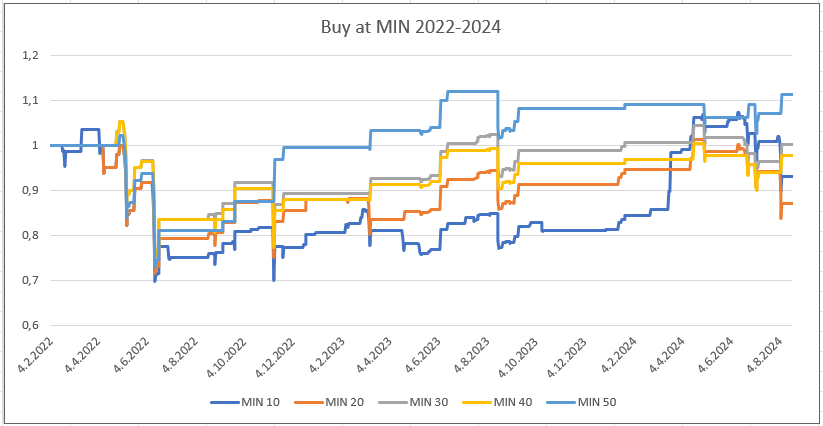
The MAX strategy is still effective despite the decline in BTC prices. However, buying at BTC's 10-day high seems to be less effective than buying at its 20-day high, but it is still worth it, and so is all other periods. On the other hand, the second step of the MIN+MAX strategy performs poorly at the lows. Over the past 2.5 years, the strategy has been affected by the BTC price decline, with low or even negative returns.
Seasonality
Since the seasonality of Bitcoin is important, as discussed in the article on the seasonality of Bitcoin, we are curious to know if the daily seasonality will affect the MIN/MAX strategy. For each day from October 9, 2015 to August 20, 2024, we use a modified formula that contains a specific date:
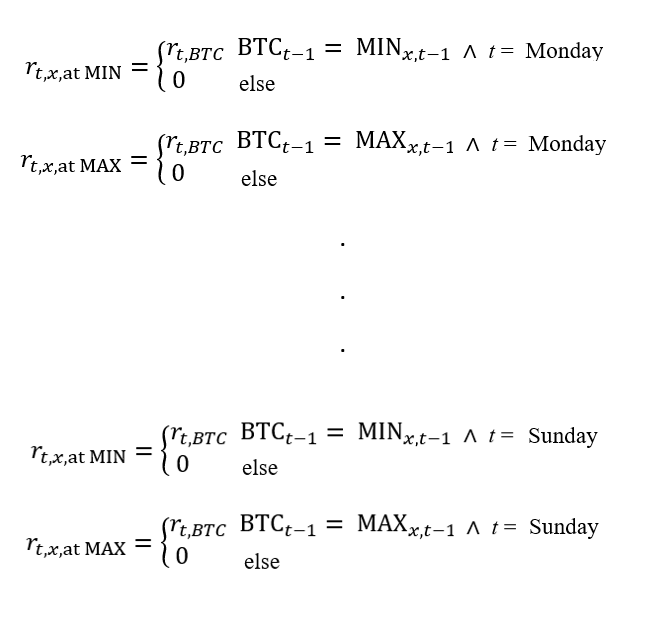
Using this method, we originally generated 7 charts for the MAX strategy, and then generated 7 charts for the MIN strategy. The first line of the chart corresponds to the calculation of time t = Monday, the second line corresponds to the calculation of time t = Tuesday, and so on.
Seasonality in the MAX strategy
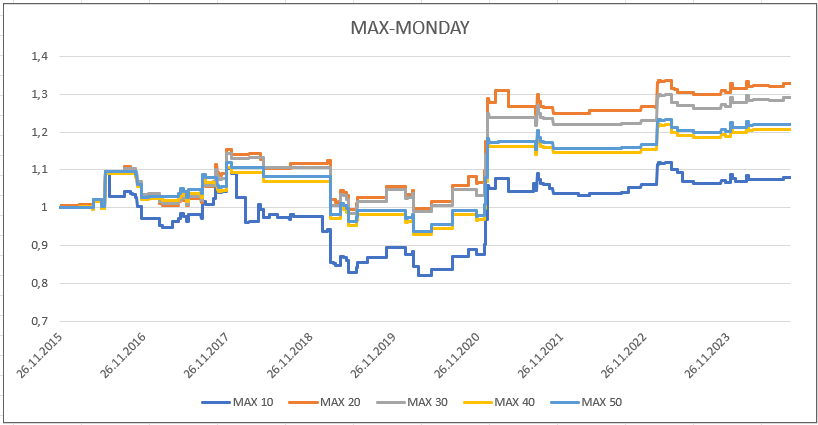
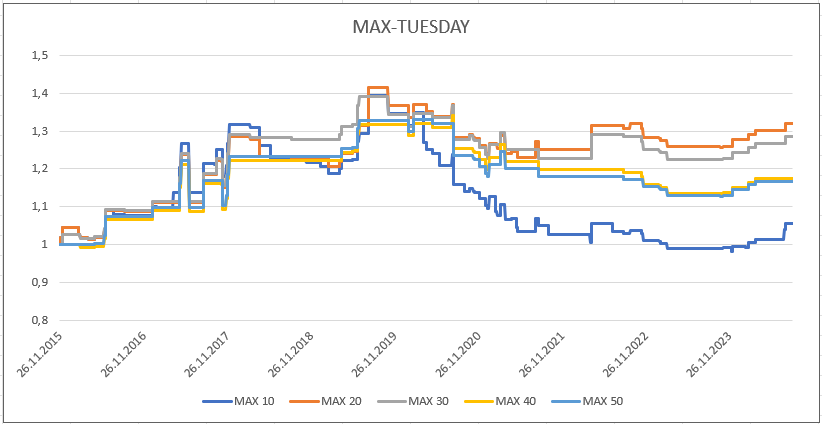
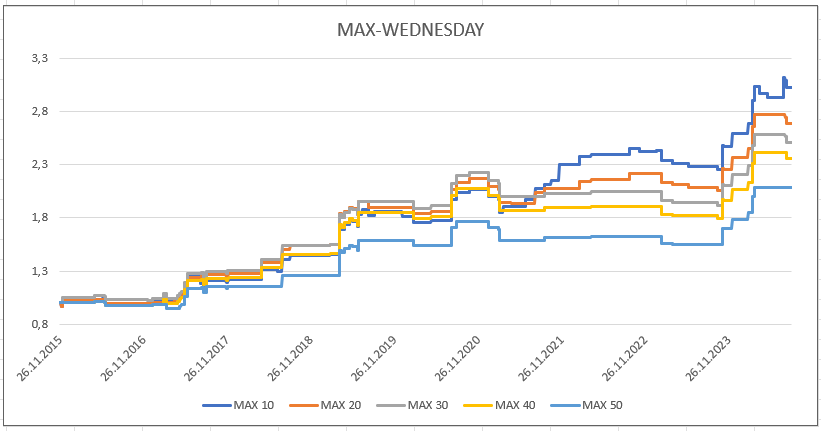
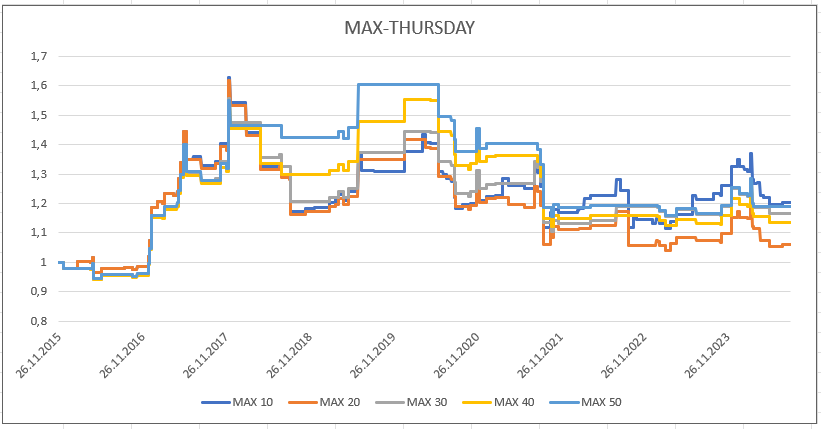
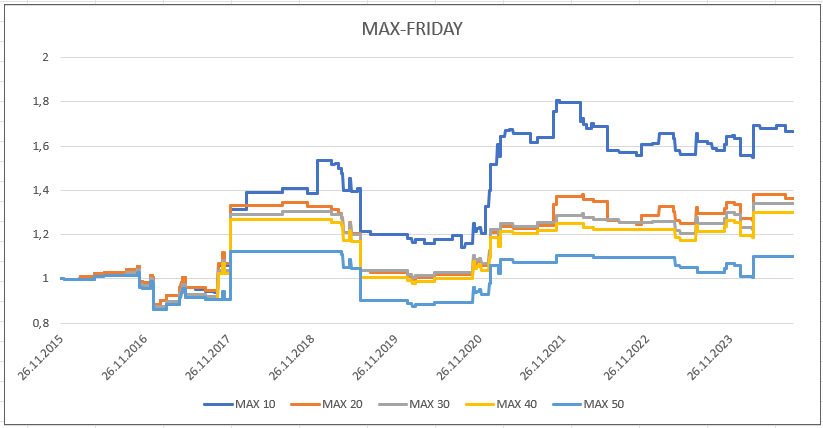
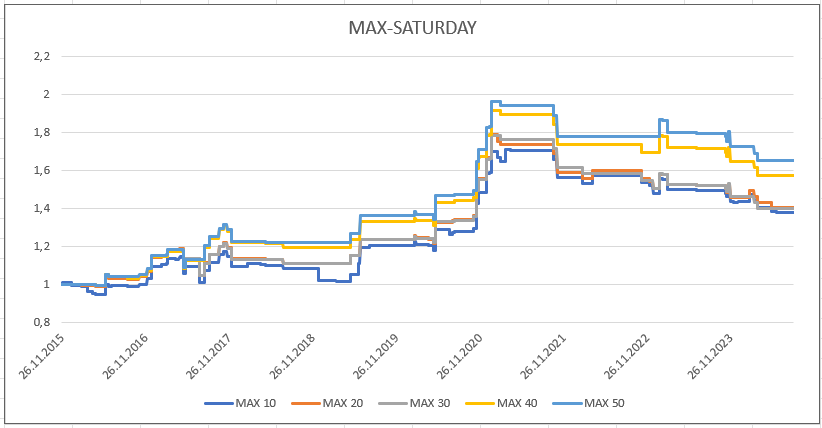
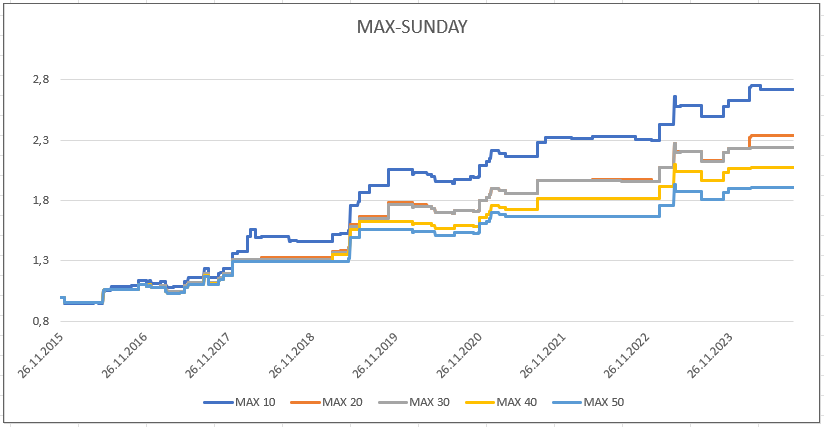
Based on the above graph, we can say that the strongest days to hold BTC when BTC reaches its maximum value are Wednesday and Sunday, with 10 days of maximum showing the best results again. We originally assumed there was a weekend effect, with Friday, Saturday, Sunday and Monday performing better. Although the t = Sunday incremental curve suggests such an effect, other weekends do not support this hypothesis.
Seasonality in the MIN strategy
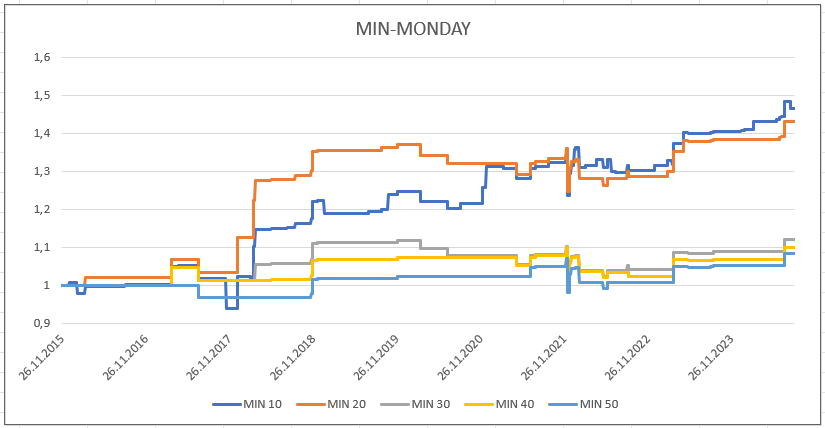
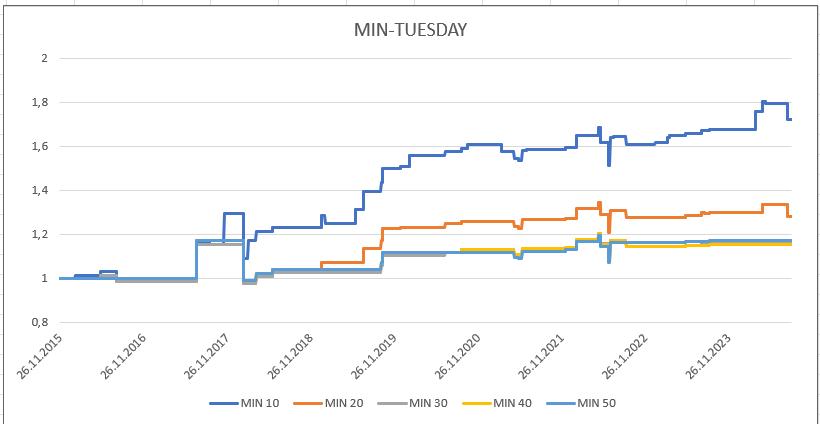
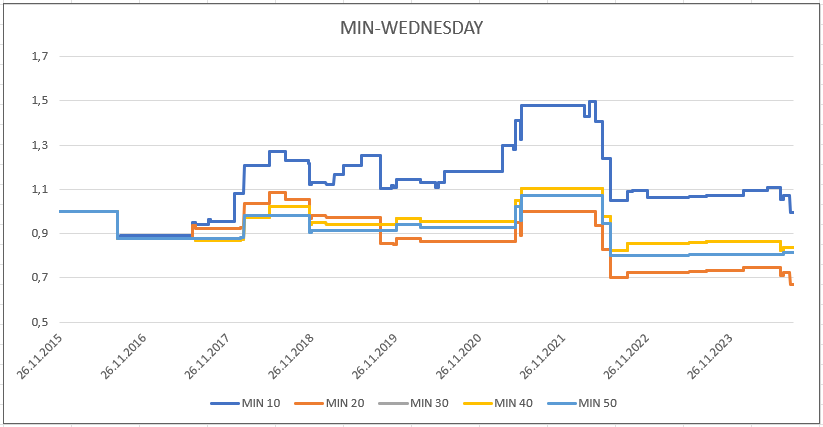
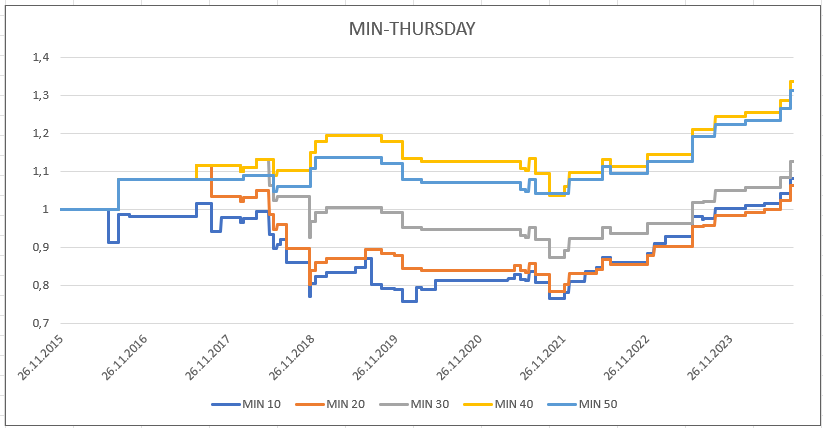
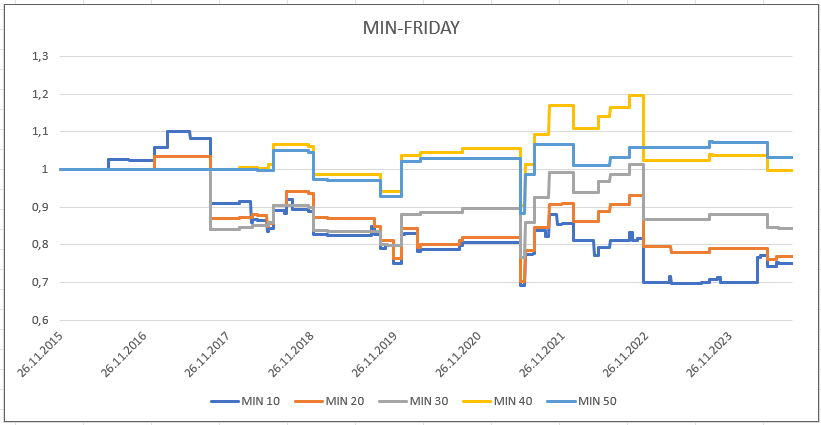
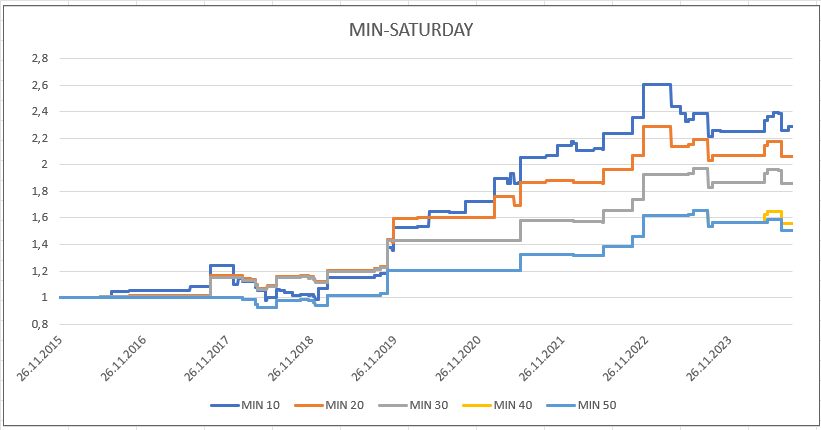
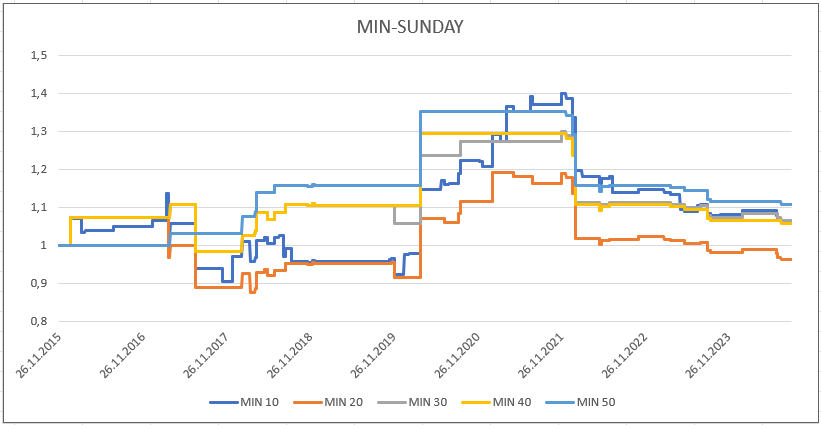
It is most profitable to buy BTC at the lowest price on Tuesdays and Saturdays, while the 10-day low again shows the best results. We believe that even in the MIN strategy, there is no seasonal effect. Moreover, the days of excellent performance are not consecutive, so this may be just a coincidence.
Conclusions
Despite some better-performing days, our study did not find any significant daily seasonal effects in Bitcoin's MIN/MAX strategy. Out-of-sample returns suggested that the MIN strategy performed less well than the one in the in-sample analysis. However, the MAX strategy was still very effective. It makes sense to consider applying trend-tracking rules to BTC if we assume the cryptocurrency will grow over the long term.
The original link:https://quantpedia.com/revisiting-trend-following-and-mean-reversion-strategies-in-bitcoin/
- When will the API for the Bitcoin Unified Securities Model be available?
- Quantitative Practice of DEX Exchanges (1) -- dYdX v4 User Guide
- Introduction to Lead-Lag Arbitrage in Cryptocurrency (3)
- When retesting, the data selects a real disk-level error 5416072
- Is this error occurring when the minimum transaction volume is set to 0.01?
- Please teach me the problem of reporting the error in the Bitcoin balance sheet.
- Please teach me JS code problems.
- Metcalfe's law in Bitcoin
- How many bitcoins should we allocate to the portfolio?
- How to profit from Bitcoin overnight trading?
- Why is the page always crashing?
- Building and implementing portfolio optimization using trading volume
- How do you update the parameters of a running disk?
- AI case studies: the strategy of multiple heads
- Strategy coding, professional quantification, former central company programmer, professional reliability.
- Simple versus advanced trading strategies - which is better?
- Python library for quantifying transactions
- Ornstein-Uhlenbeck simulation with Python